Introduction to TAU and TAU Commander Para Tools
![Target Platforms Cori Armstrong [XC 30] Haise [i. Data. Plex] Lightning [XC 30] Kilrain Target Platforms Cori Armstrong [XC 30] Haise [i. Data. Plex] Lightning [XC 30] Kilrain](https://slidetodoc.com/presentation_image_h2/f61159ffbd794bbe66fae35955fe0adc/image-21.jpg)


- Slides: 69

Introduction to TAU and TAU Commander Para. Tools, Inc. 28 September 2017 Webex from Baltimore, MD

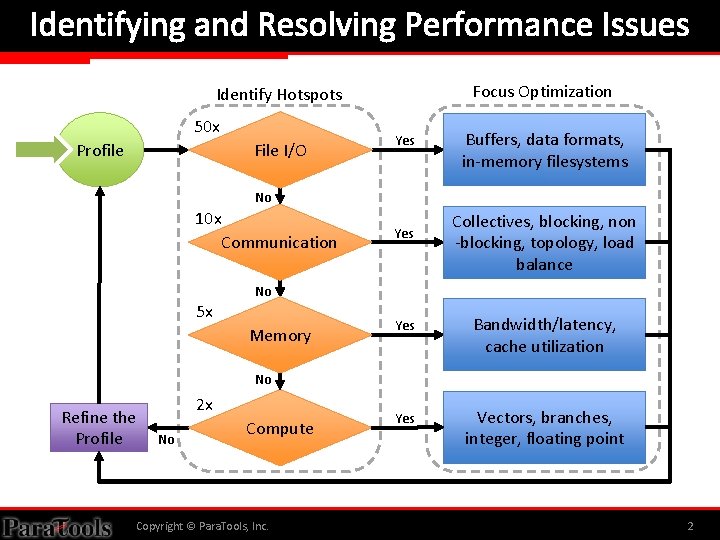
Identifying and Resolving Performance Issues Focus Optimization Identify Hotspots 50 x Profile File I/O Yes Buffers, data formats, in-memory filesystems No 10 x Communication Yes Collectives, blocking, non -blocking, topology, load balance No 5 x Memory Yes Bandwidth/latency, cache utilization Yes Vectors, branches, integer, floating point No Refine the Profile 2 x No Compute Copyright © Para. Tools, Inc. 2

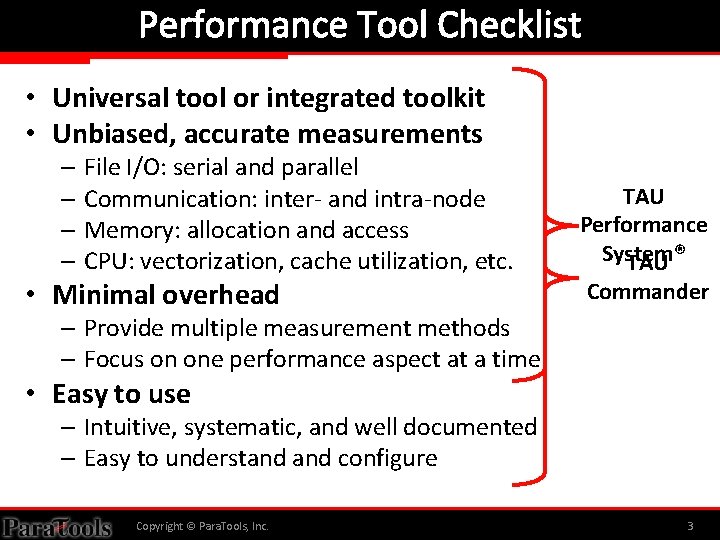
Performance Tool Checklist • Universal tool or integrated toolkit • Unbiased, accurate measurements – File I/O: serial and parallel – Communication: inter- and intra-node – Memory: allocation and access – CPU: vectorization, cache utilization, etc. • Minimal overhead TAU Performance System® TAU Commander – Provide multiple measurement methods – Focus on one performance aspect at a time • Easy to use – Intuitive, systematic, and well documented – Easy to understand configure Copyright © Para. Tools, Inc. 3

Para. Tools, Inc. THE TAU PERFORMANCE SYSTEM® Copyright © Para. Tools, Inc. 4

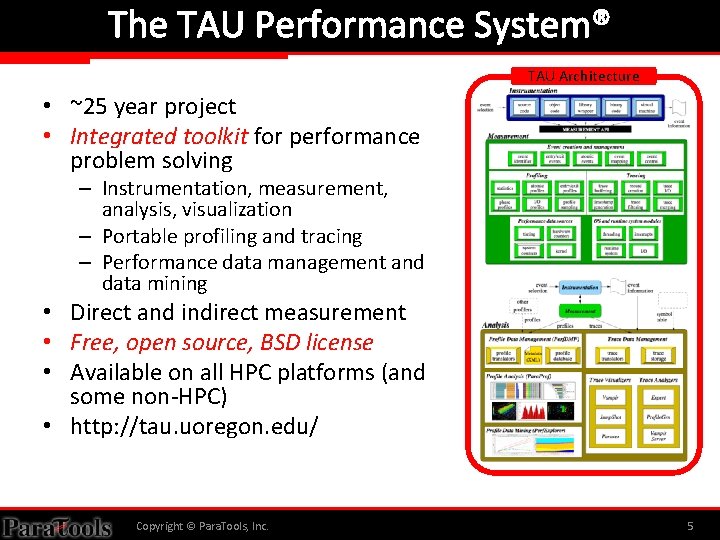
The TAU Performance System® TAU Architecture • ~25 year project • Integrated toolkit for performance problem solving – Instrumentation, measurement, analysis, visualization – Portable profiling and tracing – Performance data management and data mining • Direct and indirect measurement • Free, open source, BSD license • Available on all HPC platforms (and some non-HPC) • http: //tau. uoregon. edu/ Copyright © Para. Tools, Inc. 5

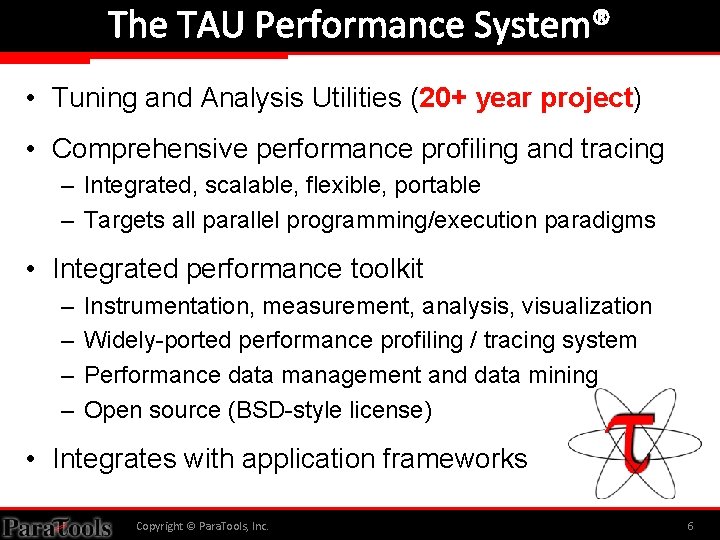
The TAU Performance System® • Tuning and Analysis Utilities (20+ year project) • Comprehensive performance profiling and tracing – Integrated, scalable, flexible, portable – Targets all parallel programming/execution paradigms • Integrated performance toolkit – – Instrumentation, measurement, analysis, visualization Widely-ported performance profiling / tracing system Performance data management and data mining Open source (BSD-style license) • Integrates with application frameworks Copyright © Para. Tools, Inc. 6

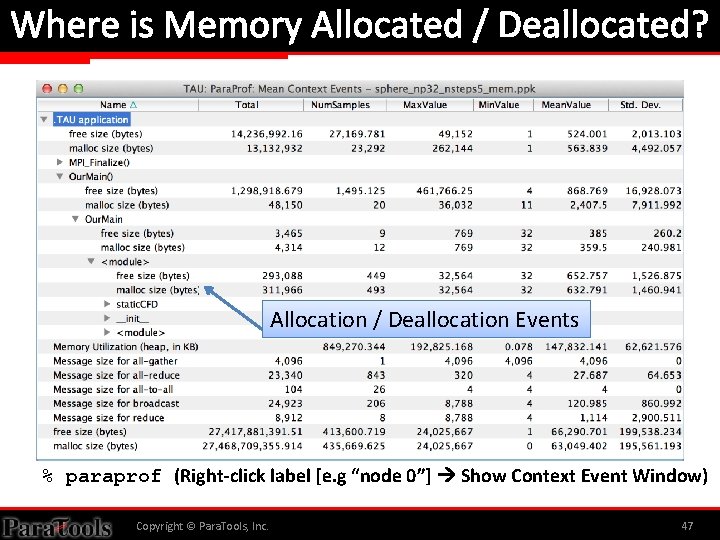
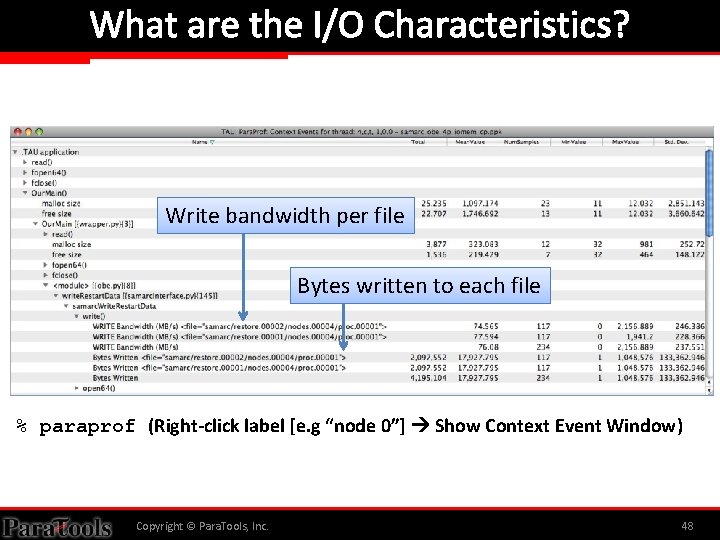
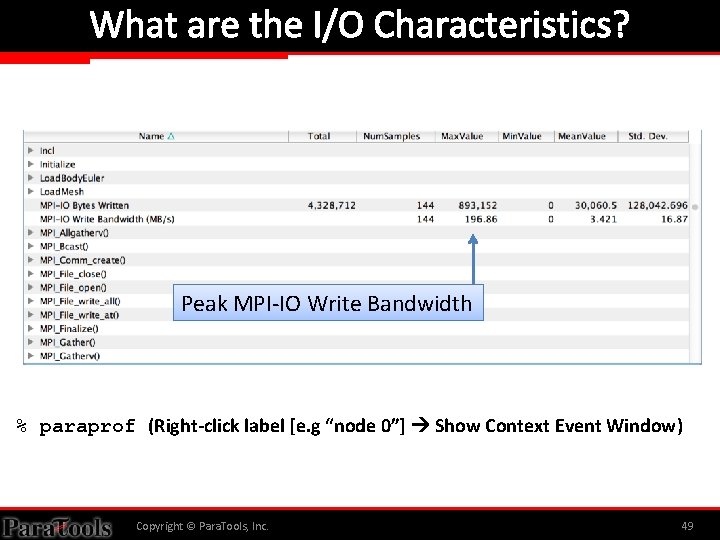
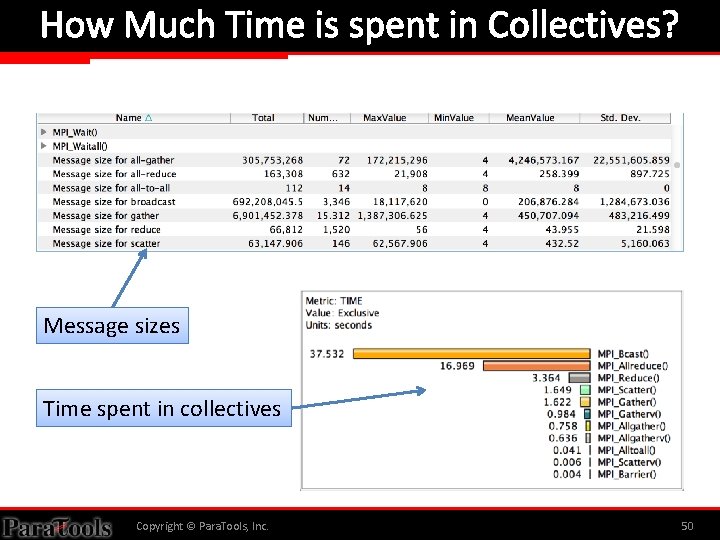
Questions TAU Can Answer • How much time is spent in each application routine and outer loops? Within loops, what is the contribution of each statement? • How many instructions are executed in these code regions? Floating point, Level 1 and 2 data cache misses, hits, branches taken, vector instructions? • What is the memory usage of the code? When and where is memory allocated/de-allocated? Are there any memory leaks? • What are the I/O characteristics of the code? What is the peak read and write bandwidth of individual calls, total volume? • What is the time spent waiting for collectives? • How does the application scale? Copyright © Para. Tools, Inc. 7

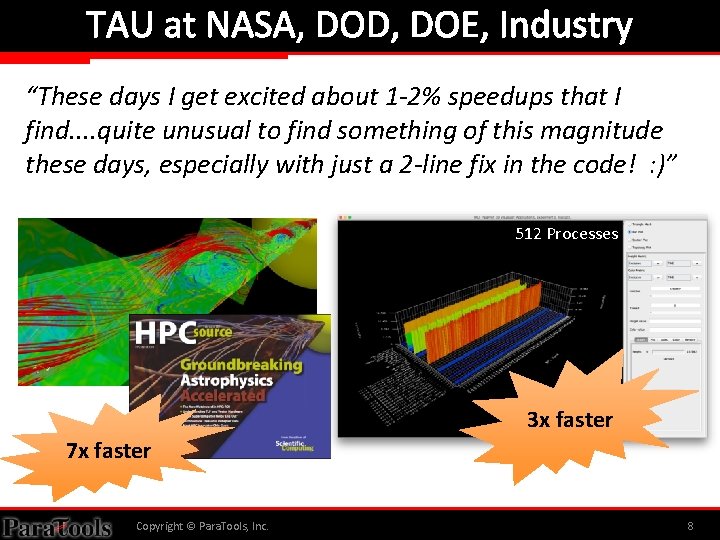
TAU at NASA, DOD, DOE, Industry “These days I get excited about 1 -2% speedups that I find. . quite unusual to find something of this magnitude these days, especially with just a 2 -line fix in the code! : )” 512 Processes 3 x faster 7 x faster Copyright © Para. Tools, Inc. 8

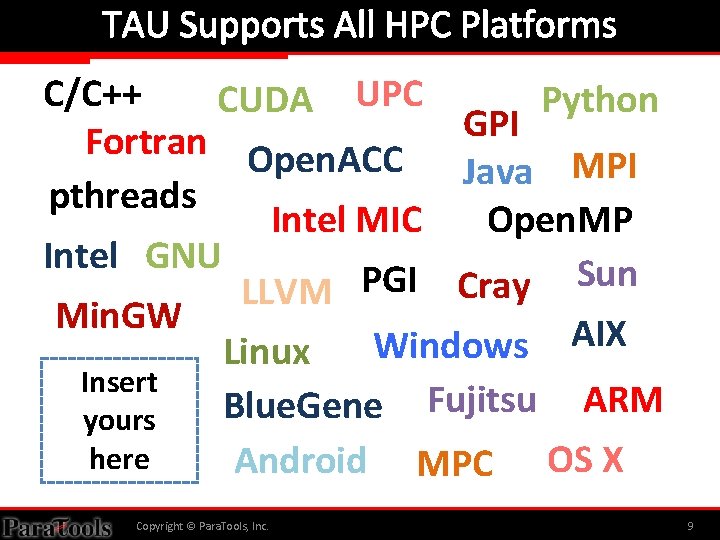
TAU Supports All HPC Platforms C/C++ CUDA UPC Python GPI Fortran Open. ACC Java MPI pthreads Intel MIC Open. MP Intel GNU Sun PGI Cray LLVM Min. GW AIX Windows Linux Insert Fujitsu ARM Blue. Gene yours here Android MPC OS X Copyright © Para. Tools, Inc. 9

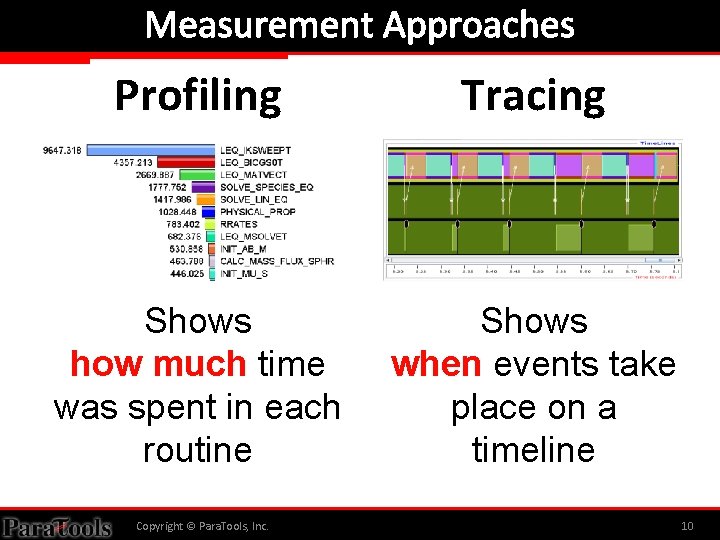
Measurement Approaches Profiling Tracing Shows how much time was spent in each routine Shows when events take place on a timeline Copyright © Para. Tools, Inc. 10

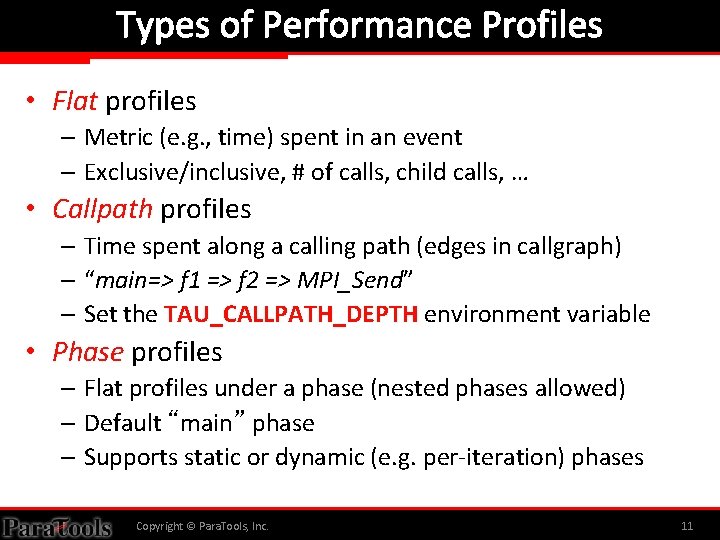
Types of Performance Profiles • Flat profiles – Metric (e. g. , time) spent in an event – Exclusive/inclusive, # of calls, child calls, … • Callpath profiles – Time spent along a calling path (edges in callgraph) – “main=> f 1 => f 2 => MPI_Send” – Set the TAU_CALLPATH_DEPTH environment variable • Phase profiles – Flat profiles under a phase (nested phases allowed) – Default “main” phase – Supports static or dynamic (e. g. per-iteration) phases Copyright © Para. Tools, Inc. 11

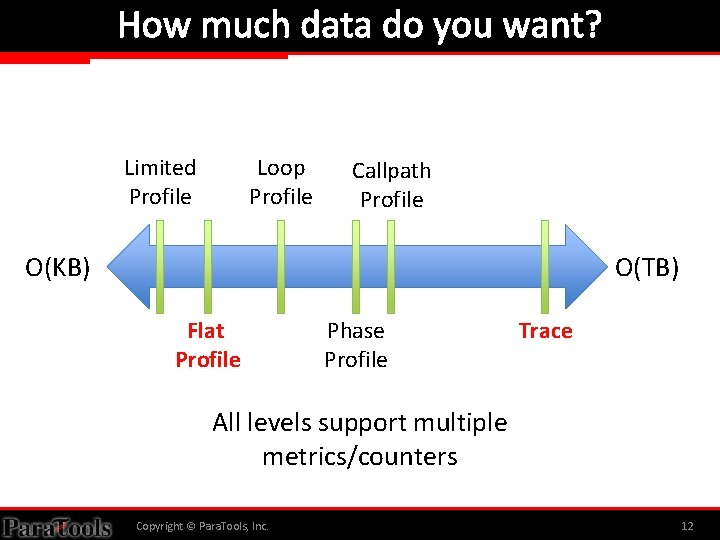
How much data do you want? Limited Profile Loop Profile Callpath Profile O(KB) O(TB) Flat Profile Phase Profile Trace All levels support multiple metrics/counters Copyright © Para. Tools, Inc. 12

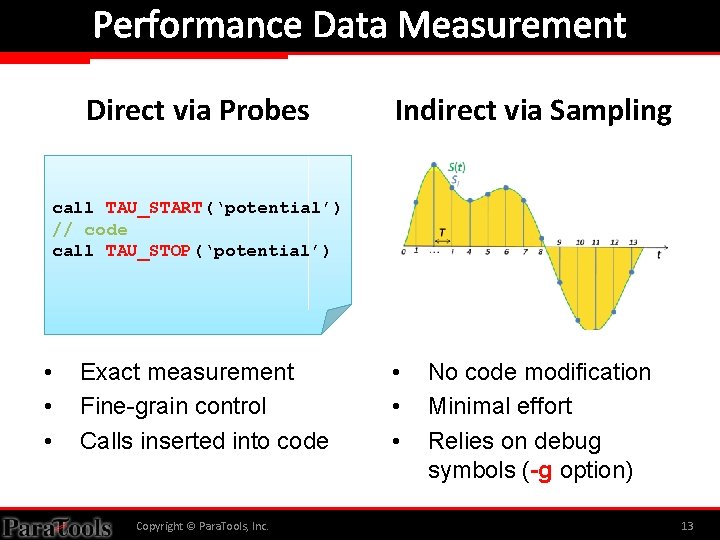
Performance Data Measurement Direct via Probes Indirect via Sampling call TAU_START(‘potential’) // code call TAU_STOP(‘potential’) • • • Exact measurement Fine-grain control Calls inserted into code Copyright © Para. Tools, Inc. • • • No code modification Minimal effort Relies on debug symbols (-g option) 13

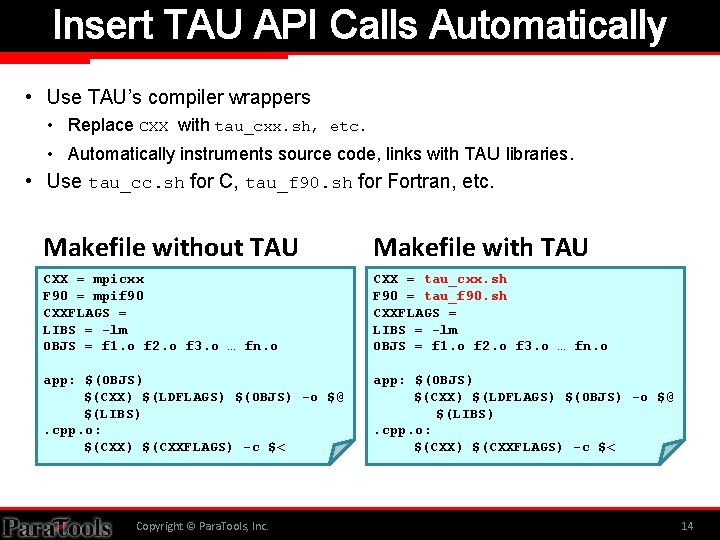
Insert TAU API Calls Automatically • Use TAU’s compiler wrappers • Replace CXX with tau_cxx. sh, etc. • Automatically instruments source code, links with TAU libraries. • Use tau_cc. sh for C, tau_f 90. sh for Fortran, etc. Makefile without TAU Makefile with TAU CXX = mpicxx F 90 = mpif 90 CXXFLAGS = LIBS = -lm OBJS = f 1. o f 2. o f 3. o … fn. o CXX = tau_cxx. sh F 90 = tau_f 90. sh CXXFLAGS = LIBS = -lm OBJS = f 1. o f 2. o f 3. o … fn. o app: $(OBJS) $(CXX) $(LDFLAGS) $(OBJS) -o $@ $(LIBS). cpp. o: $(CXX) $(CXXFLAGS) -c $< Copyright © Para. Tools, Inc. 14

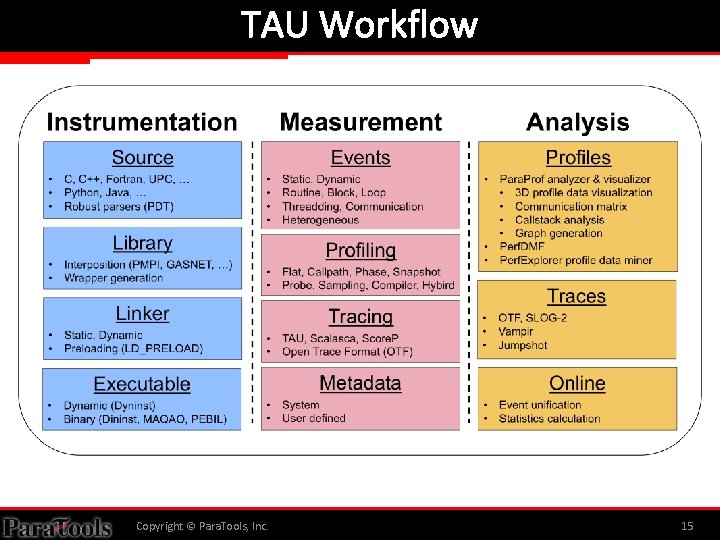
TAU Workflow Copyright © Para. Tools, Inc. 15

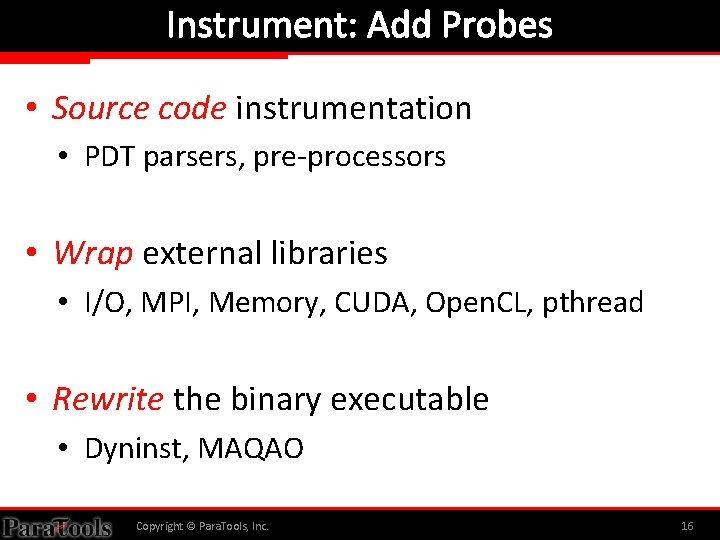
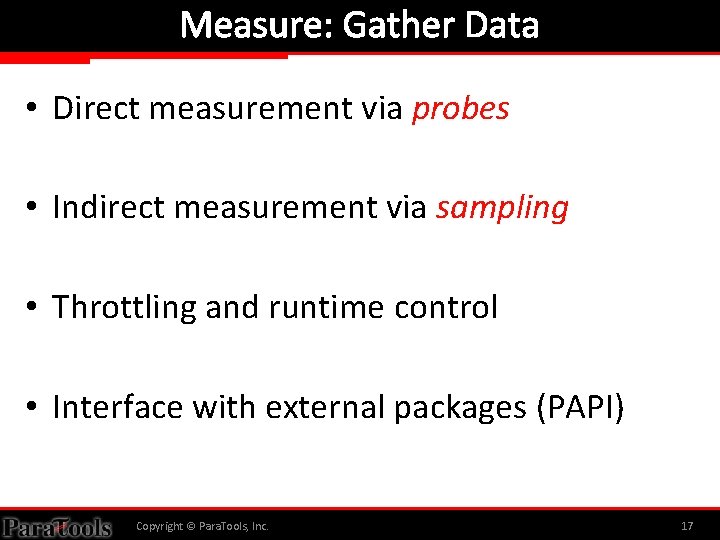
Instrument: Add Probes • Source code instrumentation • PDT parsers, pre-processors • Wrap external libraries • I/O, MPI, Memory, CUDA, Open. CL, pthread • Rewrite the binary executable • Dyninst, MAQAO Copyright © Para. Tools, Inc. 16

Measure: Gather Data • Direct measurement via probes • Indirect measurement via sampling • Throttling and runtime control • Interface with external packages (PAPI) Copyright © Para. Tools, Inc. 17

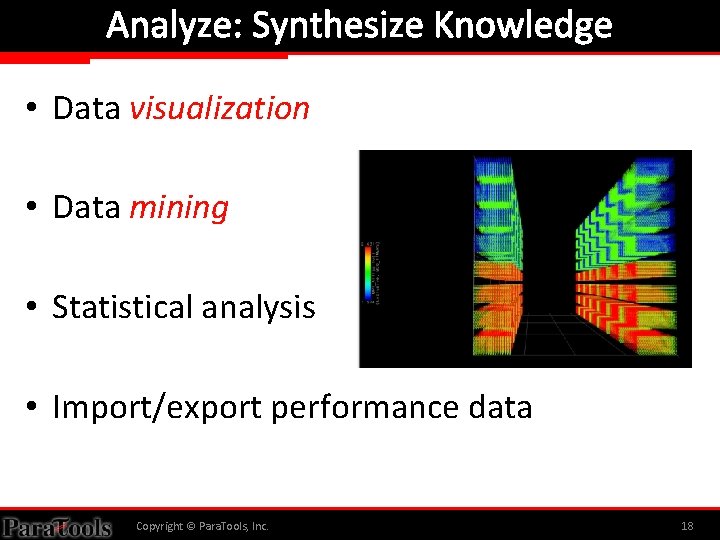
Analyze: Synthesize Knowledge • Data visualization • Data mining • Statistical analysis • Import/export performance data Copyright © Para. Tools, Inc. 18

Para. Tools, Inc. A QUICK CASE STUDY Copyright © Para. Tools, Inc. 19

![Target Platforms Cori Armstrong XC 30 Haise i Data Plex Lightning XC 30 Kilrain Target Platforms Cori Armstrong [XC 30] Haise [i. Data. Plex] Lightning [XC 30] Kilrain](https://slidetodoc.com/presentation_image_h2/f61159ffbd794bbe66fae35955fe0adc/image-21.jpg)
Target Platforms Cori Armstrong [XC 30] Haise [i. Data. Plex] Lightning [XC 30] Kilrain [i. Data. Plex] Copyright © Para. Tools, Inc. 21

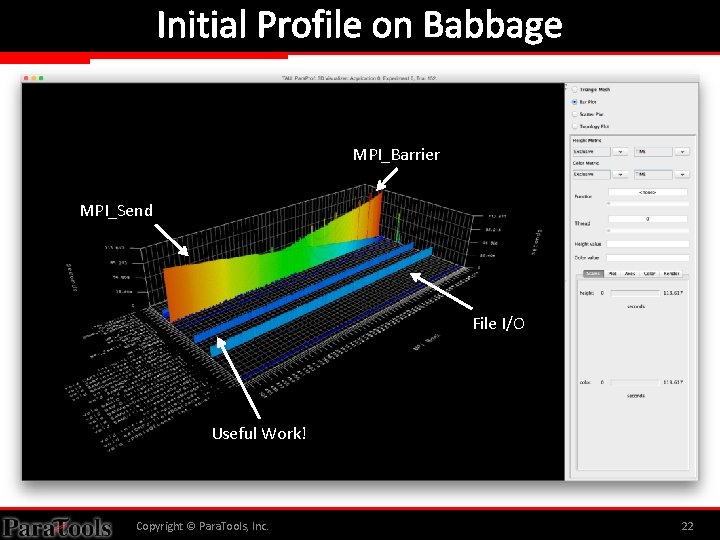
Initial Profile on Babbage MPI_Barrier MPI_Send File I/O Useful Work! Copyright © Para. Tools, Inc. 22

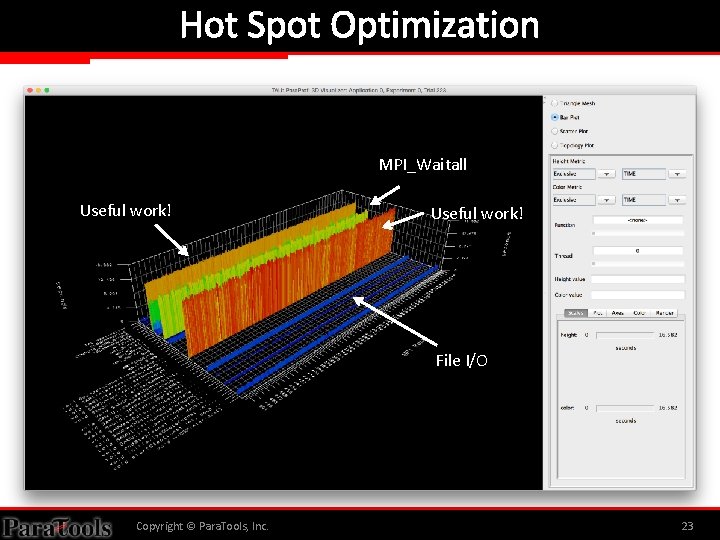
Hot Spot Optimization MPI_Waitall Useful work! File I/O Copyright © Para. Tools, Inc. 23

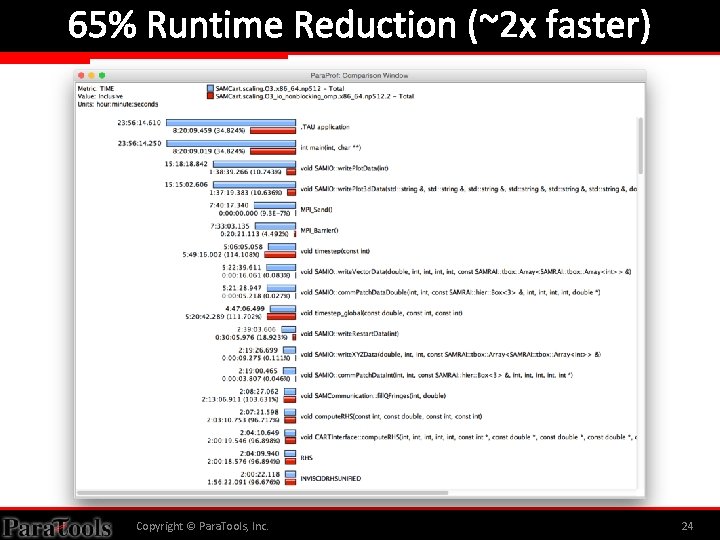
65% Runtime Reduction (~2 x faster) Copyright © Para. Tools, Inc. 24

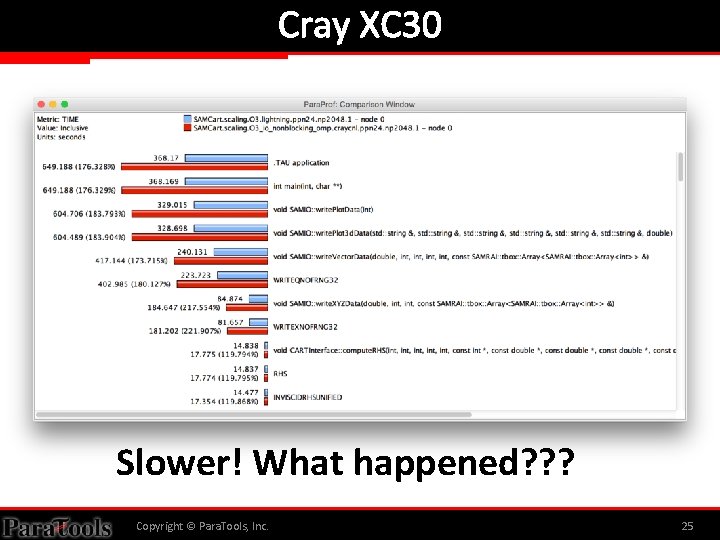
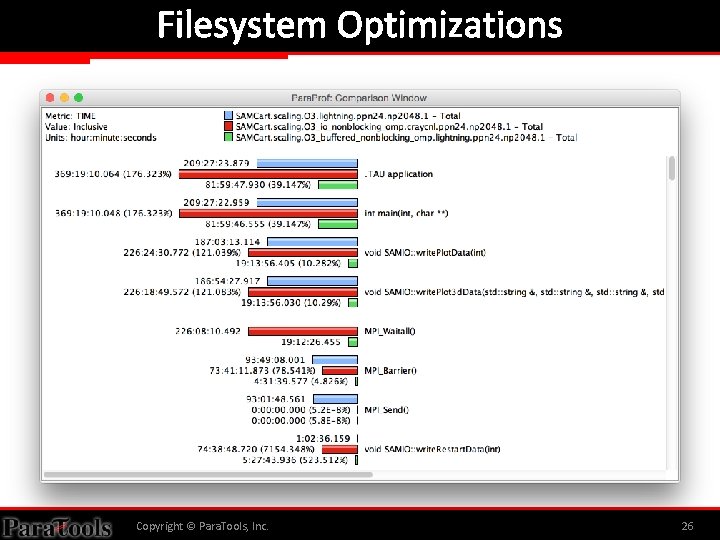
Cray XC 30 Slower! What happened? ? ? Copyright © Para. Tools, Inc. 25

Filesystem Optimizations Copyright © Para. Tools, Inc. 26

Para. Tools, Inc. TAU COMMANDER Copyright © Para. Tools, Inc. 27

TAU is a Tool for Experts Copyright © Para. Tools, Inc. 28

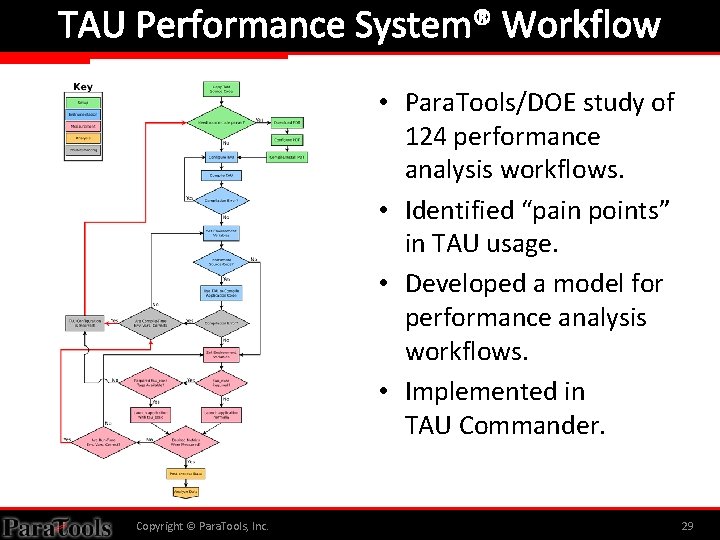
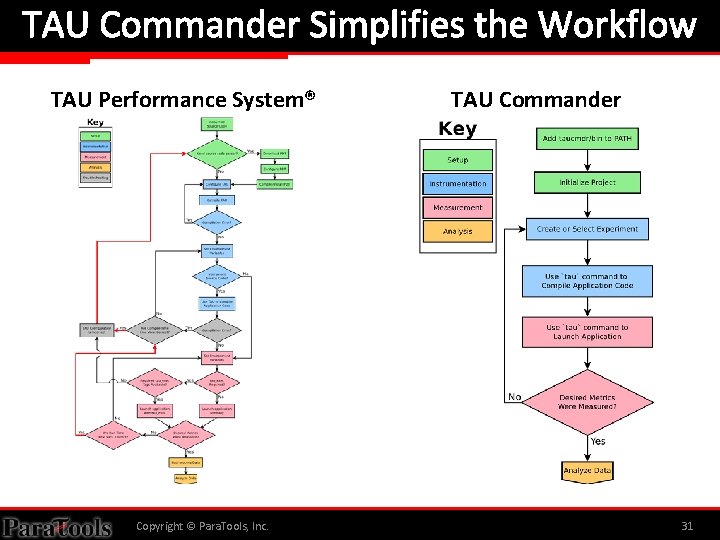
TAU Performance System® Workflow • Para. Tools/DOE study of 124 performance analysis workflows. • Identified “pain points” in TAU usage. • Developed a model for performance analysis workflows. • Implemented in TAU Commander. Copyright © Para. Tools, Inc. 29

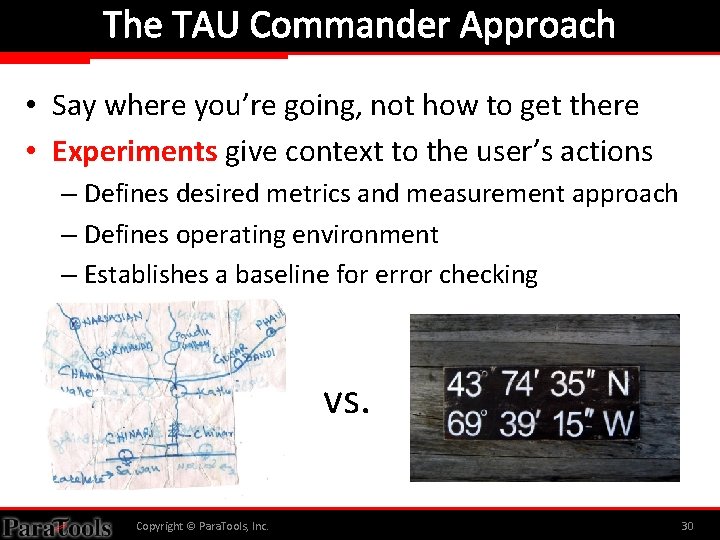
The TAU Commander Approach • Say where you’re going, not how to get there • Experiments give context to the user’s actions – Defines desired metrics and measurement approach – Defines operating environment – Establishes a baseline for error checking vs. Copyright © Para. Tools, Inc. 30

TAU Commander Simplifies the Workflow TAU Performance System® Copyright © Para. Tools, Inc. TAU Commander 31

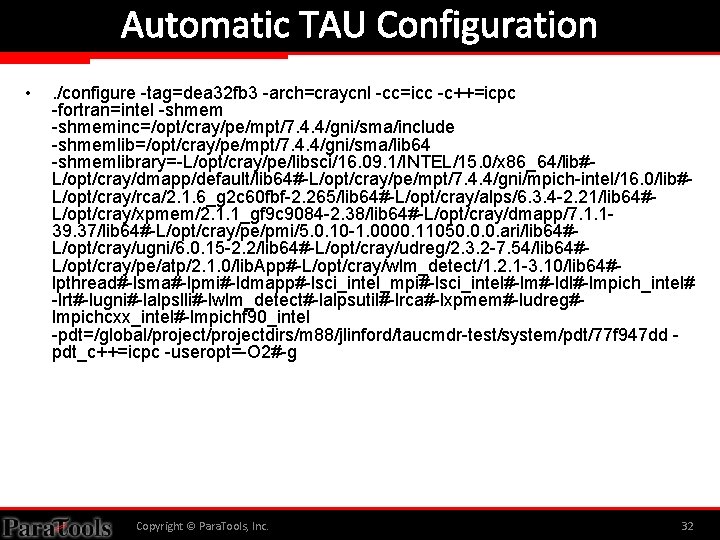
Automatic TAU Configuration • . /configure -tag=dea 32 fb 3 -arch=craycnl -cc=icc -c++=icpc -fortran=intel -shmeminc=/opt/cray/pe/mpt/7. 4. 4/gni/sma/include -shmemlib=/opt/cray/pe/mpt/7. 4. 4/gni/sma/lib 64 -shmemlibrary=-L/opt/cray/pe/libsci/16. 09. 1/INTEL/15. 0/x 86_64/lib#L/opt/cray/dmapp/default/lib 64#-L/opt/cray/pe/mpt/7. 4. 4/gni/mpich-intel/16. 0/lib#L/opt/cray/rca/2. 1. 6_g 2 c 60 fbf-2. 265/lib 64#-L/opt/cray/alps/6. 3. 4 -2. 21/lib 64#L/opt/cray/xpmem/2. 1. 1_gf 9 c 9084 -2. 38/lib 64#-L/opt/cray/dmapp/7. 1. 139. 37/lib 64#-L/opt/cray/pe/pmi/5. 0. 10 -1. 0000. 11050. 0. 0. ari/lib 64#L/opt/cray/ugni/6. 0. 15 -2. 2/lib 64#-L/opt/cray/udreg/2. 3. 2 -7. 54/lib 64#L/opt/cray/pe/atp/2. 1. 0/lib. App#-L/opt/cray/wlm_detect/1. 2. 1 -3. 10/lib 64#lpthread#-lsma#-lpmi#-ldmapp#-lsci_intel_mpi#-lsci_intel#-lm#-ldl#-lmpich_intel# -lrt#-lugni#-lalpslli#-lwlm_detect#-lalpsutil#-lrca#-lxpmem#-ludreg#lmpichcxx_intel#-lmpichf 90_intel -pdt=/global/projectdirs/m 88/jlinford/taucmdr-test/system/pdt/77 f 947 dd pdt_c++=icpc -useropt=-O 2#-g Copyright © Para. Tools, Inc. 32

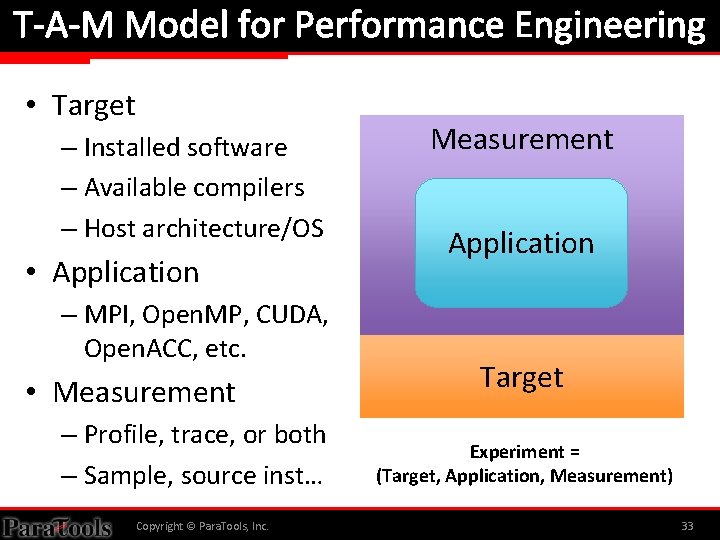
T-A-M Model for Performance Engineering • Target – Installed software – Available compilers – Host architecture/OS • Application – MPI, Open. MP, CUDA, Open. ACC, etc. • Measurement – Profile, trace, or both – Sample, source inst… Copyright © Para. Tools, Inc. Measurement Application Target Experiment = (Target, Application, Measurement) 33

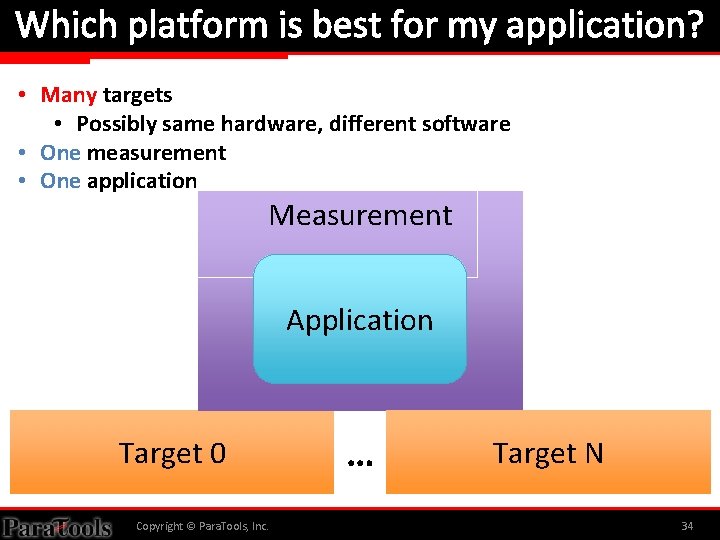
Which platform is best for my application? • Many targets • Possibly same hardware, different software • One measurement • One application Measurement Application Target 0 Copyright © Para. Tools, Inc. … Target N 34

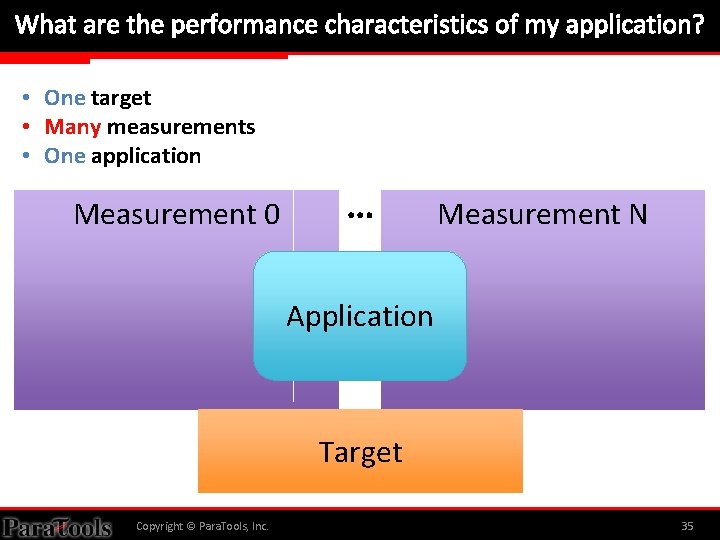
What are the performance characteristics of my application? • One target • Many measurements • One application Measurement 0 … Measurement N Application Target Copyright © Para. Tools, Inc. 35

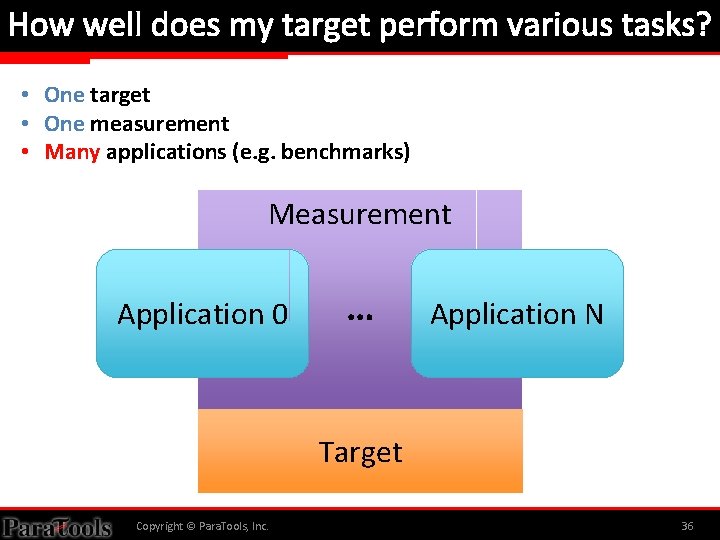
How well does my target perform various tasks? • One target • One measurement • Many applications (e. g. benchmarks) Measurement Application 0 … Application N Target Copyright © Para. Tools, Inc. 36

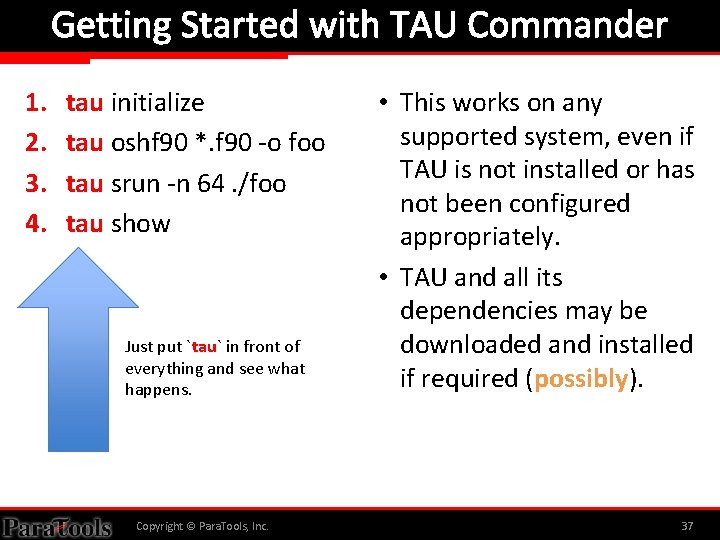
Getting Started with TAU Commander 1. 2. 3. 4. tau initialize tau oshf 90 *. f 90 -o foo tau srun -n 64. /foo tau show Just put `tau` in front of everything and see what happens. Copyright © Para. Tools, Inc. • This works on any supported system, even if TAU is not installed or has not been configured appropriately. • TAU and all its dependencies may be downloaded and installed if required (possibly). 37

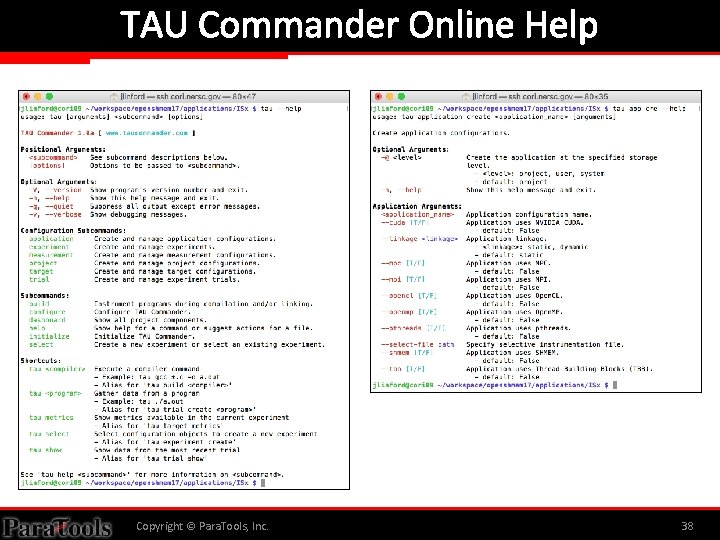
TAU Commander Online Help Copyright © Para. Tools, Inc. 38

Para. Tools, Inc. INTRODUCTORY DATA ANALYSIS Copyright © Para. Tools, Inc. 39

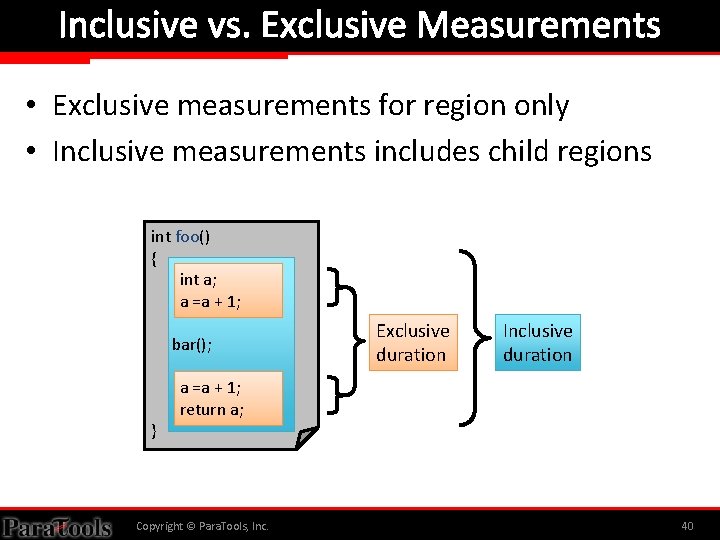
Inclusive vs. Exclusive Measurements • Exclusive measurements for region only • Inclusive measurements includes child regions int foo() { int a; a =a + 1; bar(); } Exclusive duration Inclusive duration a =a + 1; return a; Copyright © Para. Tools, Inc. 40

Direct Observation Events • Interval events (begin/end events) – Measures exclusive & inclusive durations between events – Metrics monotonically increase – Example: Wall-clock timer • Atomic events (trigger with data value) – Used to capture performance data state – Shows extent of variation of triggered values (min/max/mean) – Example: heap memory consumed at a particular point Copyright © Para. Tools, Inc. 41

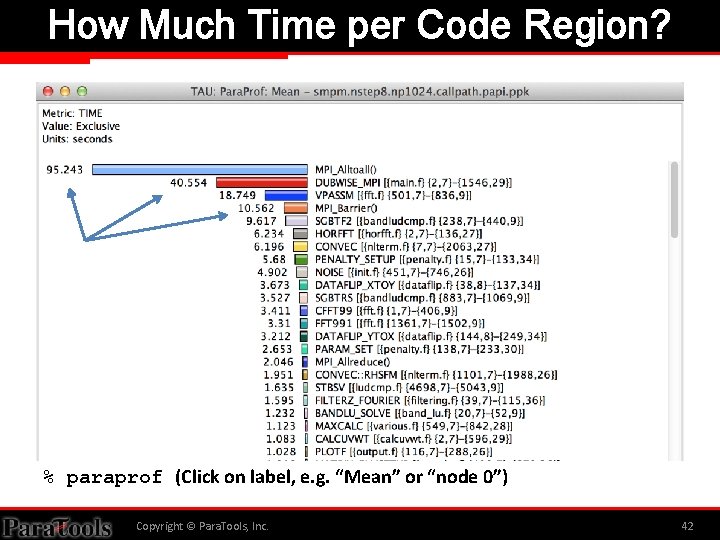
How Much Time per Code Region? % paraprof (Click on label, e. g. “Mean” or “node 0”) Copyright © Para. Tools, Inc. 42

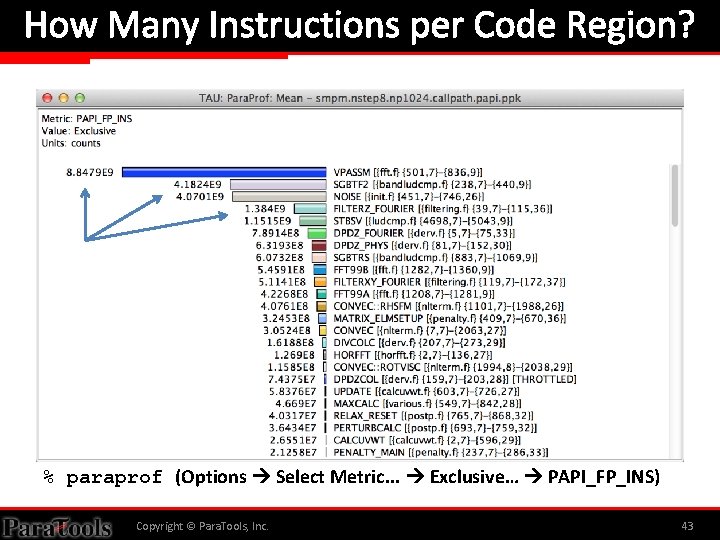
How Many Instructions per Code Region? % paraprof (Options Select Metric. . . Exclusive… PAPI_FP_INS) Copyright © Para. Tools, Inc. 43

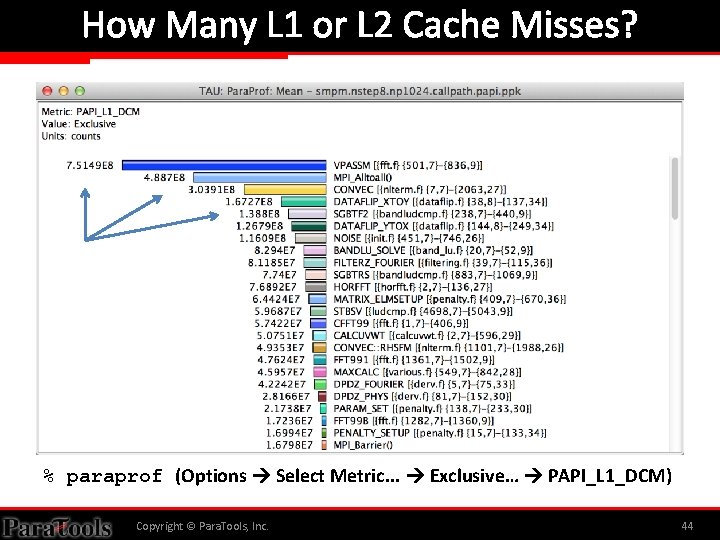
How Many L 1 or L 2 Cache Misses? % paraprof (Options Select Metric. . . Exclusive… PAPI_L 1_DCM) Copyright © Para. Tools, Inc. 44

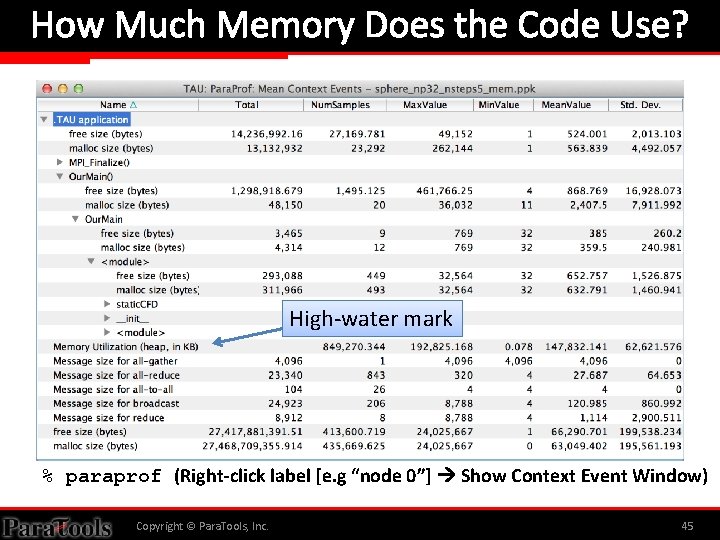
How Much Memory Does the Code Use? High-water mark % paraprof (Right-click label [e. g “node 0”] Show Context Event Window) Copyright © Para. Tools, Inc. 45

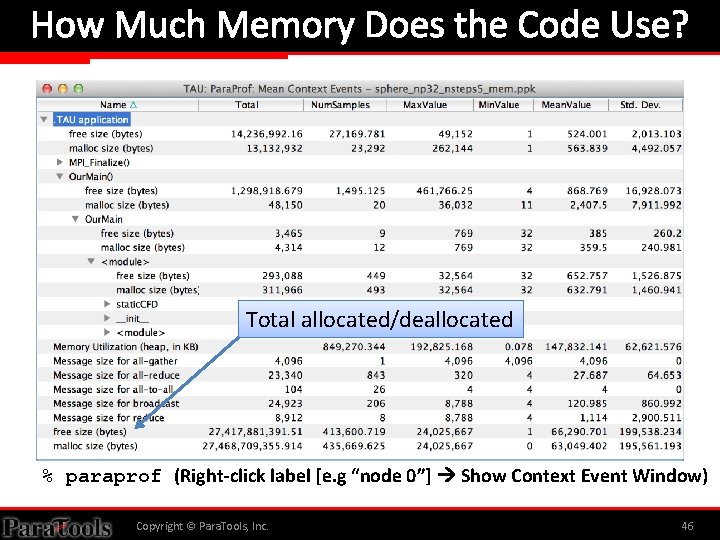
How Much Memory Does the Code Use? Total allocated/deallocated % paraprof (Right-click label [e. g “node 0”] Show Context Event Window) Copyright © Para. Tools, Inc. 46

Where is Memory Allocated / Deallocated? Allocation / Deallocation Events % paraprof (Right-click label [e. g “node 0”] Show Context Event Window) Copyright © Para. Tools, Inc. 47

What are the I/O Characteristics? Write bandwidth per file Bytes written to each file % paraprof (Right-click label [e. g “node 0”] Show Context Event Window) Copyright © Para. Tools, Inc. 48

What are the I/O Characteristics? Peak MPI-IO Write Bandwidth % paraprof (Right-click label [e. g “node 0”] Show Context Event Window) Copyright © Para. Tools, Inc. 49

How Much Time is spent in Collectives? Message sizes Time spent in collectives Copyright © Para. Tools, Inc. 50

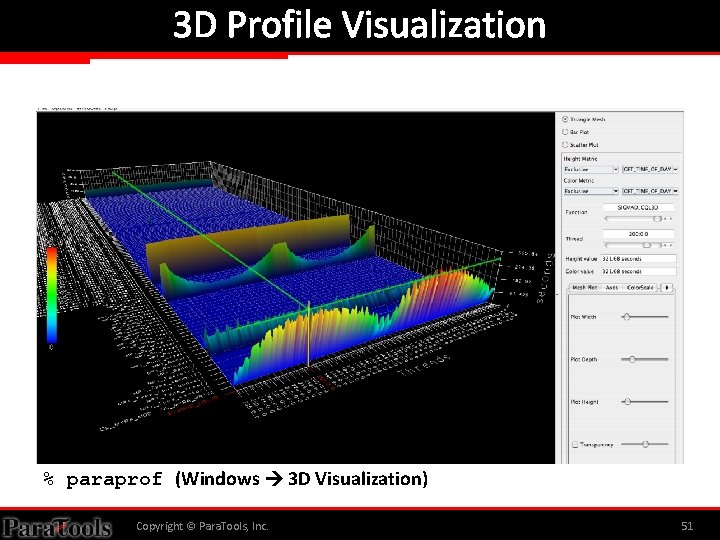
3 D Profile Visualization % paraprof (Windows 3 D Visualization) Copyright © Para. Tools, Inc. 51

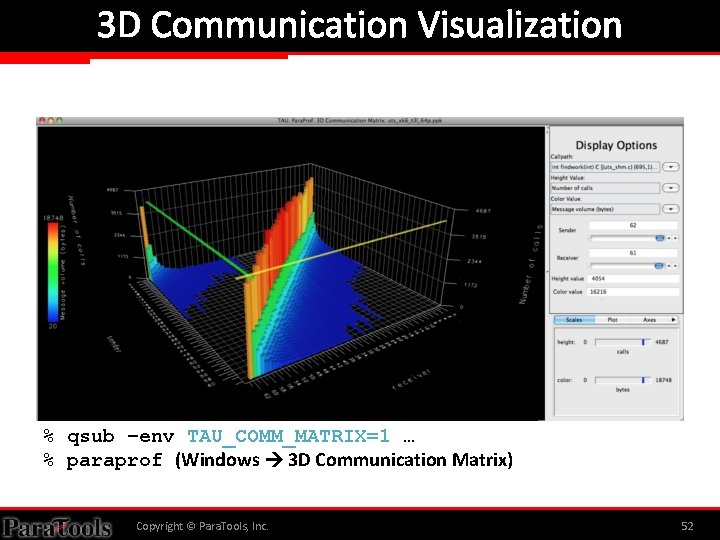
3 D Communication Visualization % qsub –env TAU_COMM_MATRIX=1 … % paraprof (Windows 3 D Communication Matrix) Copyright © Para. Tools, Inc. 52

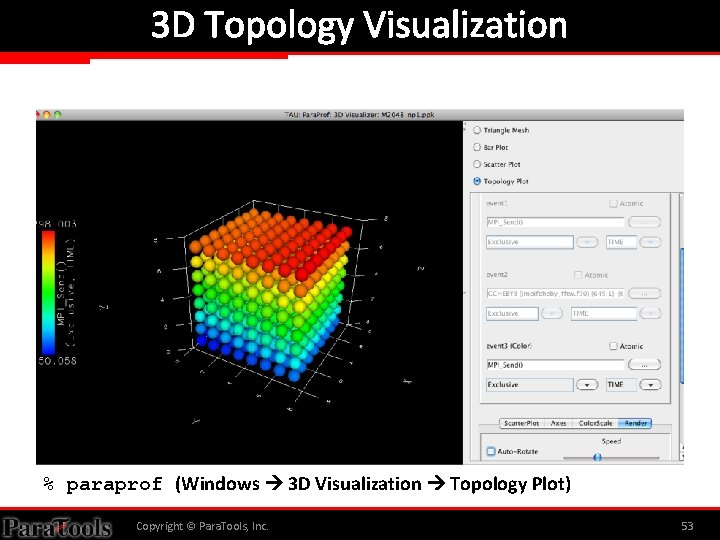
3 D Topology Visualization % paraprof (Windows 3 D Visualization Topology Plot) Copyright © Para. Tools, Inc. 53

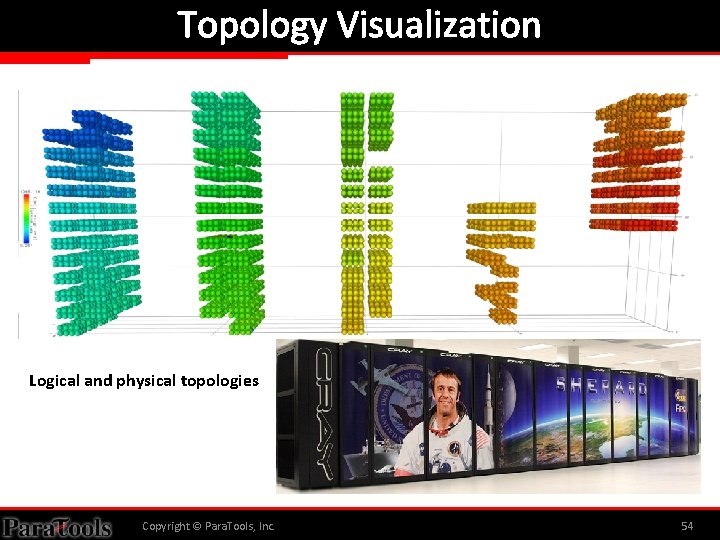
Topology Visualization Logical and physical topologies Copyright © Para. Tools, Inc. 54

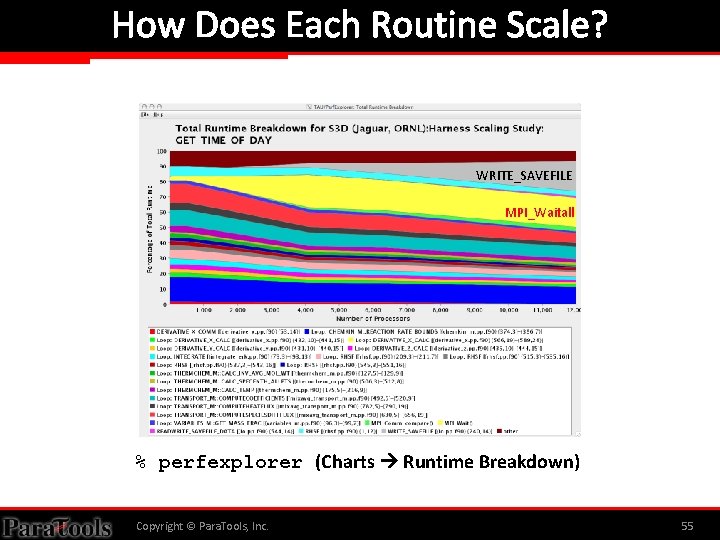
How Does Each Routine Scale? WRITE_SAVEFILE MPI_Waitall % perfexplorer (Charts Runtime Breakdown) Copyright © Para. Tools, Inc. 55

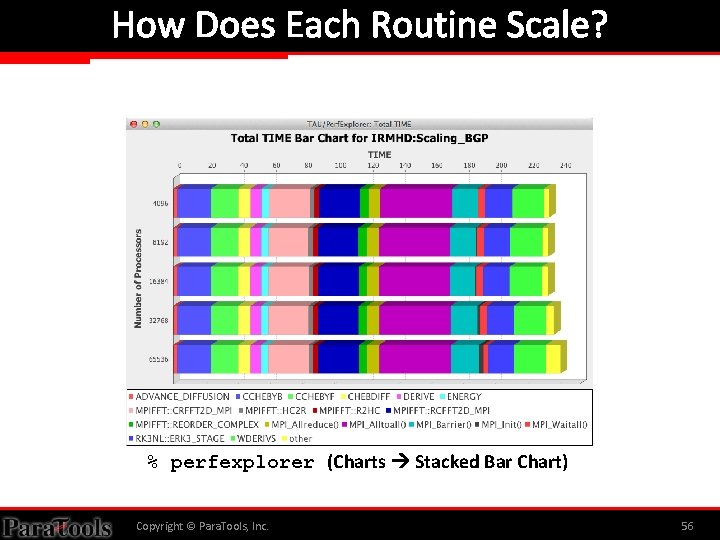
How Does Each Routine Scale? % perfexplorer (Charts Stacked Bar Chart) Copyright © Para. Tools, Inc. 56

Which Events Correlate with Runtime? % perfexplorer (Charts Correlate Events with Total Runtime) Copyright © Para. Tools, Inc. 57

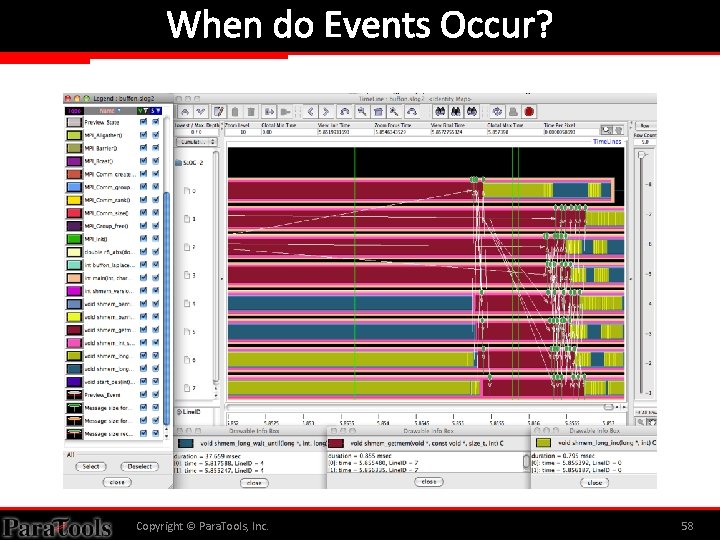
When do Events Occur? Copyright © Para. Tools, Inc. 58

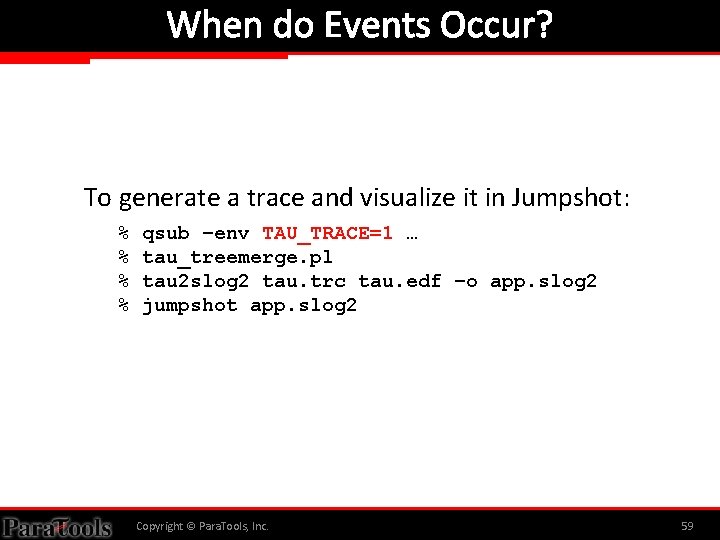
When do Events Occur? To generate a trace and visualize it in Jumpshot: % % qsub –env TAU_TRACE=1 … tau_treemerge. pl tau 2 slog 2 tau. trc tau. edf –o app. slog 2 jumpshot app. slog 2 Copyright © Para. Tools, Inc. 59

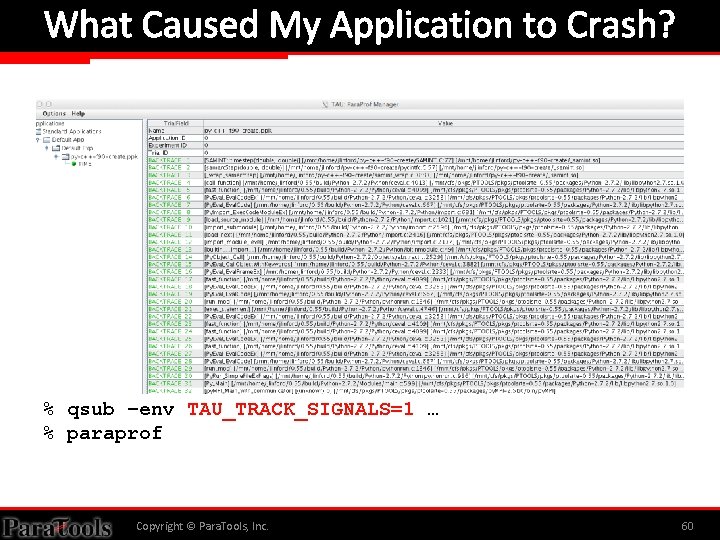
What Caused My Application to Crash? % qsub –env TAU_TRACK_SIGNALS=1 … % paraprof Copyright © Para. Tools, Inc. 60

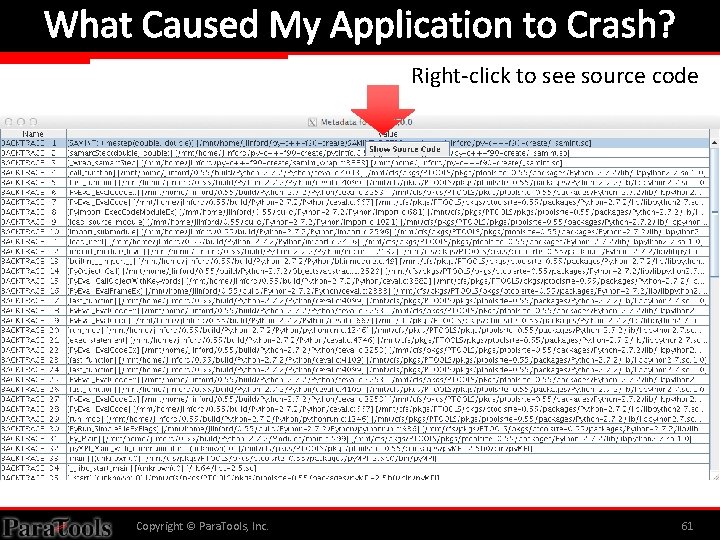
What Caused My Application to Crash? Right-click to see source code Copyright © Para. Tools, Inc. 61

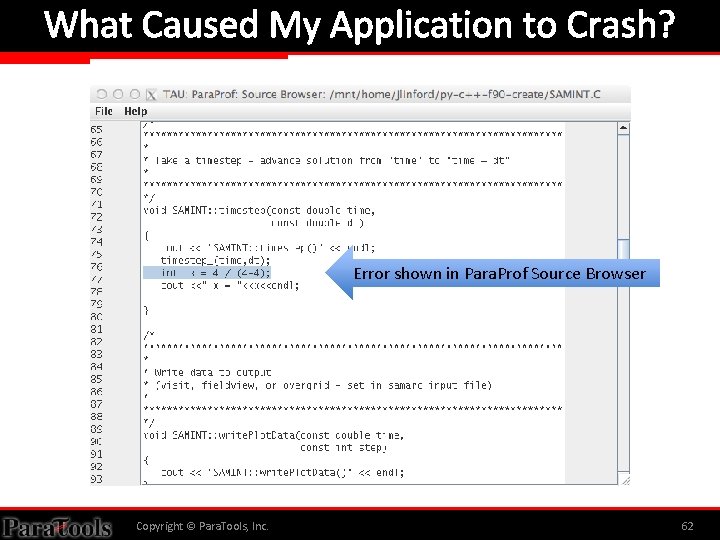
What Caused My Application to Crash? Error shown in Para. Prof Source Browser Copyright © Para. Tools, Inc. 62

No admin needed! Para. Tools, Inc. TAU COMMANDER FOR YOU Copyright © Para. Tools, Inc. 63

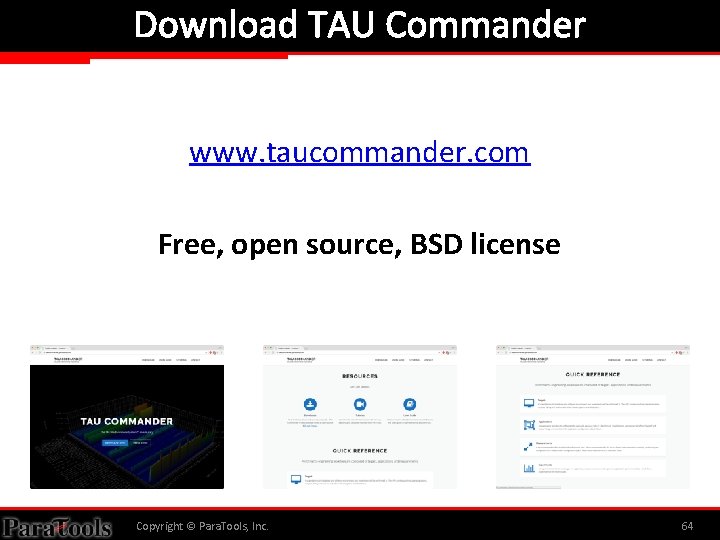
Download TAU Commander www. taucommander. com Free, open source, BSD license Copyright © Para. Tools, Inc. 64

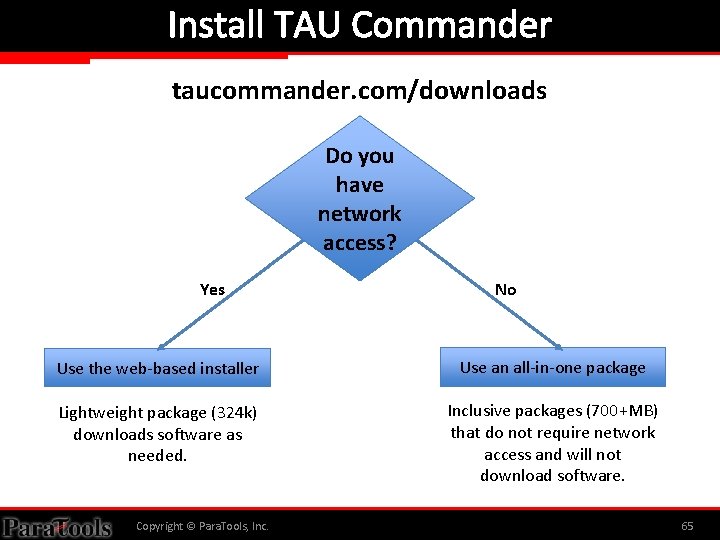
Install TAU Commander taucommander. com/downloads Do you have network access? Yes No Use the web-based installer Use an all-in-one package Lightweight package (324 k) downloads software as needed. Inclusive packages (700+MB) that do not require network access and will not download software. Copyright © Para. Tools, Inc. 65

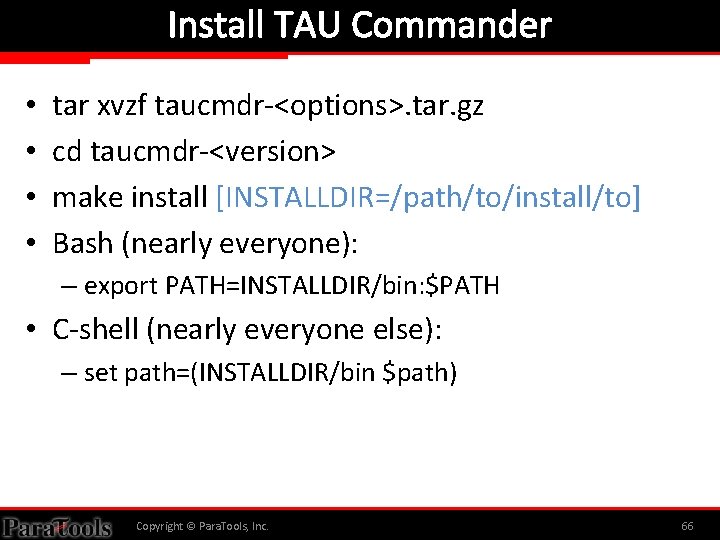
Install TAU Commander • • tar xvzf taucmdr-<options>. tar. gz cd taucmdr-<version> make install [INSTALLDIR=/path/to/install/to] Bash (nearly everyone): – export PATH=INSTALLDIR/bin: $PATH • C-shell (nearly everyone else): – set path=(INSTALLDIR/bin $path) Copyright © Para. Tools, Inc. 66

Para. Tools, Inc. APPENDIX: USING THE TAU PERFORMANCE SYSTEM (NOT TAU COMMANDER) Copyright © Para. Tools, Inc. 67

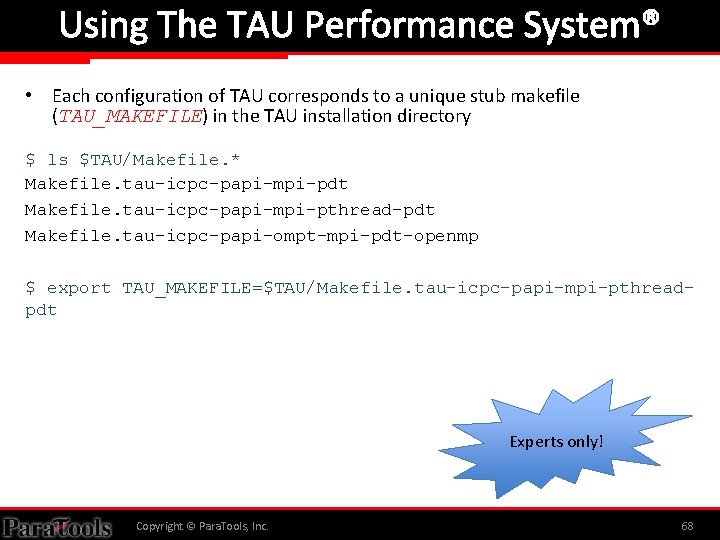
Using The TAU Performance System® • Each configuration of TAU corresponds to a unique stub makefile (TAU_MAKEFILE) in the TAU installation directory $ ls $TAU/Makefile. * Makefile. tau-icpc-papi-mpi-pdt Makefile. tau-icpc-papi-mpi-pthread-pdt Makefile. tau-icpc-papi-ompt-mpi-pdt-openmp $ export TAU_MAKEFILE=$TAU/Makefile. tau-icpc-papi-mpi-pthreadpdt Experts only! Copyright © Para. Tools, Inc. 68

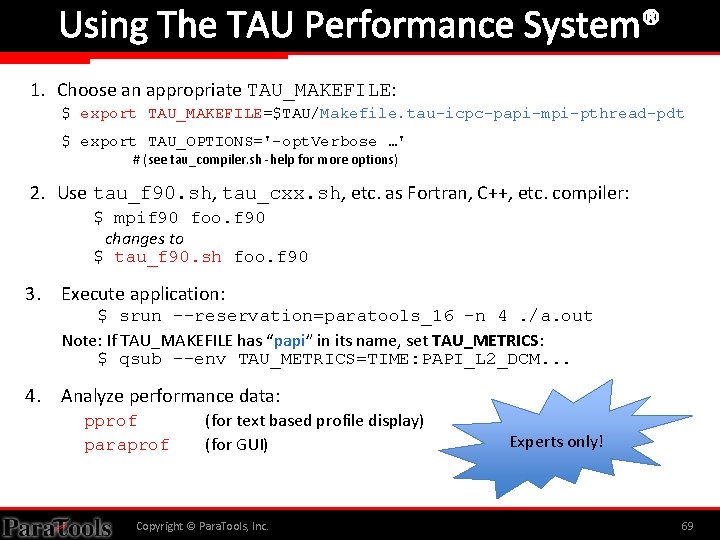
Using The TAU Performance System® 1. Choose an appropriate TAU_MAKEFILE: $ export TAU_MAKEFILE=$TAU/Makefile. tau-icpc-papi-mpi-pthread-pdt $ export TAU_OPTIONS='-opt. Verbose …' # (see tau_compiler. sh -help for more options) 2. Use tau_f 90. sh, tau_cxx. sh, etc. as Fortran, C++, etc. compiler: $ mpif 90 foo. f 90 changes to $ tau_f 90. sh foo. f 90 3. Execute application: $ srun --reservation=paratools_16 -n 4. /a. out Note: If TAU_MAKEFILE has “papi” in its name, set TAU_METRICS: $ qsub --env TAU_METRICS=TIME: PAPI_L 2_DCM. . . 4. Analyze performance data: pprof paraprof (for text based profile display) (for GUI) Copyright © Para. Tools, Inc. Experts only! 69