R commander an introduction userfriendly and absolutely free

R commander an introduction user-friendly and absolutely free Ho Kim SCHOOL OF PUBLIC HEALTH, SNU

Installing R commander ① • You need to first install R and then R commander.
")
Installing R commander ② • Write on R console window like install. packages(“Rcmdr”)
")
Starting the R commander library(Rcmdr)

R commander windows Script window Output window Messages window

Importing datasets

Select the data set by clicking on this box

Checking continuous variables • Statistics->Means • options – – – Single-sample t-test Independent samples t-test Paired t-test One-way ANOVA Multi-way ANOVA
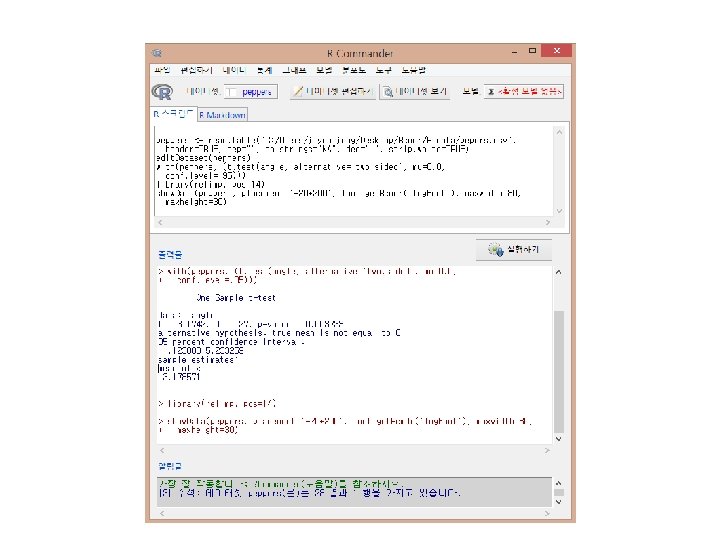
 • Statistics > Means > Single-sample t-test (Enter the proposed")
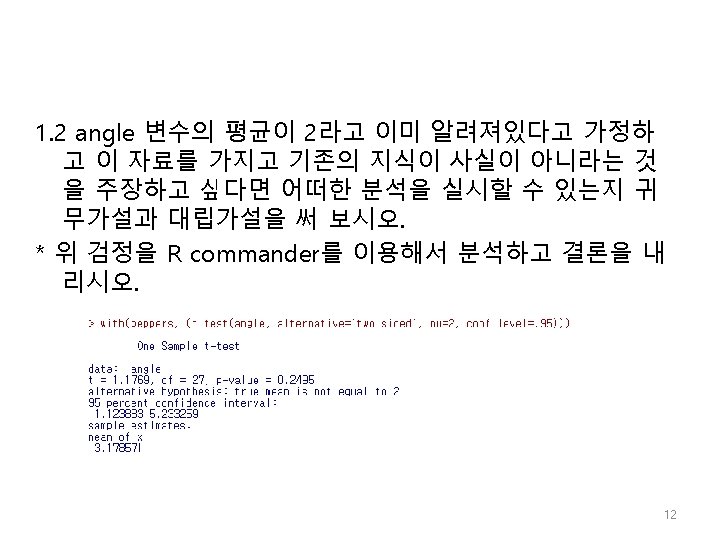
single-sample t-test (Pepers. xls) • Statistics > Means > Single-sample t-test (Enter the proposed mean (Null hypothesis: mu=))
 • Statistics > Summaries > Shapiro-Wilk test of normality •")
single-sample t-test (Pepers. xls) • Statistics > Summaries > Shapiro-Wilk test of normality • This is a hypothesis tests with the null hypothesis that the data comes from a normal distribution.
 • Import the data")
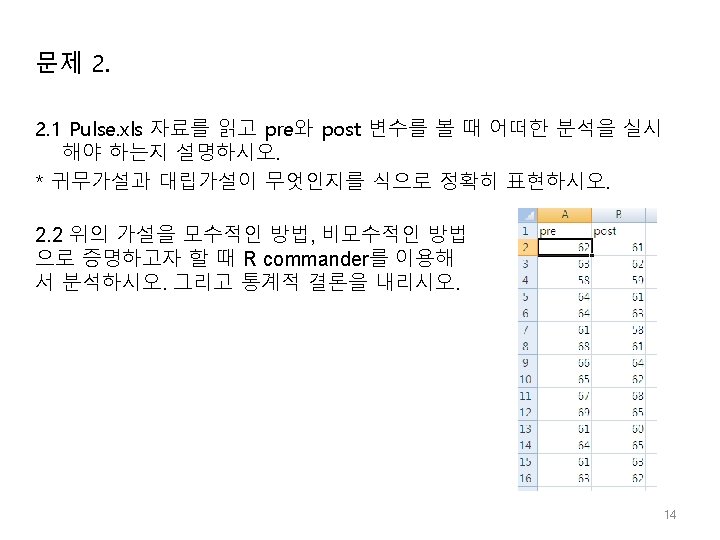
- Pulse data paired t-test(parametric) • Import the data
 • Statistics > Means > Paired t-test")
- Pulse data paired t-test(parametric) • Statistics > Means > Paired t-test
")
- Pulse data paired t-test(parametric)
 • Statistics > nonparametric tests > Pairedsamples Wilcoxon test")
- Pulse data paired t-test(non-parametric) • Statistics > nonparametric tests > Pairedsamples Wilcoxon test
")
- Pulse data paired t-test(non-parametric)
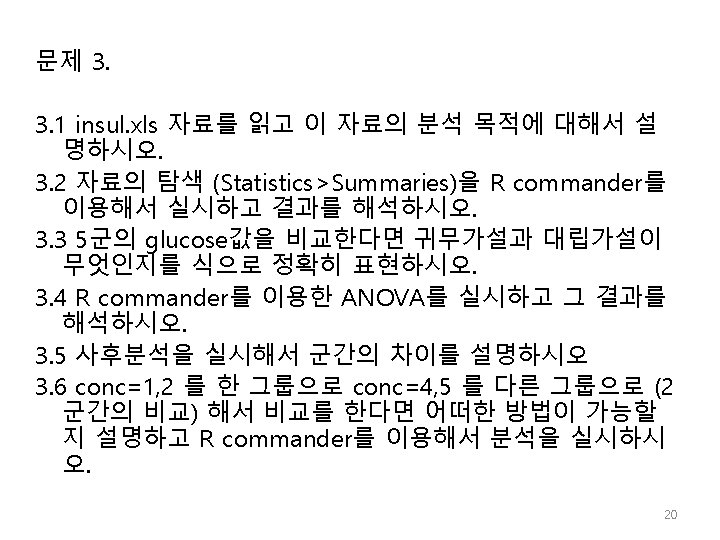

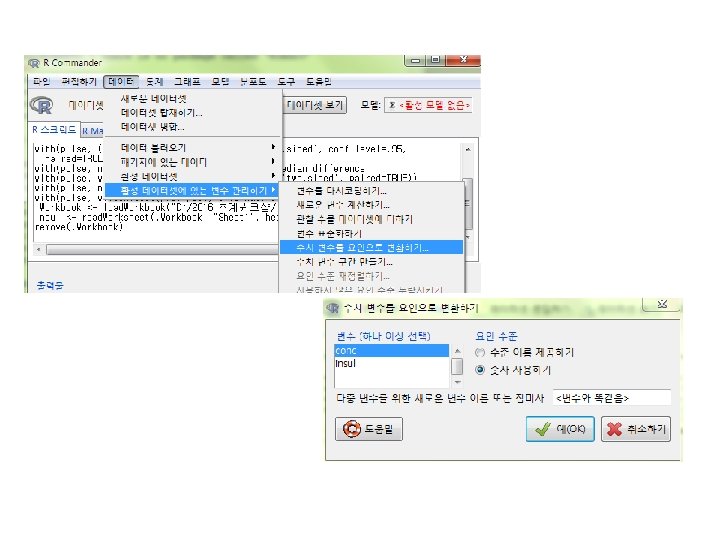
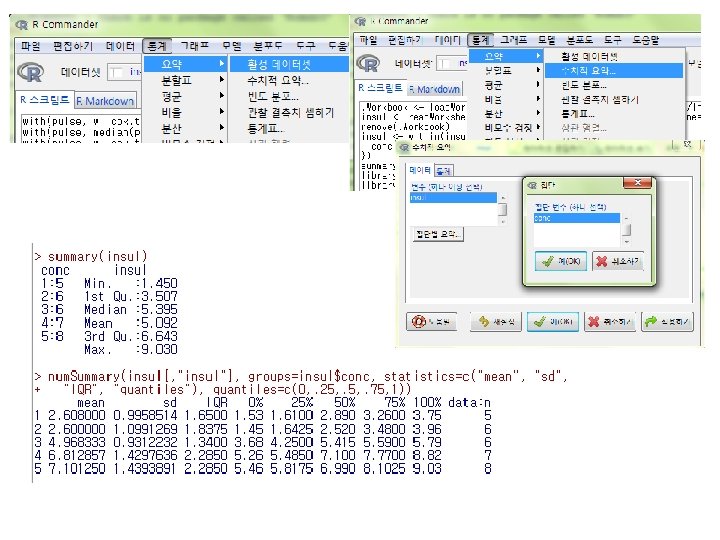
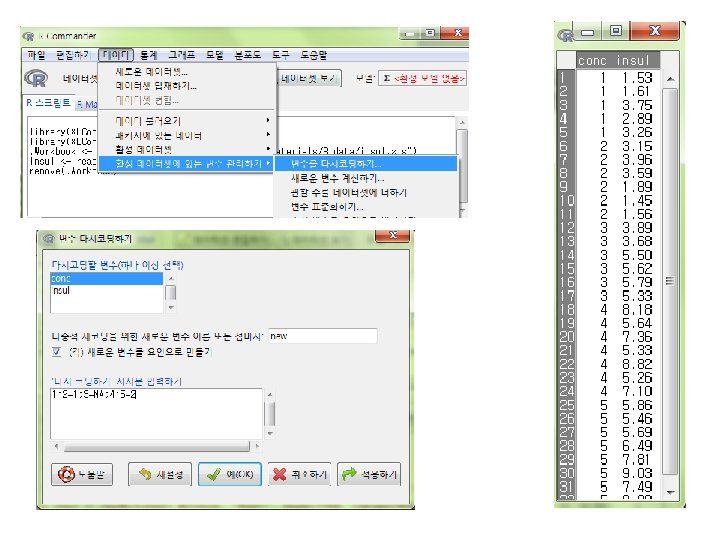
- insul data ANOVA • Effect of glucose concentration on Insulin – Measured the amount of insulin secretion after administration of five different concentrations of glucose into pancreatic tissue (animal experiments) • Characteristics for each group – Statistics > Summaries (according to the study objective) – Graphs (according to the study objective) • variable “conc” must be declared as a factor variable! 21

- insul data ANOVA • Graphs->Boxplot Conc 1, 2 < 3 < conc 4, 5

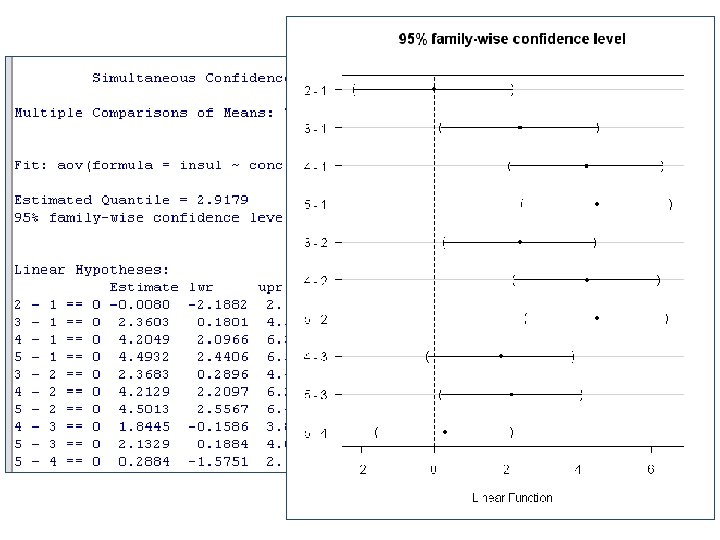
- insul data ANOVA • One-Way ANOVA – Statistics > Means > One-way ANOVA – Pairwise comparisons of means – Tukey post-hoc comparison procedure (default)
 vs (4, 5) comparison")
- insul data Multiple comparison • t-test for (1, 2) vs (4, 5) comparison – Re-define variables • Data > Manage variable in active data set > Recode variables > select conc variable • New variable name or prefix for multiple recodes : new • Enter recode directives • 1: 2=1; 3=NA; 4: 5=2 • conc=3 as a missing – Equality of variance test should be carried out before the t-test • Statistics > Variances > Two variances F-test • the variances are equal – Statistics > Means > Independent samples t-test • Mean concentration difference between two new groups (variances are assumed to be equal) • Significant 27

- insul data Variance ratio test of the two groups • Statistics > Variances > Two variances F-test
")
- insul data Independent samples t-test (equal variances)
 • Nonparametric way of comparing (1, 2) vs (4,")
- insul data Multiple comparison(non-parametric) • Nonparametric way of comparing (1, 2) vs (4, 5) – Statistics > Nonparametric tests > Two sample Wilcoxon test 31
 difference by Vehtype(dichotomous) variable=> Analysis")
- taillite 2 data Characteristic of data • resptime(continounous) difference by Vehtype(dichotomous) variable=> Analysis of variance? • Looking at only Group=1 variables features vehtype Vehicle type group Light On=1 position Light Position speedzn Speed Zone resptime Response Time follotme Following Time in Video Frames folltmec Following Time in Categories Light Off=2 32

- taillite 2 data ANOVA • Trying ANOVA – Statistics > Means > One-way ANOVA – Response variable : resptime, Groups : vehtype – Grouping variables should be converted as factor variables (Data > Manage variable in active data set > Convert numeric variables to factors) • A significant difference between Vehtypes on resptime? 34

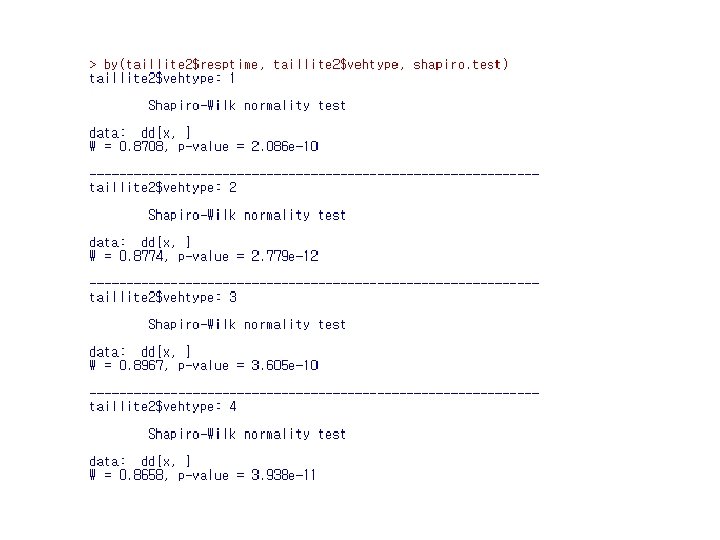
- taillite 2 data Normality test • Normality test – Statistics > Summaries > Shapiro-Wilk test of normality – For normality test for Vehtype, • by(taillite 2$resptime, taillite 2$vehtype, shapiro. test) – Reject the null!! • ANOVA can not be conducted. 35
 – Statistics")
- taillite 2 data Kruskal-Wallis test • Trying nonparametric way (Kruskal-Wallis test) – Statistics > Nonparametric tests > Kruskal-Wallis test – p=0. 259 • No difference between groups! 37

- taillite 2 data Make new variable • Data > Manage variable in active data set > Compute new variable – New variable name : lresp – Expression to compute : log(resptime) 38

- taillite 2 data Normality test for lresp – Edit command line as • by(taillite 2$lresp, taillite 2$vehtype, shapiro. test)

- taillite 2 data ANOVA • Trying ANOVA with lresp – p=0. 063 • What do you conclude? 40

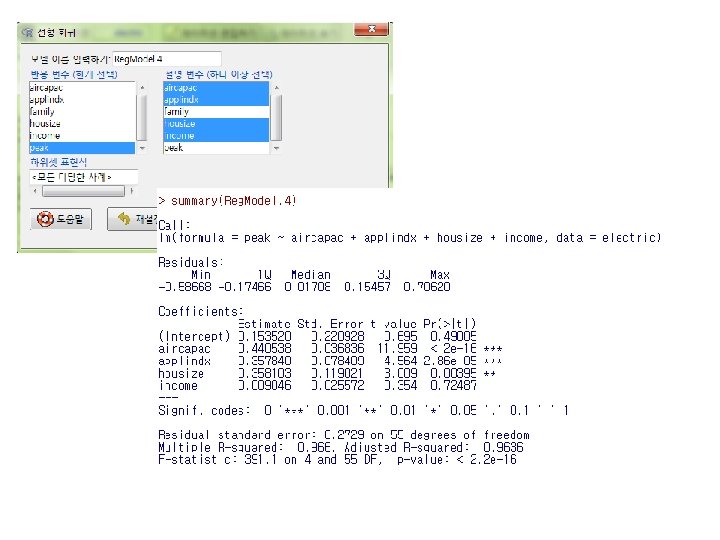
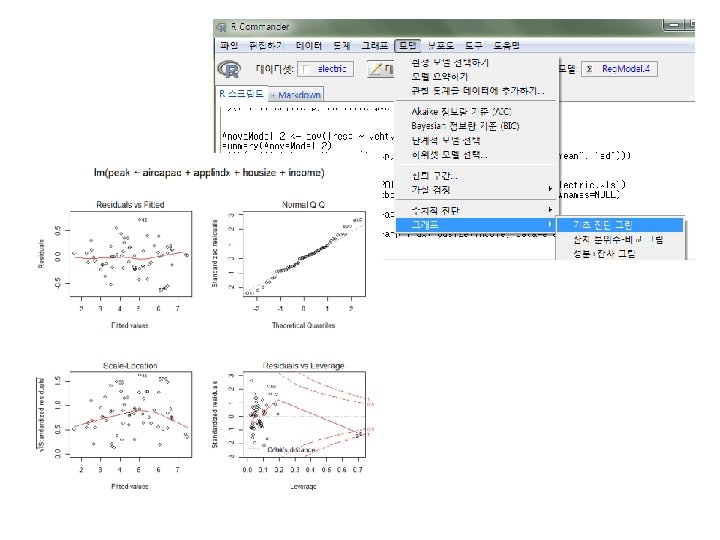
- elctric data Characteristic of data • Aim: Selecting variables that affect the variable “peak” (Maximum amount of electricity) and finding the regression equation • Statistics > Fit models > Linear regression – Create command line first if you want to use the stepwise method for model selection (use step(model) function) variables features housize House Size income Family Income aircapac Air Conditioning Capacity applindx Appliance Index family Number of Family Members peak Peak Hour Electric Load 41

3 D graphics

Rcmdr • R commander was developed as an easy to use graphical user interface (GUI) for R • Rcmdr is not perfect yet, but has been updated • Expecting menu screen in Korean and Korean fonts variability
- Slides: 46