TAU Parallel Performance System DOD UGC 2004 Tutorial
- Slides: 114

TAU Parallel Performance System DOD UGC 2004 Tutorial Part 3: TAU Applications and Developments

Tutorial Outline – Part 3 TAU Applications and Developments r Selected Applications ¦ ¦ r Current developments ¦ ¦ ¦ r PETSc, EVH 1, SAMRAI, Stommel mpi. Java, Blitz++, SMARTS C-SAFE/Uintah HYCOM, AVUS Perf. DMF Online performance analysis Para. Vis Integrated performance evaluation environment TAU Parallel Performance System 2 DOD HPCMP UGC 2004

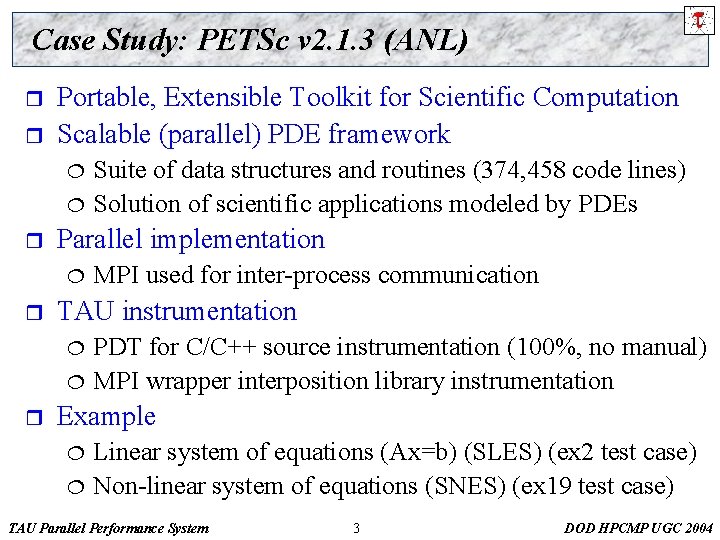
Case Study: PETSc v 2. 1. 3 (ANL) r r Portable, Extensible Toolkit for Scientific Computation Scalable (parallel) PDE framework ¦ ¦ r Parallel implementation ¦ r MPI used for inter-process communication TAU instrumentation ¦ ¦ r Suite of data structures and routines (374, 458 code lines) Solution of scientific applications modeled by PDEs PDT for C/C++ source instrumentation (100%, no manual) MPI wrapper interposition library instrumentation Example ¦ ¦ Linear system of equations (Ax=b) (SLES) (ex 2 test case) Non-linear system of equations (SNES) (ex 19 test case) TAU Parallel Performance System 3 DOD HPCMP UGC 2004

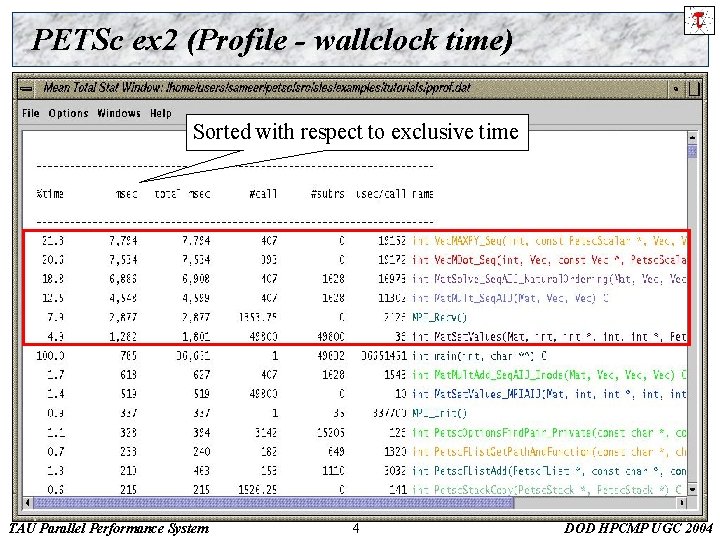
PETSc ex 2 (Profile - wallclock time) Sorted with respect to exclusive time TAU Parallel Performance System 4 DOD HPCMP UGC 2004

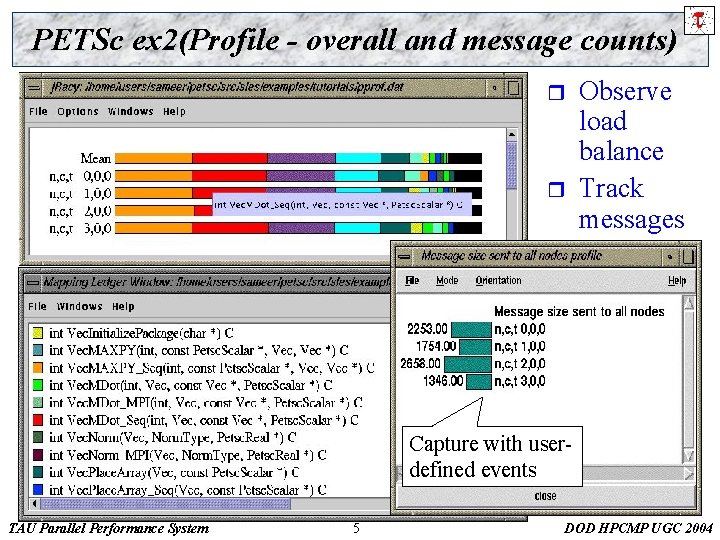
PETSc ex 2(Profile - overall and message counts) r r Observe load balance Track messages Capture with userdefined events TAU Parallel Performance System 5 DOD HPCMP UGC 2004

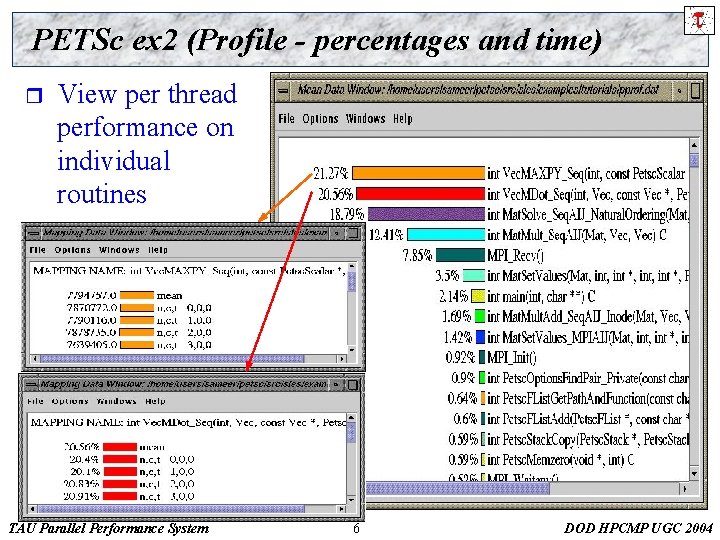
PETSc ex 2 (Profile - percentages and time) r View per thread performance on individual routines TAU Parallel Performance System 6 DOD HPCMP UGC 2004

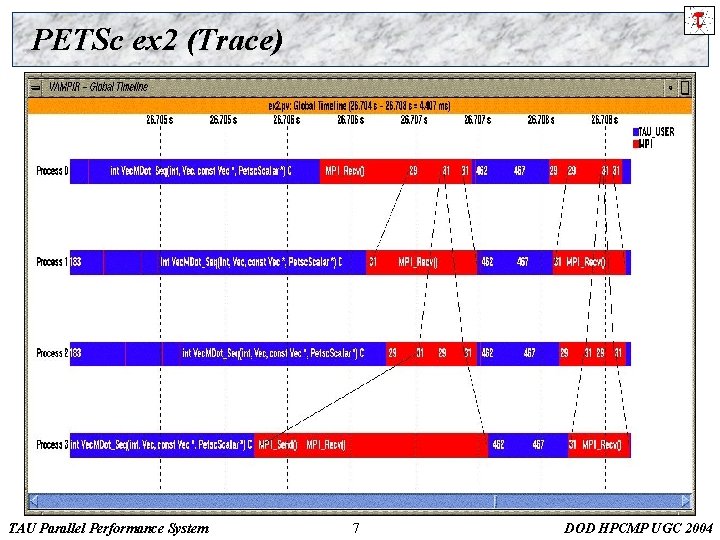
PETSc ex 2 (Trace) TAU Parallel Performance System 7 DOD HPCMP UGC 2004

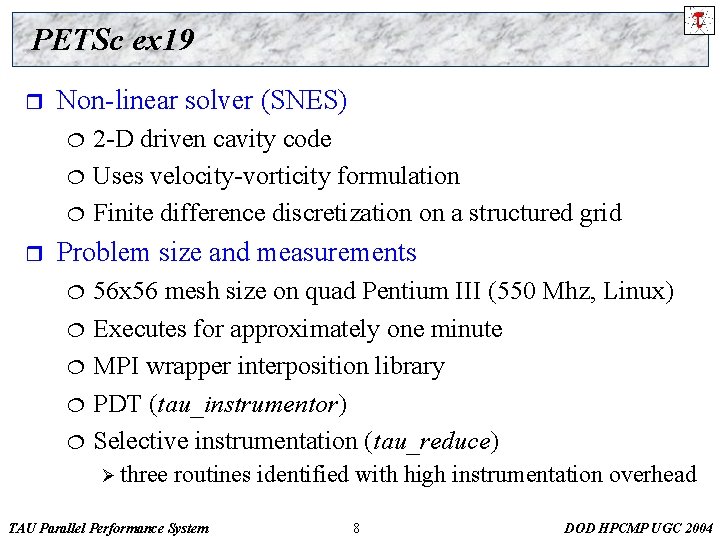
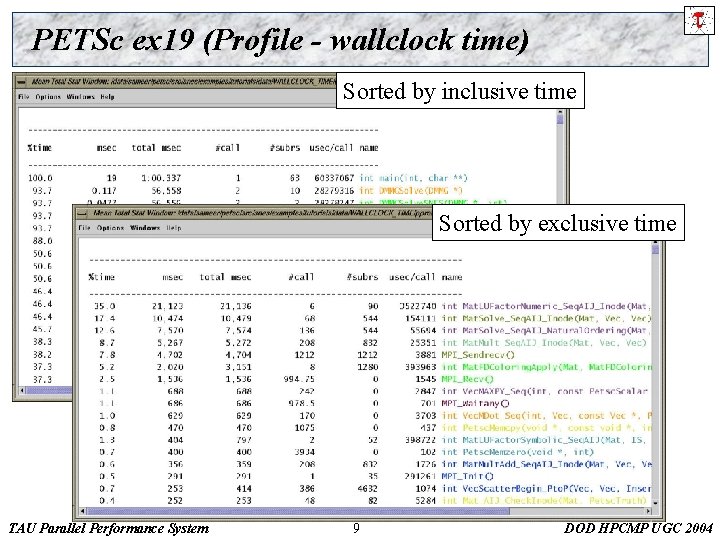
PETSc ex 19 r Non-linear solver (SNES) ¦ ¦ ¦ r 2 -D driven cavity code Uses velocity-vorticity formulation Finite difference discretization on a structured grid Problem size and measurements ¦ ¦ ¦ 56 x 56 mesh size on quad Pentium III (550 Mhz, Linux) Executes for approximately one minute MPI wrapper interposition library PDT (tau_instrumentor) Selective instrumentation (tau_reduce) Ø three routines identified with high instrumentation overhead TAU Parallel Performance System 8 DOD HPCMP UGC 2004

PETSc ex 19 (Profile - wallclock time) Sorted by inclusive time Sorted by exclusive time TAU Parallel Performance System 9 DOD HPCMP UGC 2004

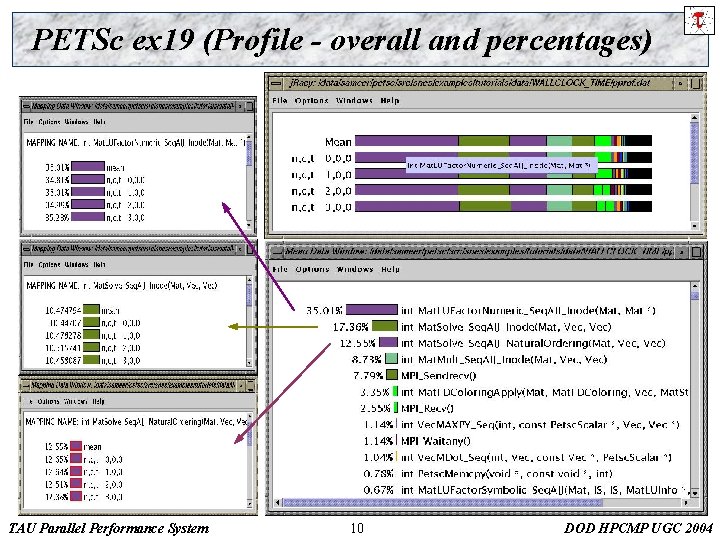
PETSc ex 19 (Profile - overall and percentages) TAU Parallel Performance System 10 DOD HPCMP UGC 2004

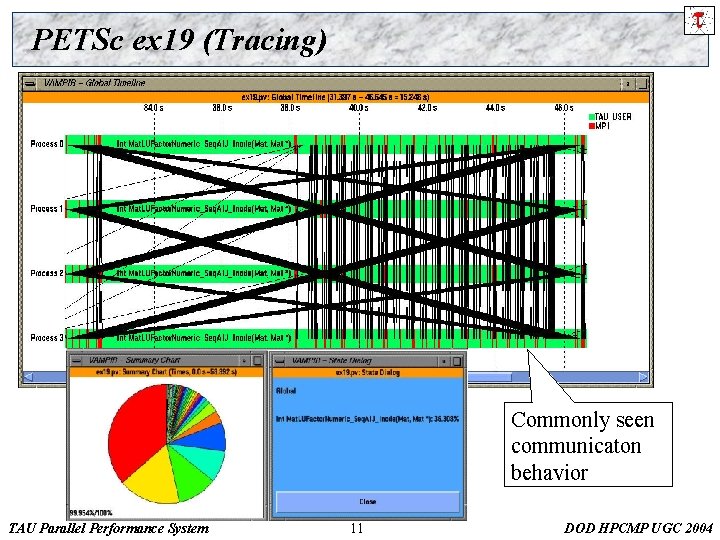
PETSc ex 19 (Tracing) Commonly seen communicaton behavior TAU Parallel Performance System 11 DOD HPCMP UGC 2004

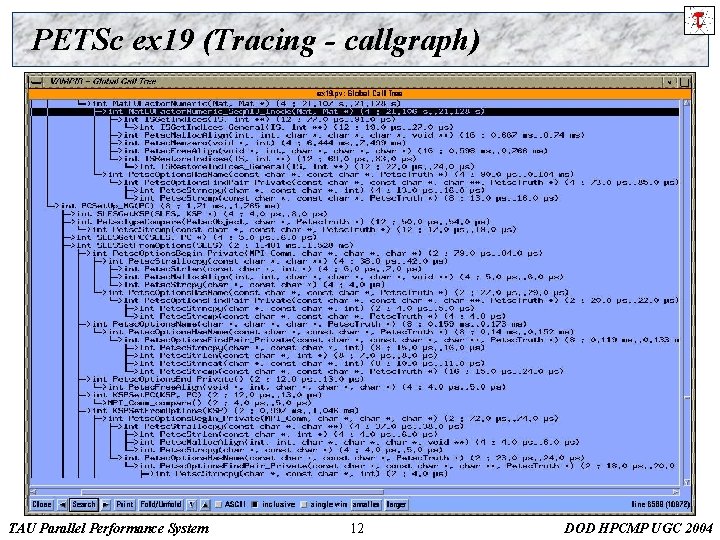
PETSc ex 19 (Tracing - callgraph) TAU Parallel Performance System 12 DOD HPCMP UGC 2004

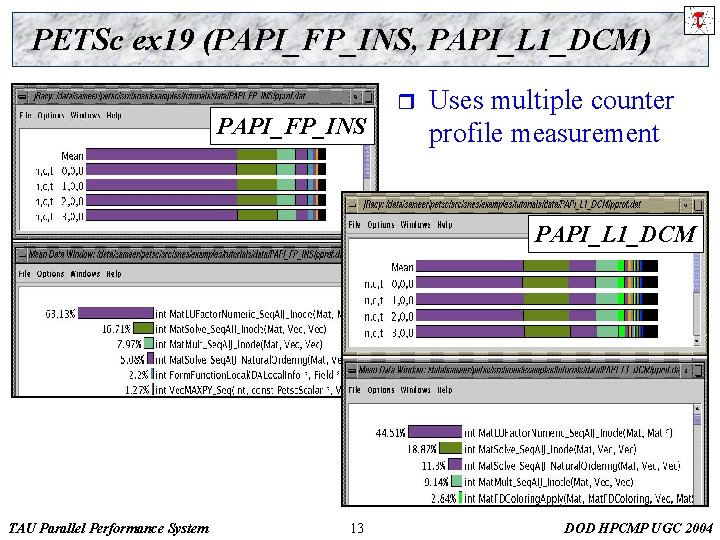
PETSc ex 19 (PAPI_FP_INS, PAPI_L 1_DCM) PAPI_FP_INS r Uses multiple counter profile measurement PAPI_L 1_DCM TAU Parallel Performance System 13 DOD HPCMP UGC 2004

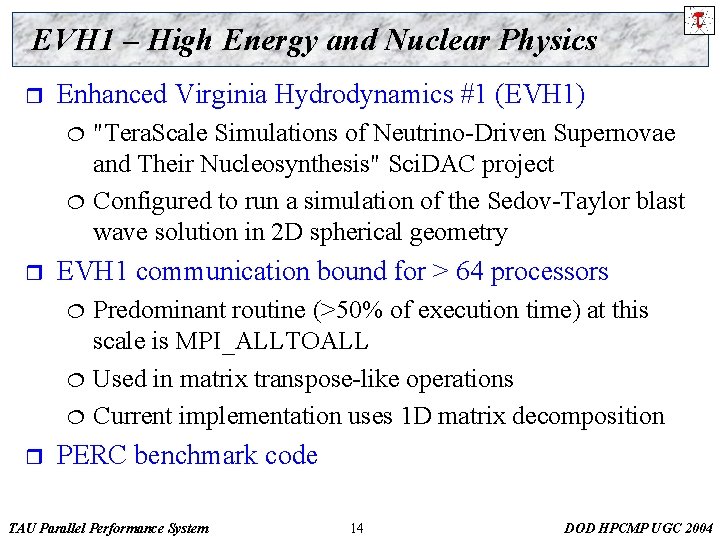
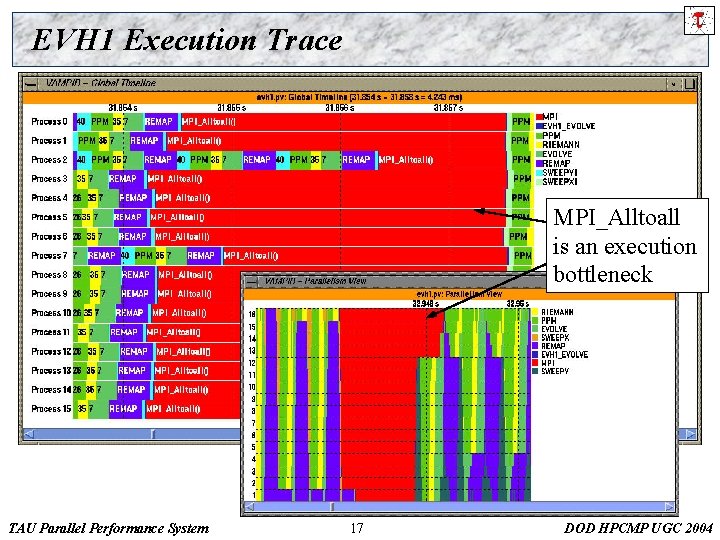
EVH 1 – High Energy and Nuclear Physics r Enhanced Virginia Hydrodynamics #1 (EVH 1) ¦ ¦ r EVH 1 communication bound for > 64 processors ¦ ¦ ¦ r "Tera. Scale Simulations of Neutrino-Driven Supernovae and Their Nucleosynthesis" Sci. DAC project Configured to run a simulation of the Sedov-Taylor blast wave solution in 2 D spherical geometry Predominant routine (>50% of execution time) at this scale is MPI_ALLTOALL Used in matrix transpose-like operations Current implementation uses 1 D matrix decomposition PERC benchmark code TAU Parallel Performance System 14 DOD HPCMP UGC 2004

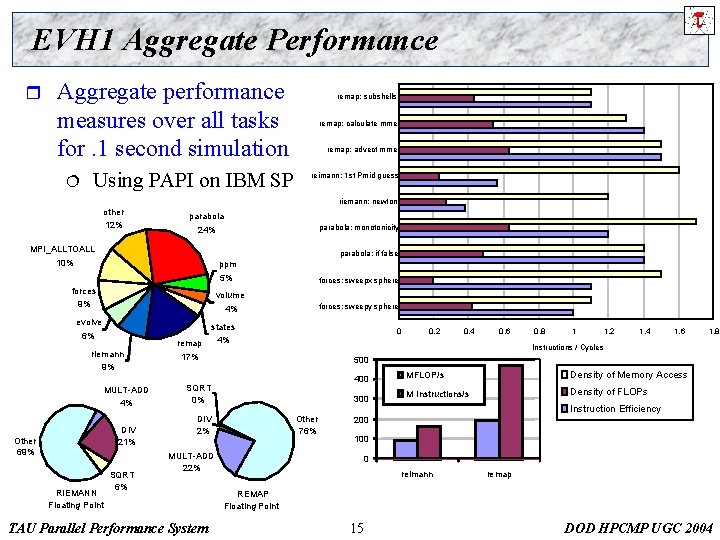
EVH 1 Aggregate Performance r Aggregate performance measures over all tasks for. 1 second simulation ¦ Using PAPI on IBM SP remap: subshells remap: calculate mme remap: advect mme reimann: 1 st Pmid guess riemann: newton other 12% parabola 24% MPI_ALLTOALL 10% parabola: if false ppm 5% forces 9% riemann 9% MULT-ADD 4% DIV 21% RIEMANN Floating Point forces: sweepx sphere volume 4% evolve 6% Other 69% parabola: monotonicity SQRT 6% forces: sweepy sphere states 4% remap 17% 0 0. 6 0. 8 1 1. 2 1. 4 1. 6 1. 8 Instructions / Cycles Other 76% 400 MFLOP/s Density of Memory Access 300 M Instructions/s Density of FLOPs Instruction Efficiency 200 100 MULT-ADD 22% TAU Parallel Performance System 0. 4 500 SQRT 0% DIV 2% 0. 2 0 reimann remap REMAP Floating Point 15 DOD HPCMP UGC 2004

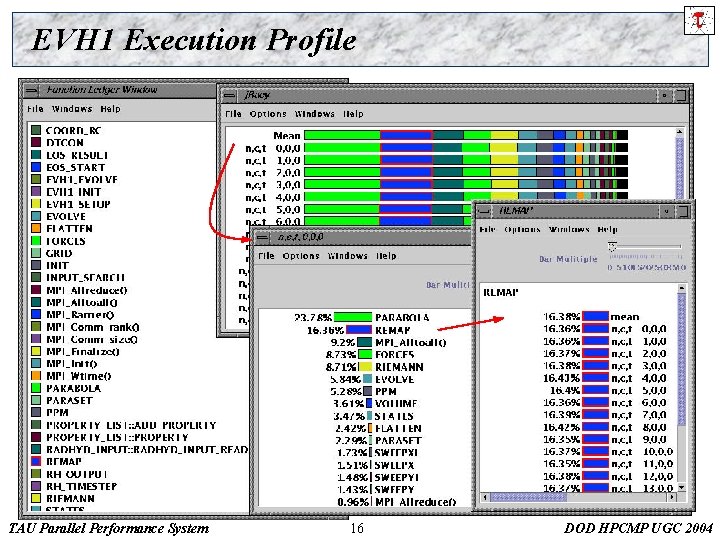
EVH 1 Execution Profile TAU Parallel Performance System 16 DOD HPCMP UGC 2004

EVH 1 Execution Trace MPI_Alltoall is an execution bottleneck TAU Parallel Performance System 17 DOD HPCMP UGC 2004

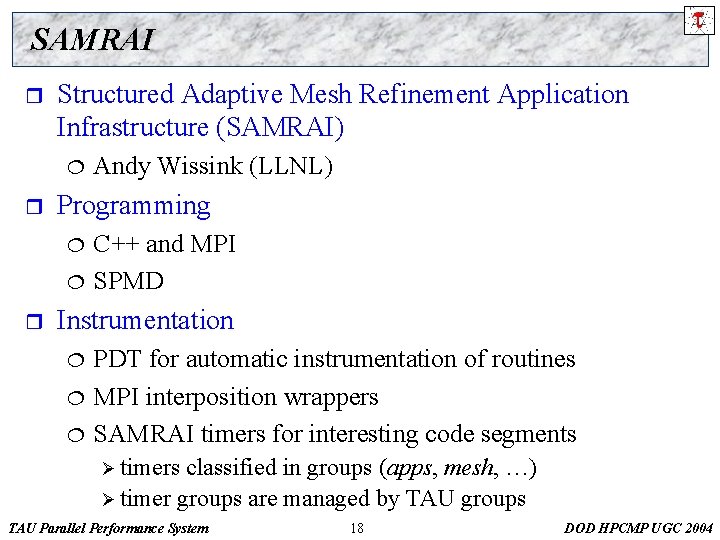
SAMRAI r Structured Adaptive Mesh Refinement Application Infrastructure (SAMRAI) ¦ r Programming ¦ ¦ r Andy Wissink (LLNL) C++ and MPI SPMD Instrumentation ¦ ¦ ¦ PDT for automatic instrumentation of routines MPI interposition wrappers SAMRAI timers for interesting code segments Ø timers classified in groups (apps, mesh, …) Ø timer groups are managed by TAU groups TAU Parallel Performance System 18 DOD HPCMP UGC 2004

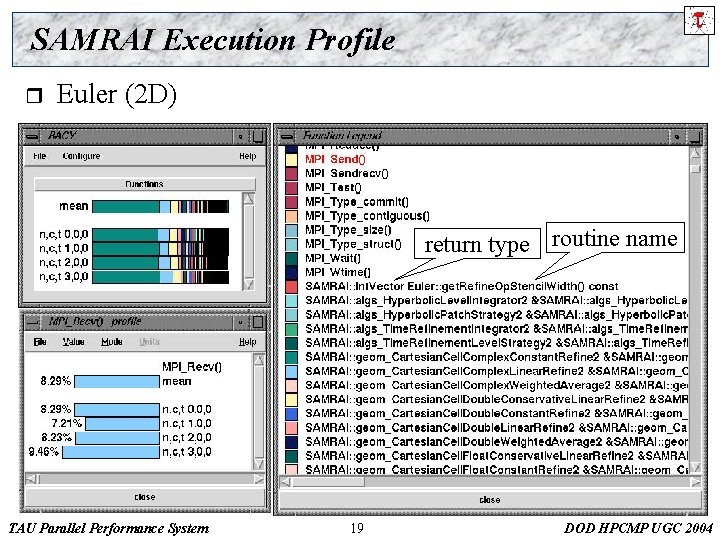
SAMRAI Execution Profile r Euler (2 D) return type routine name TAU Parallel Performance System 19 DOD HPCMP UGC 2004

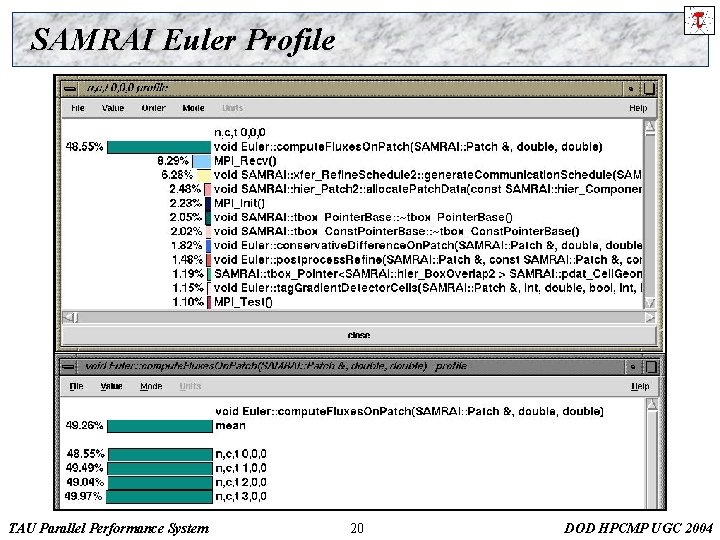
SAMRAI Euler Profile TAU Parallel Performance System 20 DOD HPCMP UGC 2004

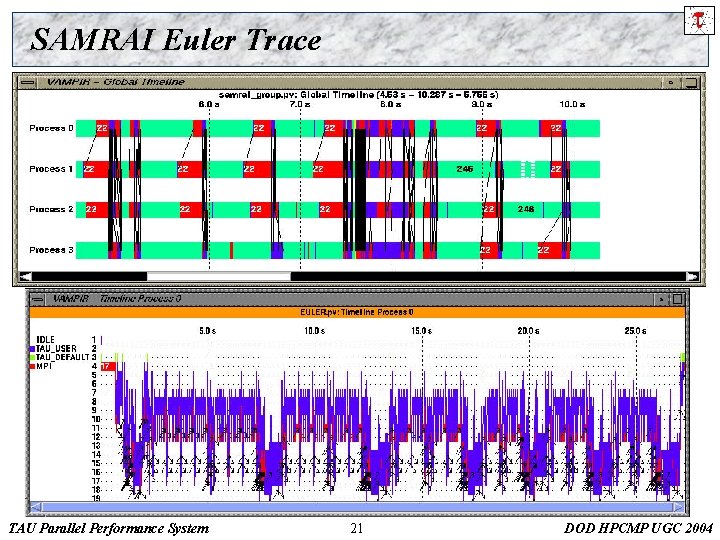
SAMRAI Euler Trace TAU Parallel Performance System 21 DOD HPCMP UGC 2004

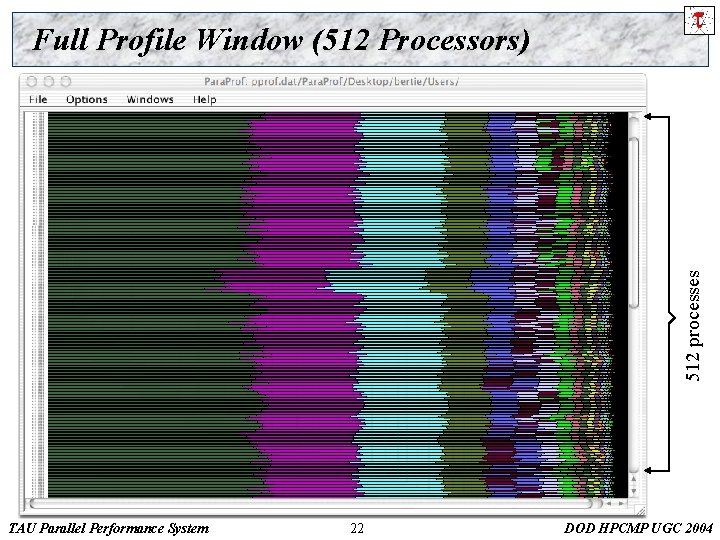
512 processes Full Profile Window (512 Processors) TAU Parallel Performance System 22 DOD HPCMP UGC 2004

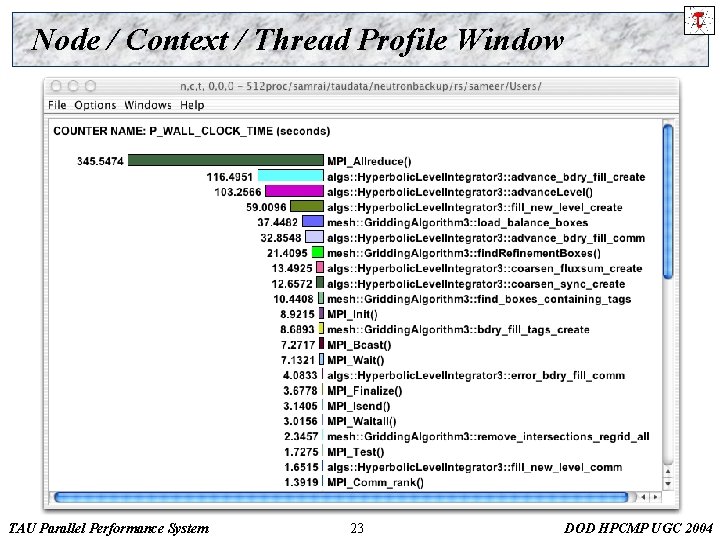
Node / Context / Thread Profile Window TAU Parallel Performance System 23 DOD HPCMP UGC 2004

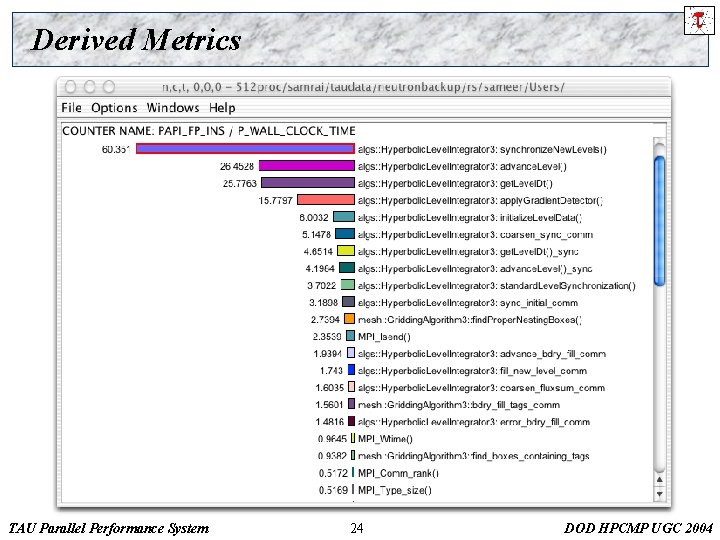
Derived Metrics TAU Parallel Performance System 24 DOD HPCMP UGC 2004

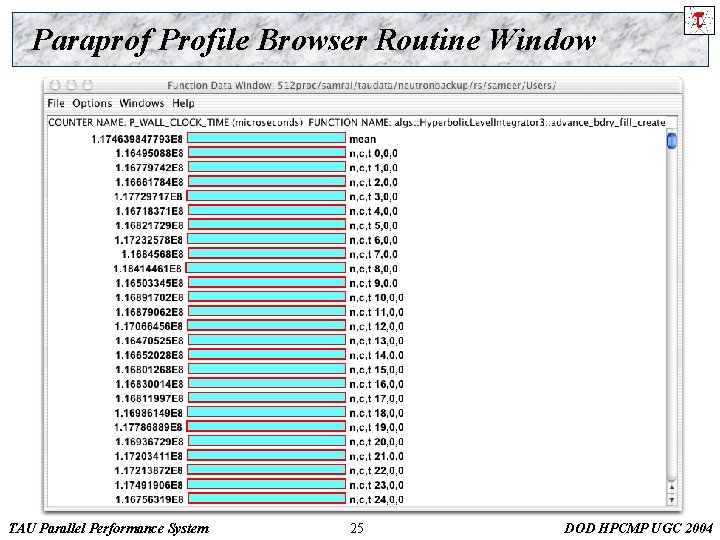
Paraprof Profile Browser Routine Window TAU Parallel Performance System 25 DOD HPCMP UGC 2004

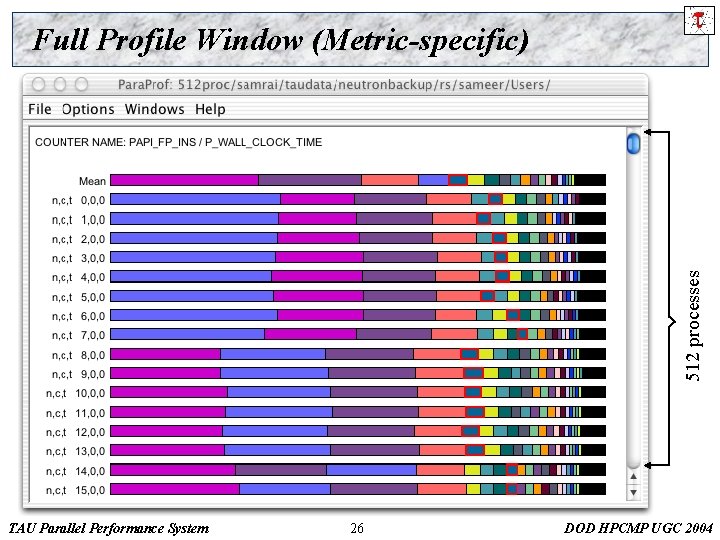
512 processes Full Profile Window (Metric-specific) TAU Parallel Performance System 26 DOD HPCMP UGC 2004

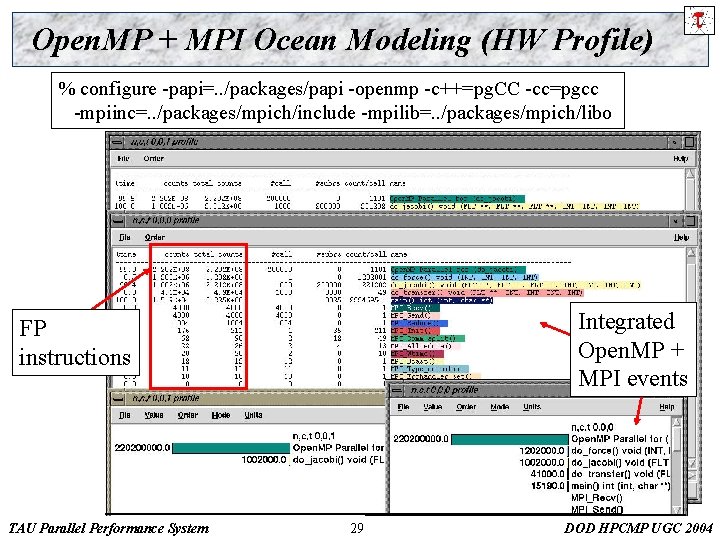
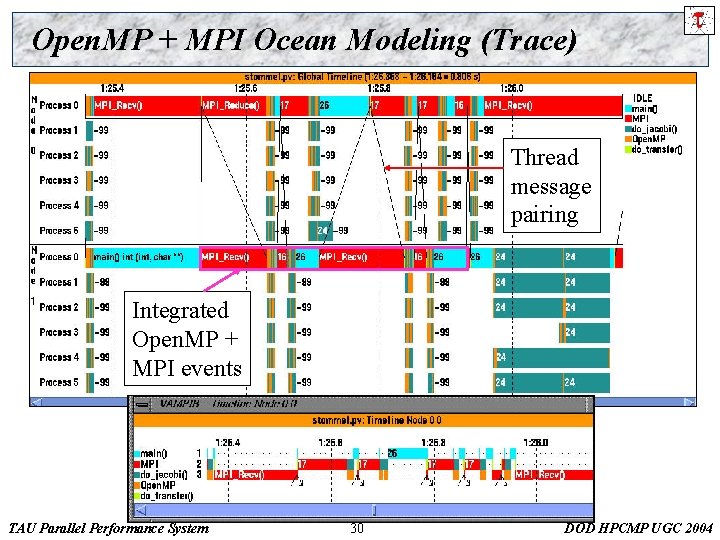
Mixed-mode Parallel Programs (Open. MPI + MPI) r Portable mixed-mode parallel programming ¦ ¦ r Performance measurement ¦ ¦ r Multi-threaded shared memory programming Inter-node message passing Access to RTS and communication events Associate communication and application events 2 D Stommel model of ocean circulation ¦ ¦ Open. MP for shared memory parallel programming MPI for cross-box message-based parallelism Jacobi iteration, 5 -point stencil Timothy Kaiser (San Diego Supercomputing Center) TAU Parallel Performance System 27 DOD HPCMP UGC 2004

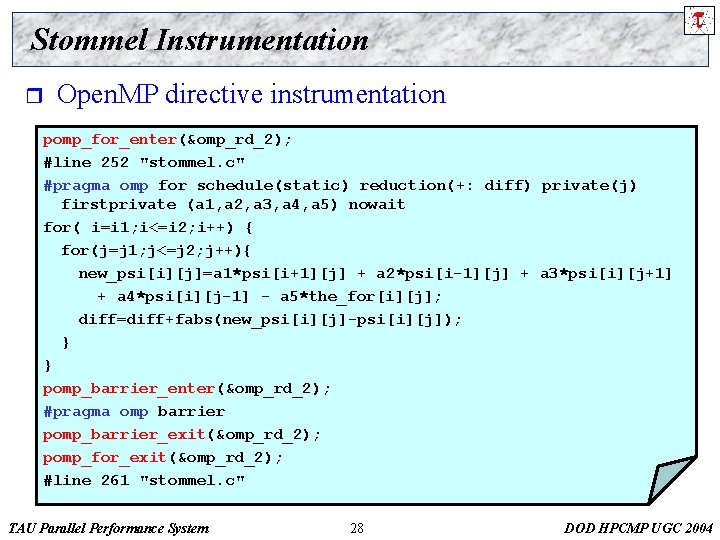
Stommel Instrumentation r Open. MP directive instrumentation pomp_for_enter(&omp_rd_2); #line 252 "stommel. c" #pragma omp for schedule(static) reduction(+: diff) private(j) firstprivate (a 1, a 2, a 3, a 4, a 5) nowait for( i=i 1; i<=i 2; i++) { for(j=j 1; j<=j 2; j++){ new_psi[i][j]=a 1*psi[i+1][j] + a 2*psi[i-1][j] + a 3*psi[i][j+1] + a 4*psi[i][j-1] - a 5*the_for[i][j]; diff=diff+fabs(new_psi[i][j]-psi[i][j]); } } pomp_barrier_enter(&omp_rd_2); #pragma omp barrier pomp_barrier_exit(&omp_rd_2); pomp_for_exit(&omp_rd_2); #line 261 "stommel. c" TAU Parallel Performance System 28 DOD HPCMP UGC 2004

Open. MP + MPI Ocean Modeling (HW Profile) % configure -papi=. . /packages/papi -openmp -c++=pg. CC -cc=pgcc -mpiinc=. . /packages/mpich/include -mpilib=. . /packages/mpich/libo Integrated Open. MP + MPI events FP instructions TAU Parallel Performance System 29 DOD HPCMP UGC 2004

Open. MP + MPI Ocean Modeling (Trace) Thread message pairing Integrated Open. MP + MPI events TAU Parallel Performance System 30 DOD HPCMP UGC 2004

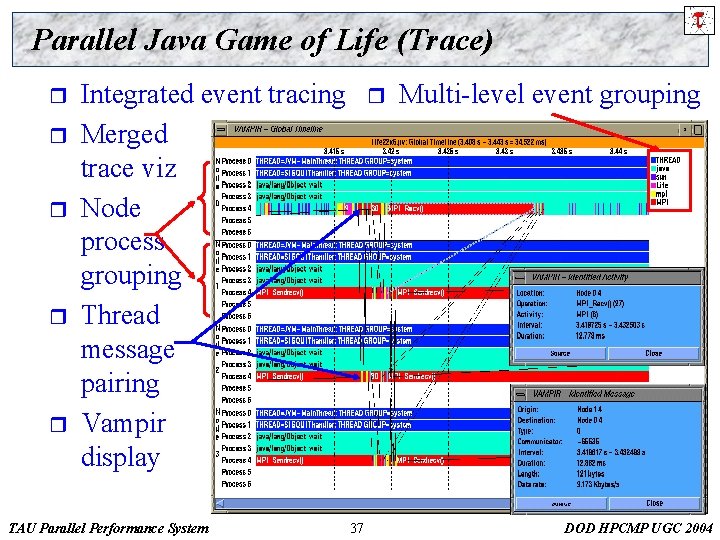
Mixed-mode Parallel Programs (Java + MPI) r r Explicit message communication libraries for Java MPI performance measurement ¦ ¦ ¦ r MPI profiling interface - link-time interposition library TAU wrappers in native profiling interface library Send/Receive events and communication statistics mpi. Java (Syracuse, Java. Grande, 1999) ¦ ¦ ¦ Java wrapper package JNI C bindings to MPI communication library Dynamic shared object (libmpijava. so) loaded in JVM prunjava calls mpirun to distribute program to nodes Contrast to Java RMI-based schemes (MPJ, CCJ) TAU Parallel Performance System 31 DOD HPCMP UGC 2004

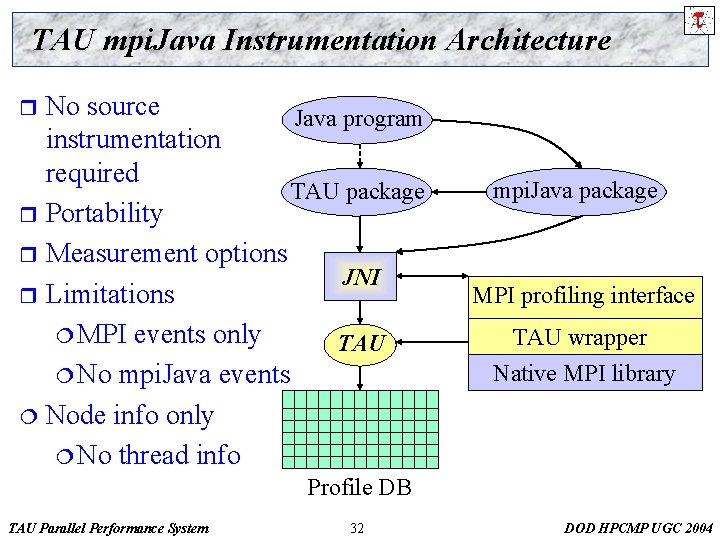
TAU mpi. Java Instrumentation Architecture No source Java program instrumentation required TAU package r Portability r Measurement options JNI r Limitations ¦ MPI events only TAU ¦ No mpi. Java events ¦ Node info only ¦ No thread info r mpi. Java package Native MPI interface library MPI profiling TAU wrapper Native MPI library Profile DB TAU Parallel Performance System 32 DOD HPCMP UGC 2004

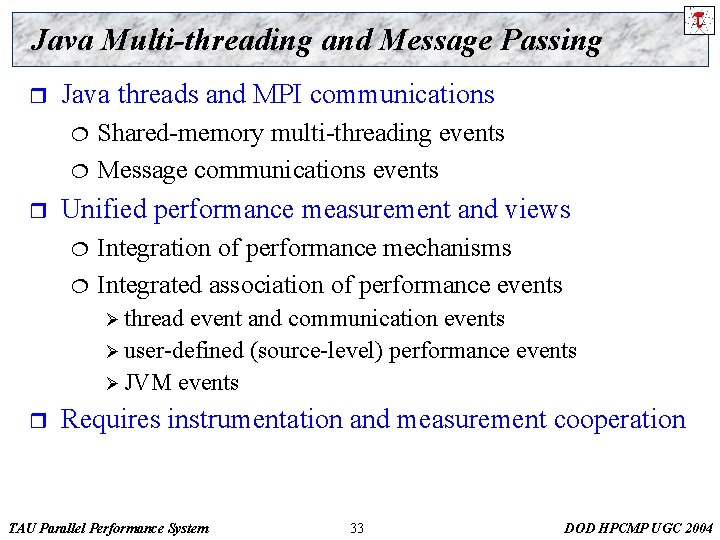
Java Multi-threading and Message Passing r Java threads and MPI communications ¦ ¦ r Shared-memory multi-threading events Message communications events Unified performance measurement and views ¦ ¦ Integration of performance mechanisms Integrated association of performance events Ø thread event and communication events Ø user-defined (source-level) performance events Ø JVM events r Requires instrumentation and measurement cooperation TAU Parallel Performance System 33 DOD HPCMP UGC 2004

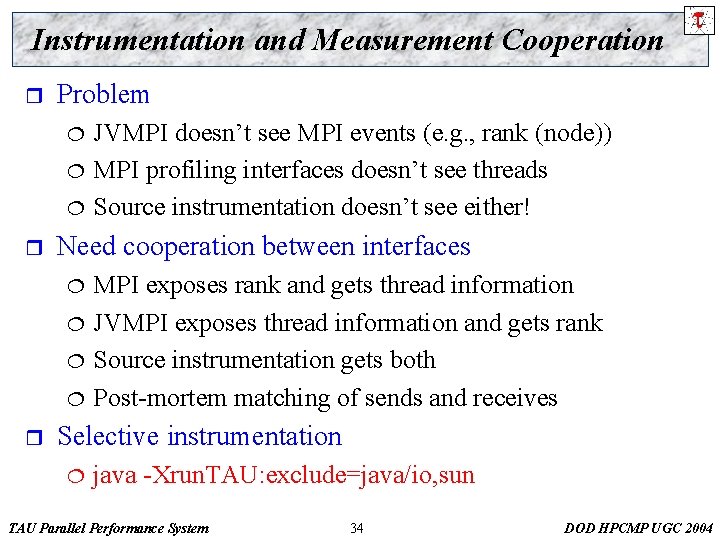
Instrumentation and Measurement Cooperation r Problem ¦ ¦ ¦ r Need cooperation between interfaces ¦ ¦ r JVMPI doesn’t see MPI events (e. g. , rank (node)) MPI profiling interfaces doesn’t see threads Source instrumentation doesn’t see either! MPI exposes rank and gets thread information JVMPI exposes thread information and gets rank Source instrumentation gets both Post-mortem matching of sends and receives Selective instrumentation ¦ java -Xrun. TAU: exclude=java/io, sun TAU Parallel Performance System 34 DOD HPCMP UGC 2004

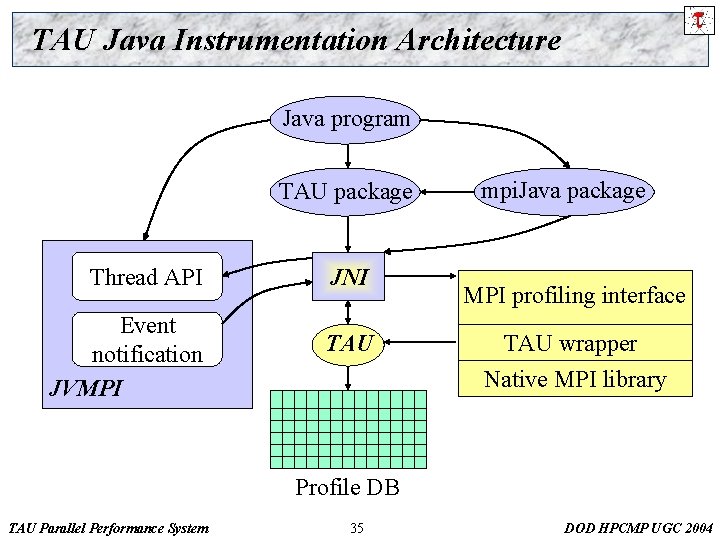
TAU Java Instrumentation Architecture Java program TAU package Thread API Event notification JVMPI JNI TAU mpi. Java package MPI profiling interface TAU wrapper Native MPI library Profile DB TAU Parallel Performance System 35 DOD HPCMP UGC 2004

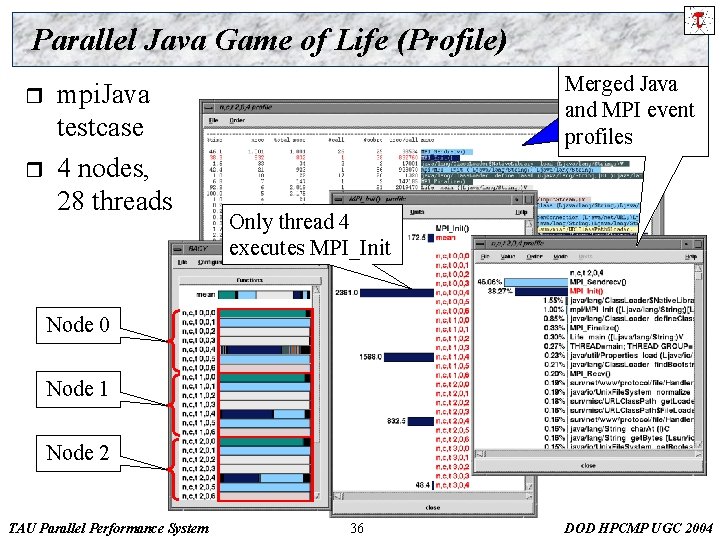
Parallel Java Game of Life (Profile) r r mpi. Java testcase 4 nodes, 28 threads Merged Java and MPI event profiles Only thread 4 executes MPI_Init Node 0 Node 1 Node 2 TAU Parallel Performance System 36 DOD HPCMP UGC 2004

Parallel Java Game of Life (Trace) r r r Integrated event tracing Merged trace viz Node process grouping Thread message pairing Vampir display TAU Parallel Performance System r 37 Multi-level event grouping DOD HPCMP UGC 2004

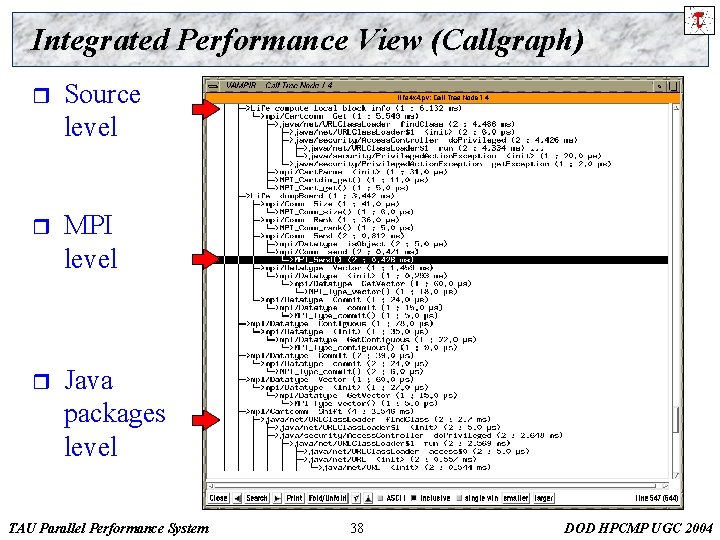
Integrated Performance View (Callgraph) r Source level r MPI level r Java packages level TAU Parallel Performance System 38 DOD HPCMP UGC 2004

Object-Oriented Programming and C++ r r r Object-oriented programming is based on concepts of abstract data types, encapsulation, inheritance, … Languages (such as C++) provide support implementing domain-specific abstractions in the form of class libraries Furthermore, generic programming mechanisms allow for efficient coding abstractions and compile-time transformations Creates a semantic gap between the transformed code and what the user expects (and describes in source code) Need a mechanism to expose the nature of high-level abstract computation to the performance tools Map low-level performance data to high-level semantics TAU Parallel Performance System 39 DOD HPCMP UGC 2004

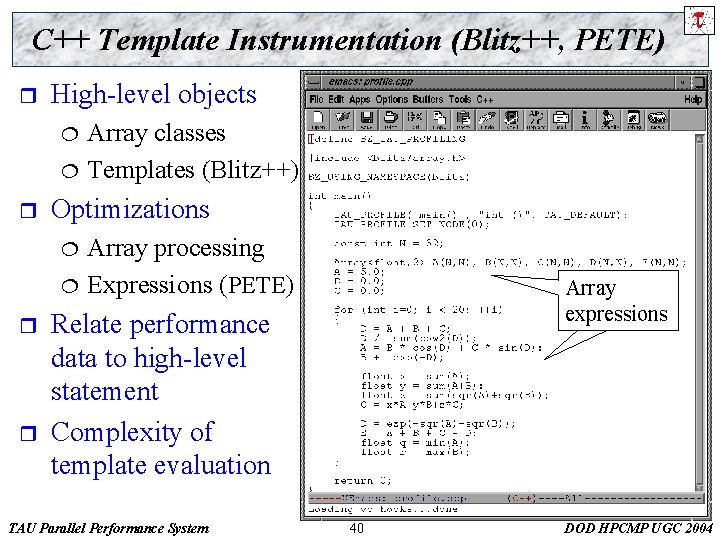
C++ Template Instrumentation (Blitz++, PETE) r High-level objects ¦ ¦ r Optimizations ¦ ¦ r r Array classes Templates (Blitz++) Array processing Expressions (PETE) Array expressions Relate performance data to high-level statement Complexity of template evaluation TAU Parallel Performance System 40 DOD HPCMP UGC 2004

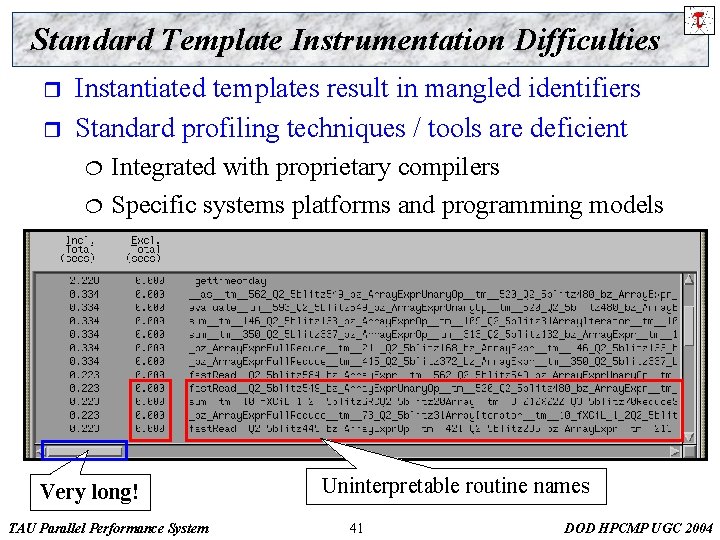
Standard Template Instrumentation Difficulties r r Instantiated templates result in mangled identifiers Standard profiling techniques / tools are deficient ¦ ¦ Integrated with proprietary compilers Specific systems platforms and programming models Very long! TAU Parallel Performance System Uninterpretable routine names 41 DOD HPCMP UGC 2004

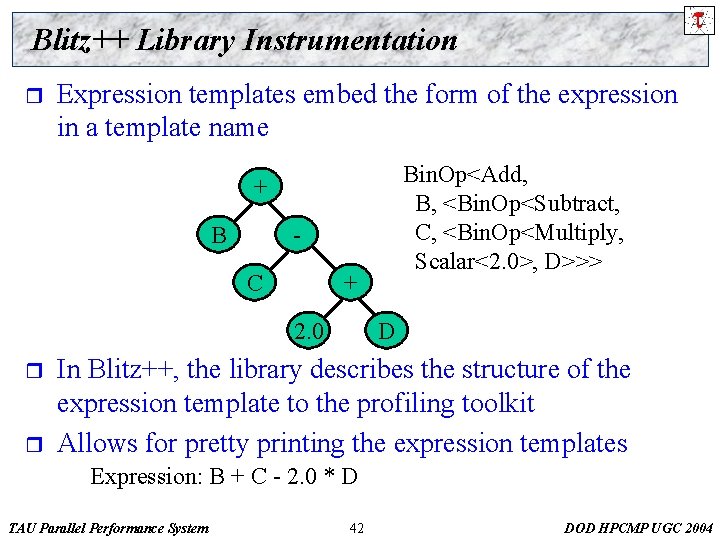
Blitz++ Library Instrumentation r Expression templates embed the form of the expression in a template name Bin. Op<Add, B, <Bin. Op<Subtract, C, <Bin. Op<Multiply, Scalar<2. 0>, D>>> + B C + 2. 0 r r D In Blitz++, the library describes the structure of the expression template to the profiling toolkit Allows for pretty printing the expression templates Expression: B + C - 2. 0 * D TAU Parallel Performance System 42 DOD HPCMP UGC 2004

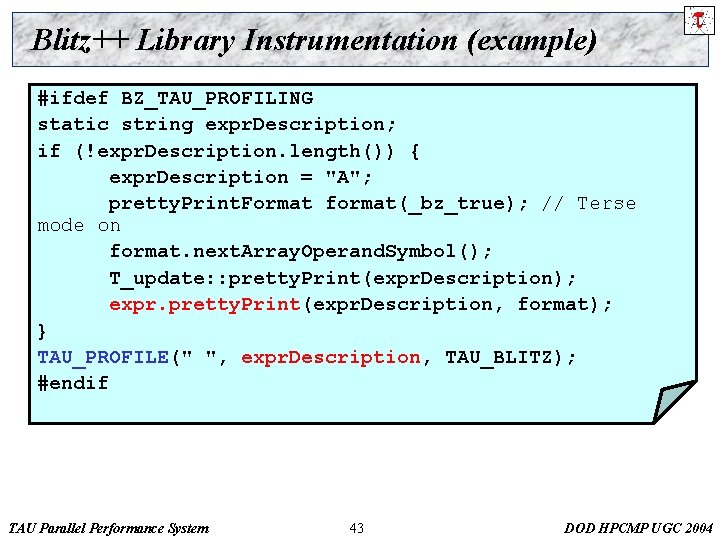
Blitz++ Library Instrumentation (example) #ifdef BZ_TAU_PROFILING static string expr. Description; if (!expr. Description. length()) { expr. Description = "A"; pretty. Print. Format format(_bz_true); // Terse mode on format. next. Array. Operand. Symbol(); T_update: : pretty. Print(expr. Description); expr. pretty. Print(expr. Description, format); } TAU_PROFILE(" ", expr. Description, TAU_BLITZ); #endif TAU Parallel Performance System 43 DOD HPCMP UGC 2004

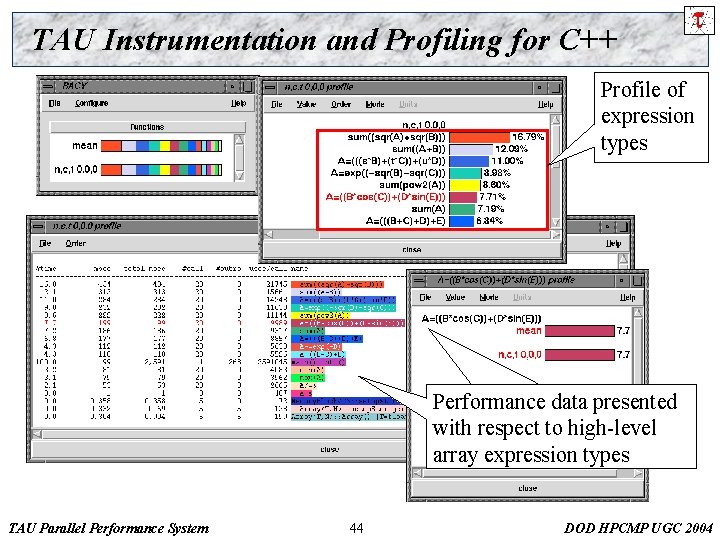
TAU Instrumentation and Profiling for C++ Profile of expression types Performance data presented with respect to high-level array expression types TAU Parallel Performance System 44 DOD HPCMP UGC 2004

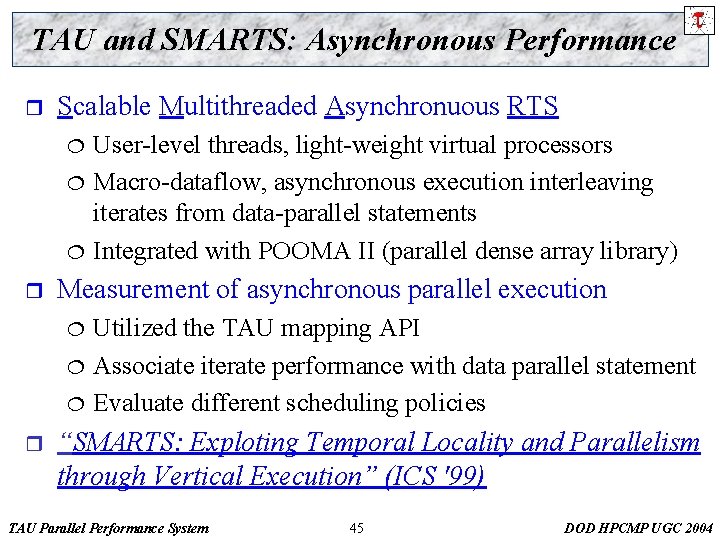
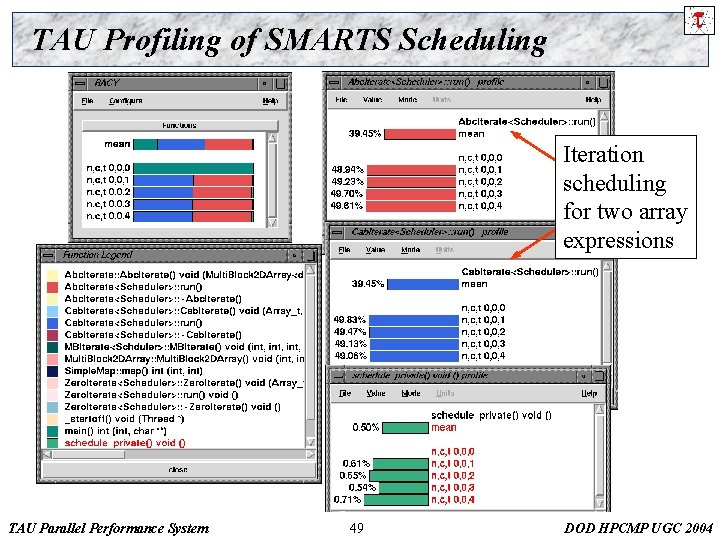
TAU and SMARTS: Asynchronous Performance r Scalable Multithreaded Asynchronuous RTS ¦ ¦ ¦ r Measurement of asynchronous parallel execution ¦ ¦ ¦ r User-level threads, light-weight virtual processors Macro-dataflow, asynchronous execution interleaving iterates from data-parallel statements Integrated with POOMA II (parallel dense array library) Utilized the TAU mapping API Associate iterate performance with data parallel statement Evaluate different scheduling policies “SMARTS: Exploting Temporal Locality and Parallelism through Vertical Execution” (ICS '99) TAU Parallel Performance System 45 DOD HPCMP UGC 2004

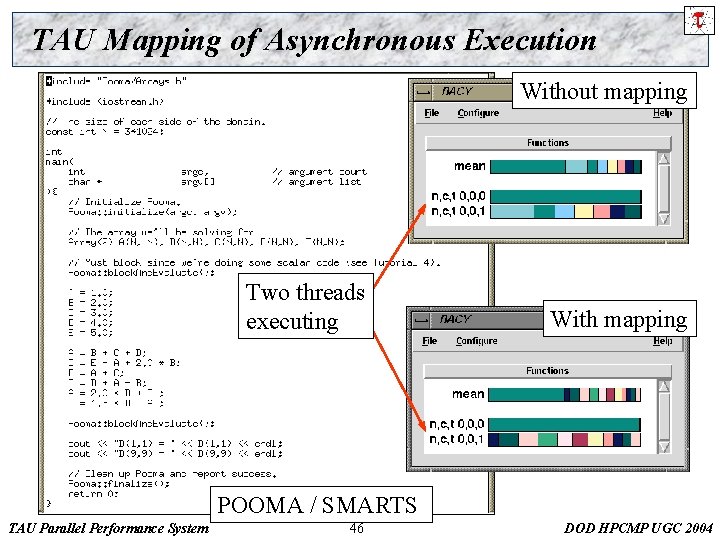
TAU Mapping of Asynchronous Execution Without mapping Two threads executing With mapping POOMA / SMARTS TAU Parallel Performance System 46 DOD HPCMP UGC 2004

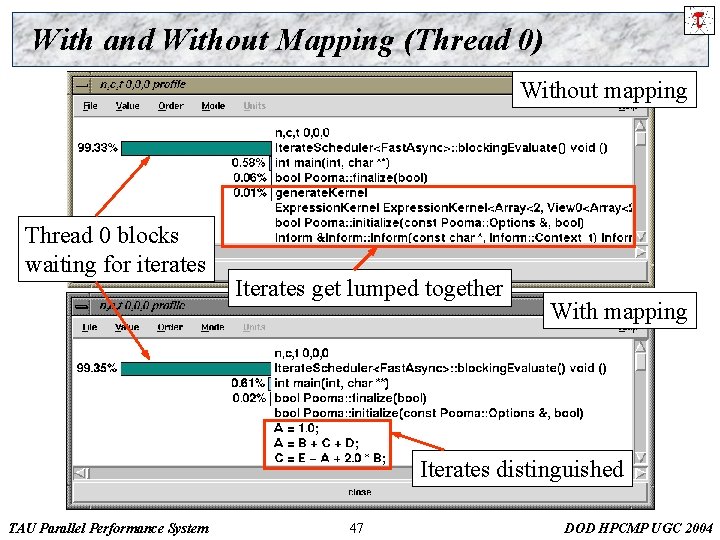
With and Without Mapping (Thread 0) Without mapping Thread 0 blocks waiting for iterates Iterates get lumped together With mapping Iterates distinguished TAU Parallel Performance System 47 DOD HPCMP UGC 2004

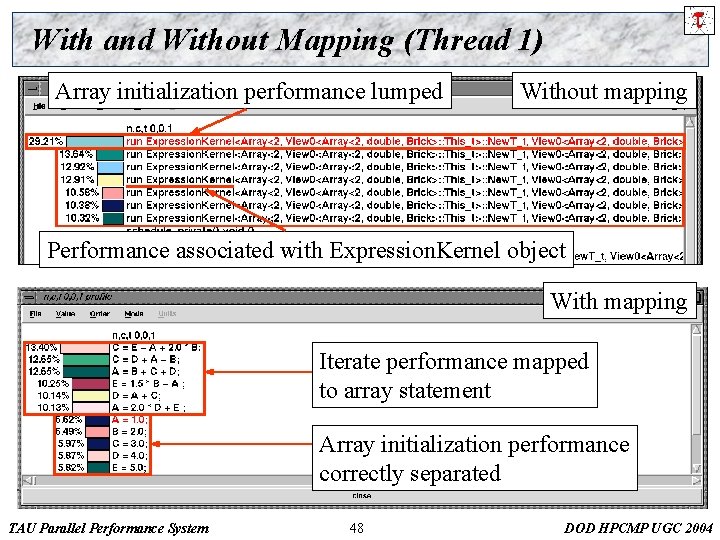
With and Without Mapping (Thread 1) Array initialization performance lumped Without mapping Performance associated with Expression. Kernel object With mapping Iterate performance mapped to array statement Array initialization performance correctly separated TAU Parallel Performance System 48 DOD HPCMP UGC 2004

TAU Profiling of SMARTS Scheduling Iteration scheduling for two array expressions TAU Parallel Performance System 49 DOD HPCMP UGC 2004

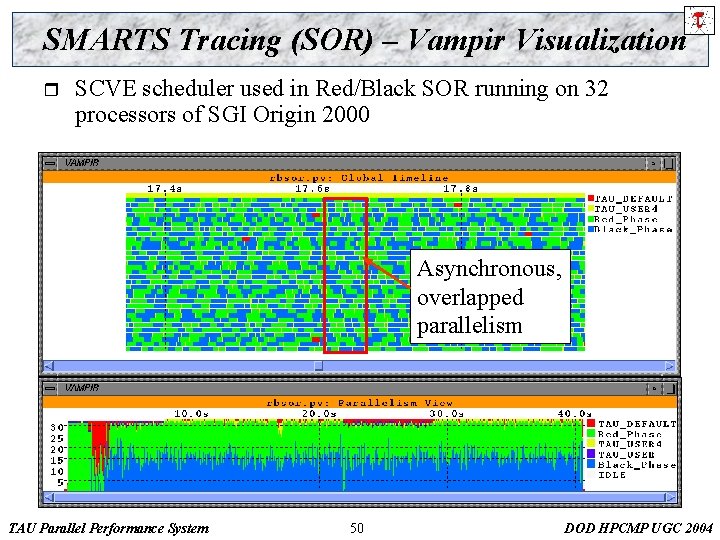
SMARTS Tracing (SOR) – Vampir Visualization r SCVE scheduler used in Red/Black SOR running on 32 processors of SGI Origin 2000 Asynchronous, overlapped parallelism TAU Parallel Performance System 50 DOD HPCMP UGC 2004

Scientific Software (Performance) Engineering r Modern scientific simulation software is complex ( ) ¦ ¦ ¦ r Large development teams of diverse expertise Simultaneous development on different system parts Iterative, multi-stage, long-term software development Need support for managing complex software process ¦ ¦ Software engineering tools for revision control, automated testing, and bug tracking are commonplace In contrast, tools for performance engineering are not Ø evaluation (measurement, analysis, benchmarking) Ø optimization (diagnosis, tracking, prediction, tuning) r Incorporate performance engineering methodology and support by flexible and robust performance tools TAU Parallel Performance System 51 DOD HPCMP UGC 2004

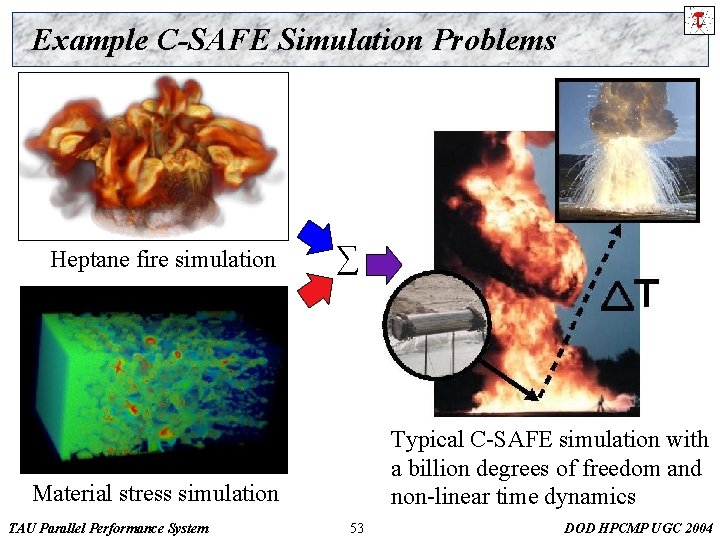
Hierarchical Parallel Software (C-SAFE/Uintah) r Center for Simulation of Accidental Fires & Explosions ¦ ¦ ¦ r ASCI Level 1 center, University of Utah PSE for multi-model simulation high-energy explosion Combine fundamental chemistry and engineering physics Integrate non-linear solvers, optimization, computational steering, visualization, and experimental data verification Support very large-scale coupled simulations Computer science problems: ¦ ¦ ¦ Coupling multiple scientific simulation codes with different numerical and software properties Software engineering across diverse expert teams Achieving high performance on large-scale systems TAU Parallel Performance System 52 DOD HPCMP UGC 2004

Example C-SAFE Simulation Problems Heptane fire simulation ∑ Typical C-SAFE simulation with a billion degrees of freedom and non-linear time dynamics Material stress simulation TAU Parallel Performance System 53 DOD HPCMP UGC 2004

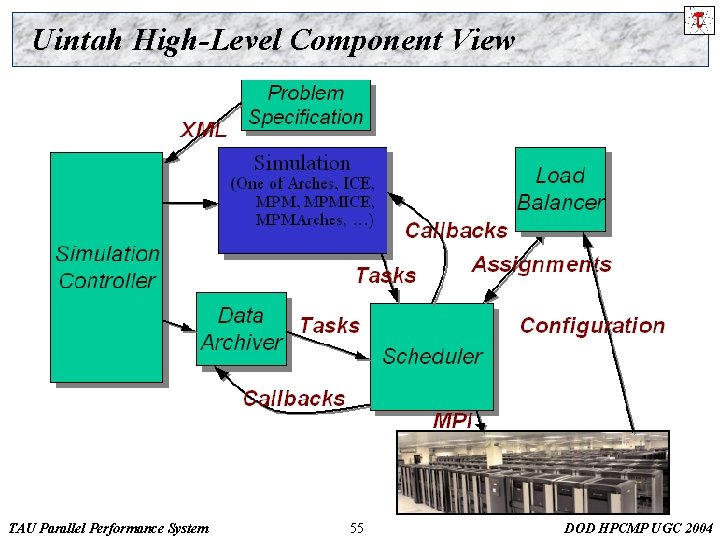
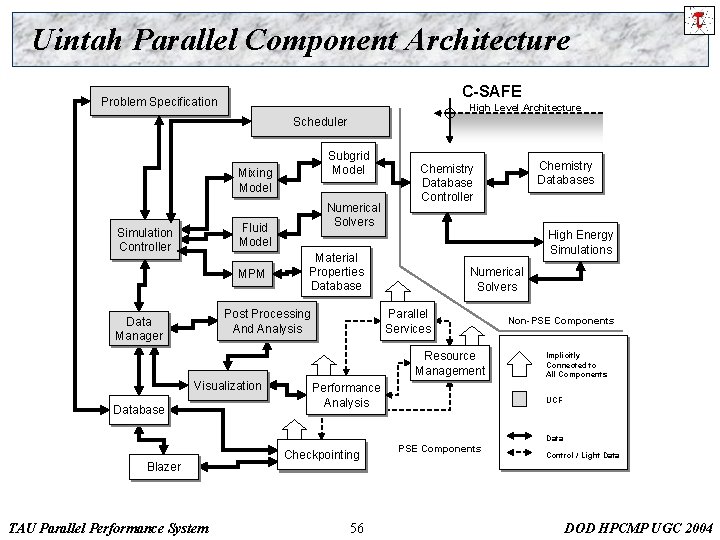
Uintah Problem Solving Environment r Uintah parallel programming framework ¦ ¦ ¦ r Component-based and object-parallel Multi-model task-graph scheduling and execution Shared-memory (thread), distributed-memory (MPI), and mixed-model parallelization Design and implement Uintah component architecture ¦ Application programmers provide Ø description of computation (tasks and variables) Ø code to perform task on sub-region of space (patch) ¦ ¦ r Components for scheduling, partitioning, load balance, … Follow Common Component Architecture (CCA) model Design and implement Uintah Computational Framework (UCF) on top of the component architecture TAU Parallel Performance System 54 DOD HPCMP UGC 2004

Uintah High-Level Component View TAU Parallel Performance System 55 DOD HPCMP UGC 2004

Uintah Parallel Component Architecture C-SAFE Problem Specification High Level Architecture Scheduler Subgrid Model Mixing Model Numerical Solvers Fluid Model Simulation Controller MPM High Energy Simulations Material Properties Database Post Processing And Analysis Data Manager Numerical Solvers Parallel Services Resource Management Visualization Database Chemistry Databases Chemistry Database Controller Performance Analysis Non-PSE Components Implicitly Connected to All Components UCF Data Blazer TAU Parallel Performance System Checkpointing 56 PSE Components Control / Light Data DOD HPCMP UGC 2004

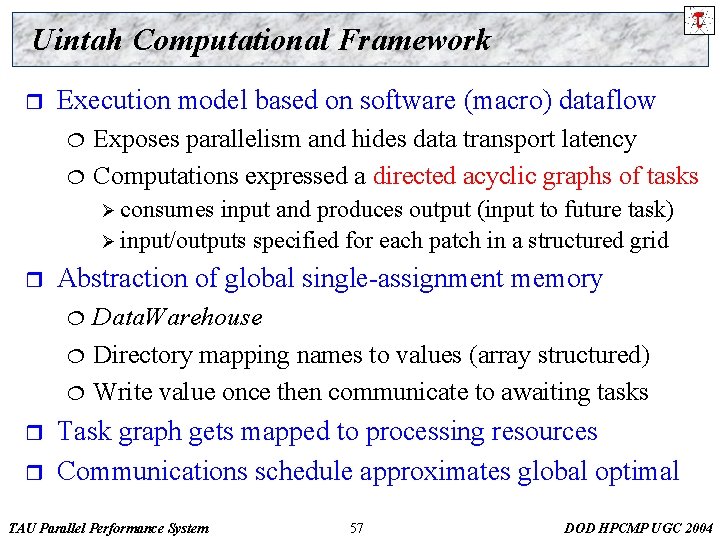
Uintah Computational Framework r Execution model based on software (macro) dataflow ¦ ¦ Exposes parallelism and hides data transport latency Computations expressed a directed acyclic graphs of tasks Ø consumes input and produces output (input to future task) Ø input/outputs specified for each patch in a structured grid r Abstraction of global single-assignment memory ¦ ¦ ¦ r r Data. Warehouse Directory mapping names to values (array structured) Write value once then communicate to awaiting tasks Task graph gets mapped to processing resources Communications schedule approximates global optimal TAU Parallel Performance System 57 DOD HPCMP UGC 2004

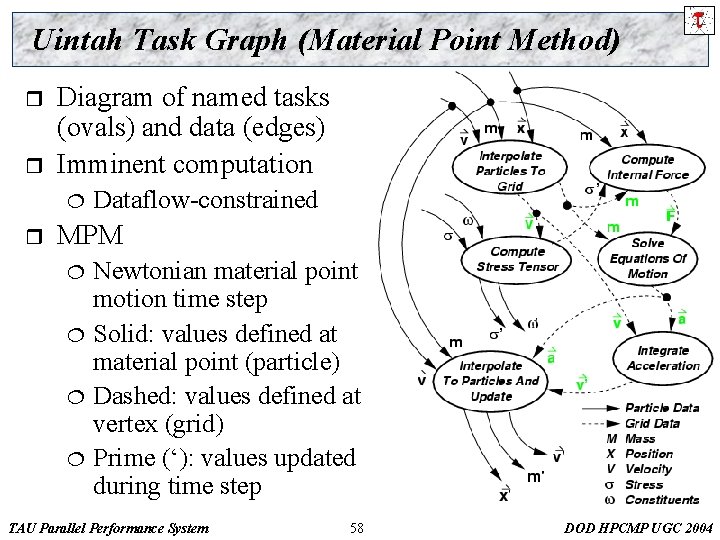
Uintah Task Graph (Material Point Method) r r Diagram of named tasks (ovals) and data (edges) Imminent computation ¦ r Dataflow-constrained MPM ¦ ¦ Newtonian material point motion time step Solid: values defined at material point (particle) Dashed: values defined at vertex (grid) Prime (‘): values updated during time step TAU Parallel Performance System 58 DOD HPCMP UGC 2004

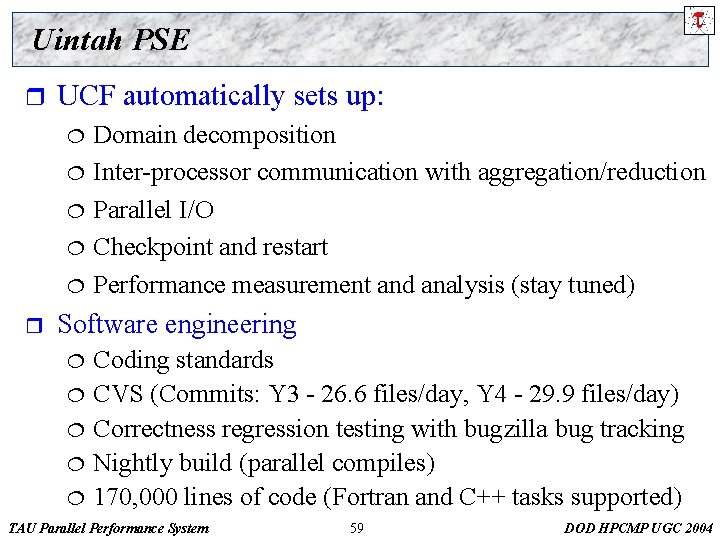
Uintah PSE r UCF automatically sets up: ¦ ¦ ¦ r Domain decomposition Inter-processor communication with aggregation/reduction Parallel I/O Checkpoint and restart Performance measurement and analysis (stay tuned) Software engineering ¦ ¦ ¦ Coding standards CVS (Commits: Y 3 - 26. 6 files/day, Y 4 - 29. 9 files/day) Correctness regression testing with bugzilla bug tracking Nightly build (parallel compiles) 170, 000 lines of code (Fortran and C++ tasks supported) TAU Parallel Performance System 59 DOD HPCMP UGC 2004

Performance Technology Integration r Uintah presents challenges to performance integration ¦ Software diversity and structure Ø UCF middleware, simulation code modules Ø component-based hierarchy ¦ Portability objectives Ø cross-language (C, C++, F 90) and cross-platform Ø multi-parallelism: thread, message passing, mixed ¦ ¦ r r Scalability objectives High-level programming and execution abstractions Requires flexible and robust performance technology Requires support for performance mapping TAU Parallel Performance System 60 DOD HPCMP UGC 2004

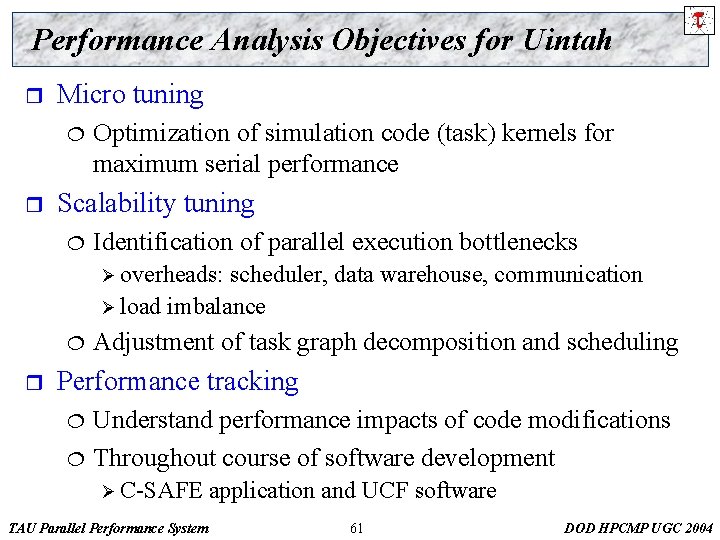
Performance Analysis Objectives for Uintah r Micro tuning ¦ r Optimization of simulation code (task) kernels for maximum serial performance Scalability tuning ¦ Identification of parallel execution bottlenecks Ø overheads: scheduler, data warehouse, communication Ø load imbalance ¦ r Adjustment of task graph decomposition and scheduling Performance tracking ¦ ¦ Understand performance impacts of code modifications Throughout course of software development Ø C-SAFE TAU Parallel Performance System application and UCF software 61 DOD HPCMP UGC 2004

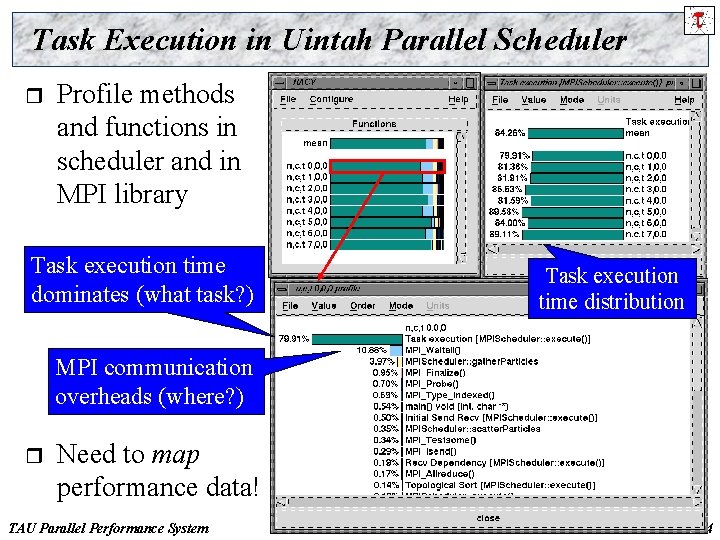
Task Execution in Uintah Parallel Scheduler r Profile methods and functions in scheduler and in MPI library Task execution time dominates (what task? ) Task execution time distribution MPI communication overheads (where? ) r Need to map performance data! TAU Parallel Performance System 63 DOD HPCMP UGC 2004

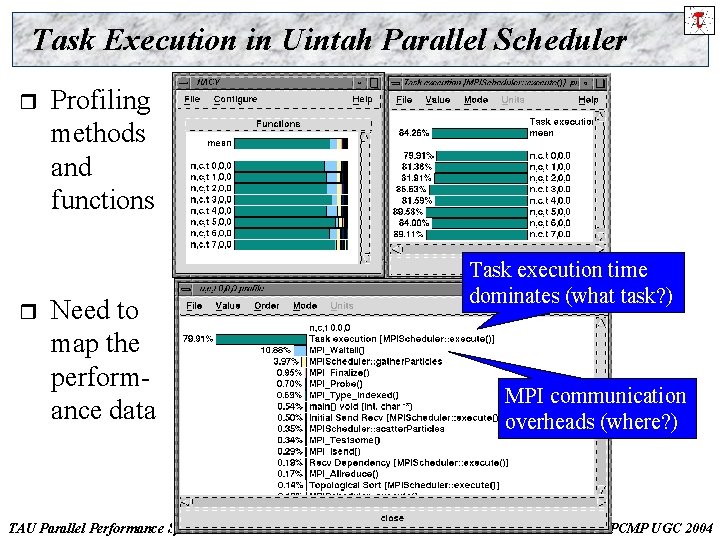
Task Execution in Uintah Parallel Scheduler r r Profiling methods and functions Task execution time dominates (what task? ) Need to map the performance data TAU Parallel Performance System MPI communication overheads (where? ) 64 DOD HPCMP UGC 2004

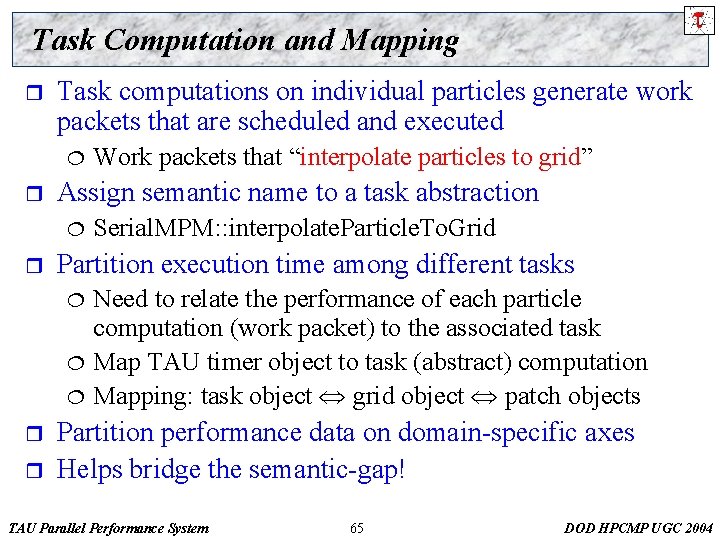
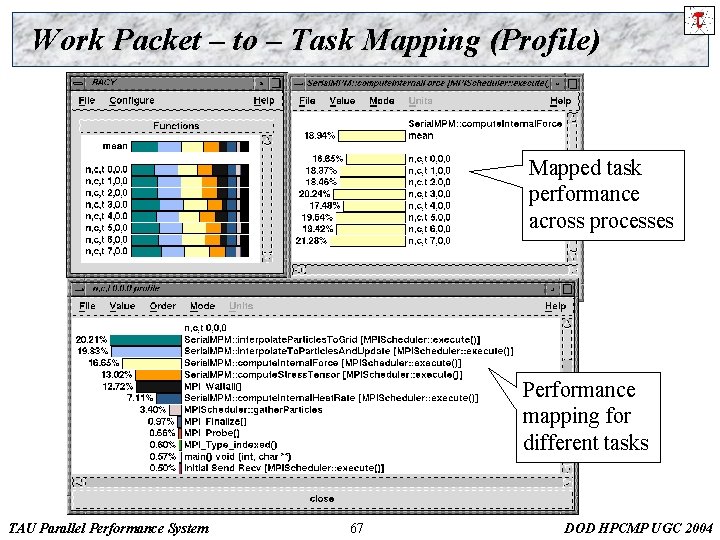
Task Computation and Mapping r Task computations on individual particles generate work packets that are scheduled and executed ¦ r Assign semantic name to a task abstraction ¦ r ¦ ¦ r Serial. MPM: : interpolate. Particle. To. Grid Partition execution time among different tasks ¦ r Work packets that “interpolate particles to grid” Need to relate the performance of each particle computation (work packet) to the associated task Map TAU timer object to task (abstract) computation Mapping: task object grid object patch objects Partition performance data on domain-specific axes Helps bridge the semantic-gap! TAU Parallel Performance System 65 DOD HPCMP UGC 2004

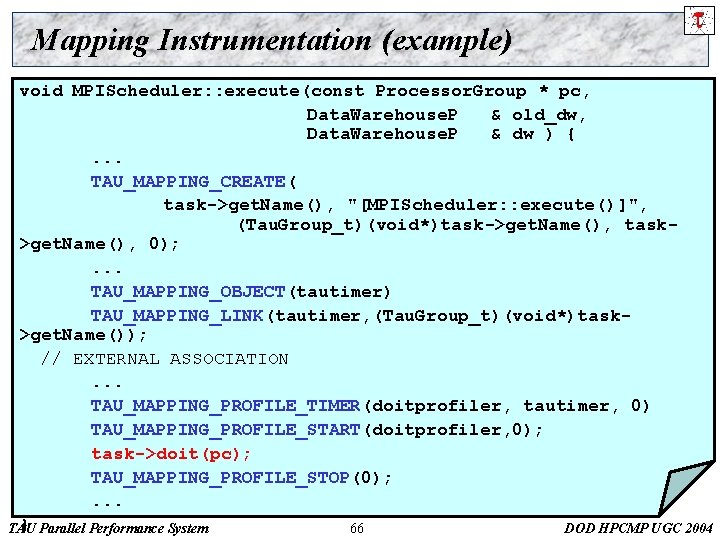
Mapping Instrumentation (example) void MPIScheduler: : execute(const Processor. Group * pc, Data. Warehouse. P & old_dw, Data. Warehouse. P & dw ) {. . . TAU_MAPPING_CREATE( task->get. Name(), "[MPIScheduler: : execute()]", (Tau. Group_t)(void*)task->get. Name(), task>get. Name(), 0); . . . TAU_MAPPING_OBJECT(tautimer) TAU_MAPPING_LINK(tautimer, (Tau. Group_t)(void*)task>get. Name()); // EXTERNAL ASSOCIATION. . . TAU_MAPPING_PROFILE_TIMER(doitprofiler, tautimer, 0) TAU_MAPPING_PROFILE_START(doitprofiler, 0); task->doit(pc); TAU_MAPPING_PROFILE_STOP(0); . . . } Parallel Performance System TAU 66 DOD HPCMP UGC 2004

Work Packet – to – Task Mapping (Profile) Mapped task performance across processes Performance mapping for different tasks TAU Parallel Performance System 67 DOD HPCMP UGC 2004

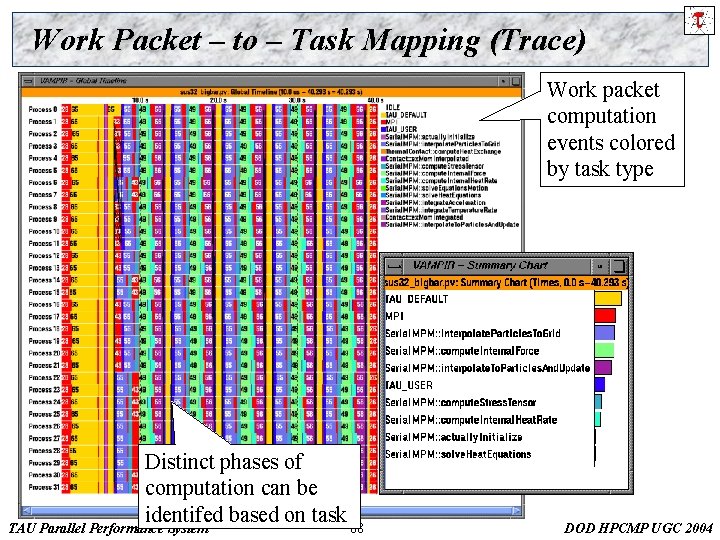
Work Packet – to – Task Mapping (Trace) Work packet computation events colored by task type Distinct phases of computation can be identifed based on task TAU Parallel Performance System 68 DOD HPCMP UGC 2004

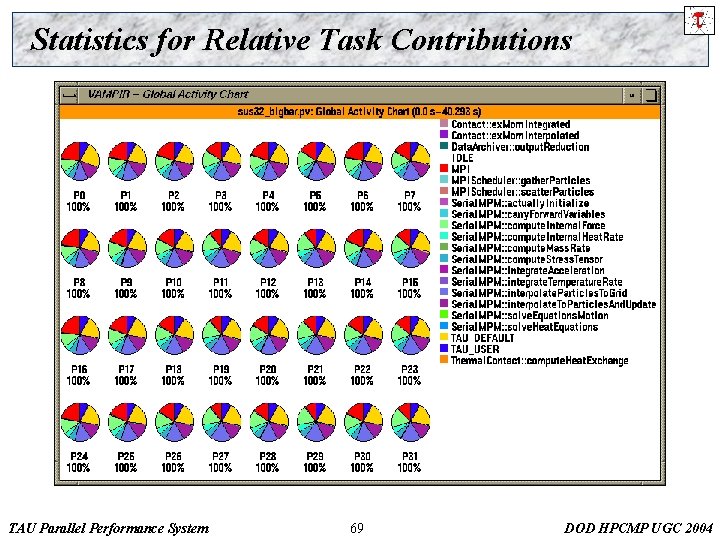
Statistics for Relative Task Contributions TAU Parallel Performance System 69 DOD HPCMP UGC 2004

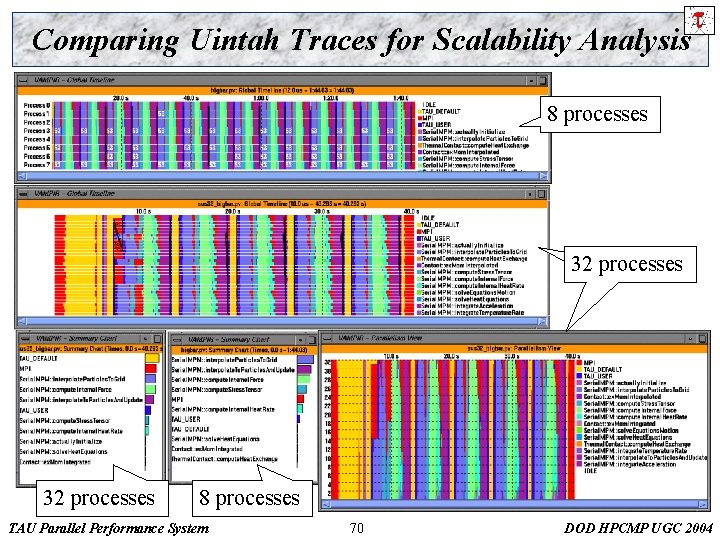
Comparing Uintah Traces for Scalability Analysis 8 processes 32 processes 8 processes TAU Parallel Performance System 70 DOD HPCMP UGC 2004

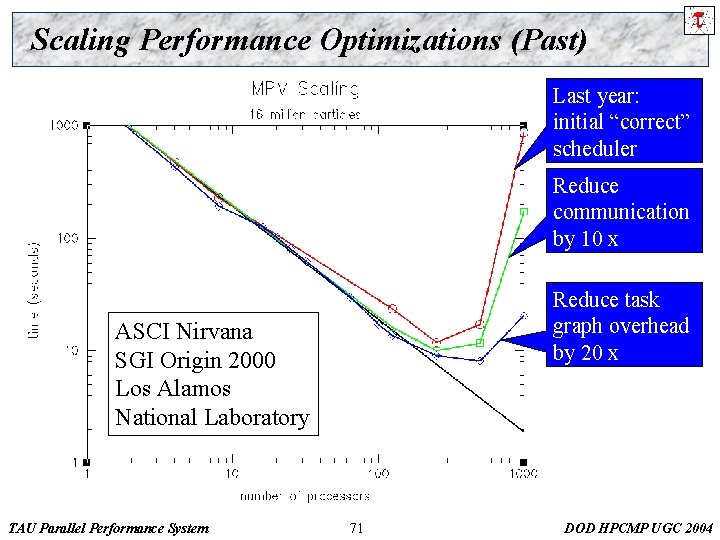
Scaling Performance Optimizations (Past) Last year: initial “correct” scheduler Reduce communication by 10 x Reduce task graph overhead by 20 x ASCI Nirvana SGI Origin 2000 Los Alamos National Laboratory TAU Parallel Performance System 71 DOD HPCMP UGC 2004

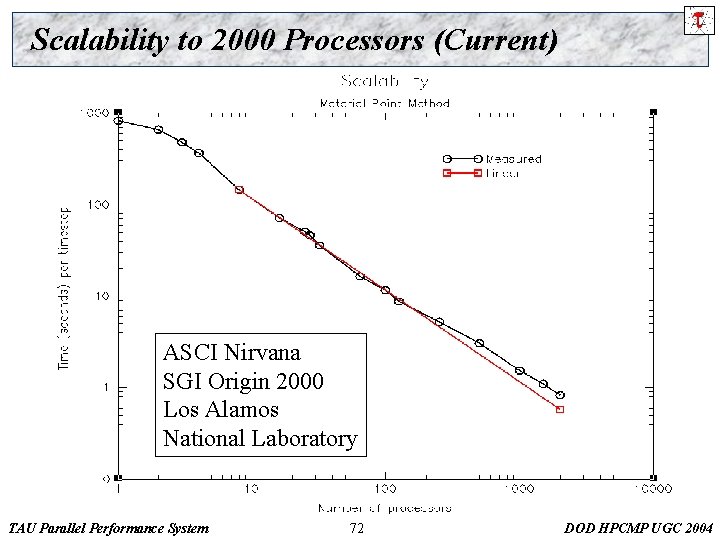
Scalability to 2000 Processors (Current) ASCI Nirvana SGI Origin 2000 Los Alamos National Laboratory TAU Parallel Performance System 72 DOD HPCMP UGC 2004

HYbrid Coordinate Ocean Model (HYCOM) r Climate, weather and ocean (CWO) based application ¦ ¦ r Transitions smoothly ¦ r To z-level coordinates in the weakly-stratified upperocean mixed layer, to sigma coordinates in shallow water conditions and back to z-level coordinates in very shallow water conditions User has control over the model domain ¦ r Primitive equation ocean circulation model (MICOM) Improved vertical coordinate scheme that remains isopycnic in the open, stratified ocean Generating the forcing field Dr. Avi Purkayastha TAU Parallel Performance System 73 DOD HPCMP UGC 2004

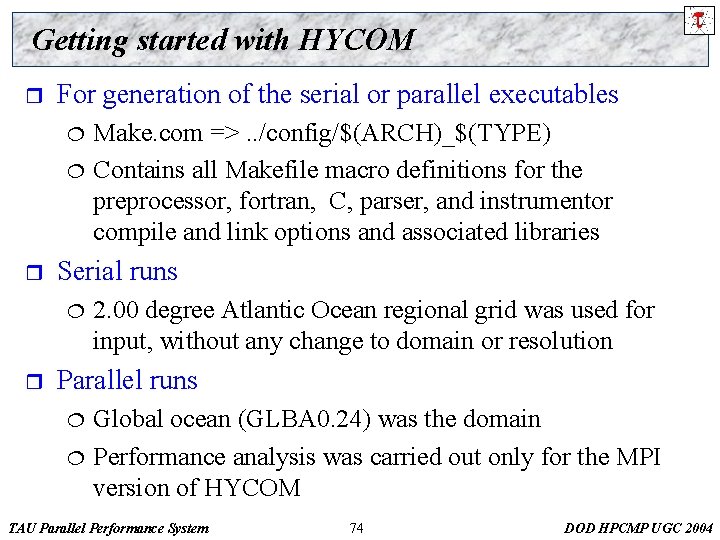
Getting started with HYCOM r For generation of the serial or parallel executables ¦ ¦ r Serial runs ¦ r Make. com =>. . /config/$(ARCH)_$(TYPE) Contains all Makefile macro definitions for the preprocessor, fortran, C, parser, and instrumentor compile and link options and associated libraries 2. 00 degree Atlantic Ocean regional grid was used for input, without any change to domain or resolution Parallel runs ¦ ¦ Global ocean (GLBA 0. 24) was the domain Performance analysis was carried out only for the MPI version of HYCOM TAU Parallel Performance System 74 DOD HPCMP UGC 2004

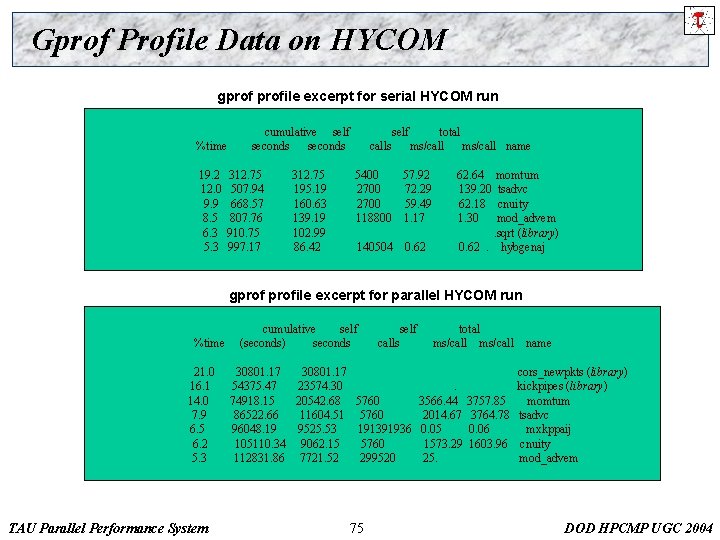
Gprof Profile Data on HYCOM gprofile excerpt for serial HYCOM run %time 19. 2 12. 0 9. 9 8. 5 6. 3 5. 3 cumulative self seconds 312. 75 507. 94 668. 57 807. 76 910. 75 997. 17 312. 75 195. 19 160. 63 139. 19 102. 99 86. 42 self calls total ms/call name 5400 57. 92 2700 72. 29 2700 59. 49 118800 1. 17 140504 0. 62 62. 64 139. 20 62. 18 1. 30 momtum tsadvc cnuity mod_advem. sqrt (library) 0. 62. hybgenaj gprofile excerpt for parallel HYCOM run %time 21. 0 16. 1 14. 0 7. 9 6. 5 6. 2 5. 3 TAU Parallel Performance System cumulative self (seconds) seconds self calls 30801. 17 54375. 47 23574. 30 74918. 15 20542. 68 5760 86522. 66 11604. 51 5760 96048. 19 9525. 53 191391936 105110. 34 9062. 15 5760 112831. 86 7721. 52 299520 75 total ms/call name cors_newpkts (library). kickpipes (library) 3566. 44 3757. 85 momtum 2014. 67 3764. 78 tsadvc 0. 05 0. 06 mxkppaij 1573. 29 1603. 96 cnuity 25. mod_advem DOD HPCMP UGC 2004

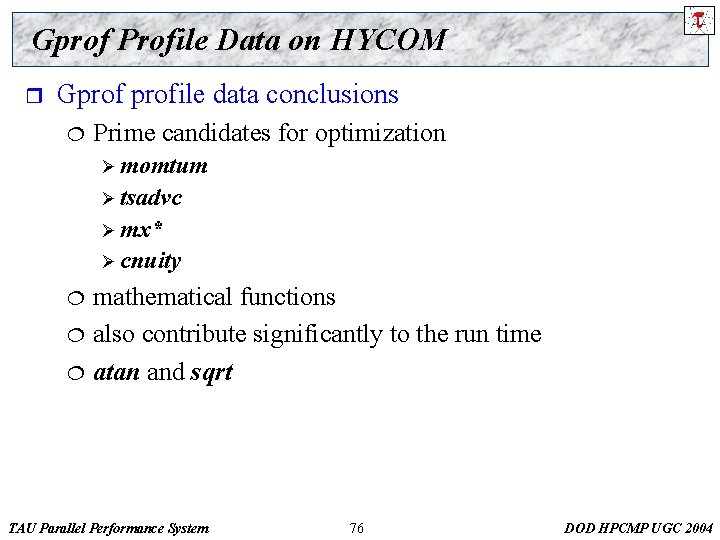
Gprof Profile Data on HYCOM r Gprofile data conclusions ¦ Prime candidates for optimization Ø momtum Ø tsadvc Ø mx* Ø cnuity ¦ ¦ ¦ mathematical functions also contribute significantly to the run time atan and sqrt TAU Parallel Performance System 76 DOD HPCMP UGC 2004

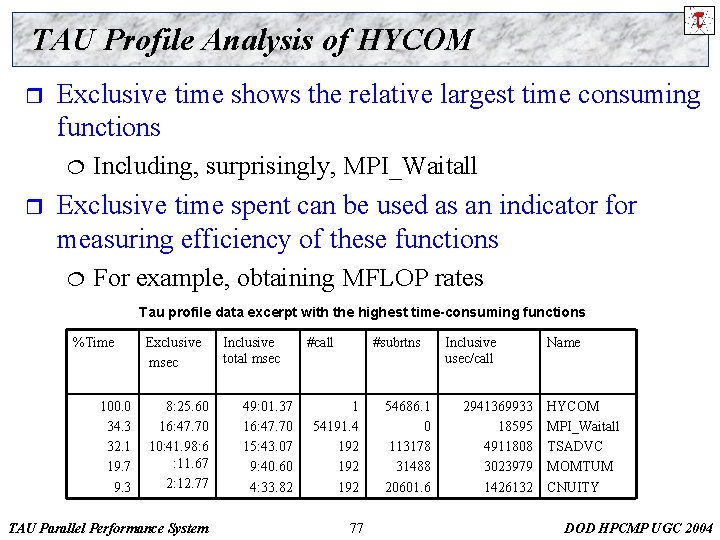
TAU Profile Analysis of HYCOM r Exclusive time shows the relative largest time consuming functions ¦ r Including, surprisingly, MPI_Waitall Exclusive time spent can be used as an indicator for measuring efficiency of these functions ¦ For example, obtaining MFLOP rates Tau profile data excerpt with the highest time-consuming functions %Time 100. 0 34. 3 32. 1 19. 7 9. 3 Exclusive msec 8: 25. 60 16: 47. 70 10: 41. 98: 6 : 11. 67 2: 12. 77 TAU Parallel Performance System Inclusive total msec 49: 01. 37 16: 47. 70 15: 43. 07 9: 40. 60 4: 33. 82 #call #subrtns 1 54191. 4 192 192 77 54686. 1 0 113178 31488 20601. 6 Inclusive usec/call 2941369933 18595 4911808 3023979 1426132 Name HYCOM MPI_Waitall TSADVC MOMTUM CNUITY DOD HPCMP UGC 2004

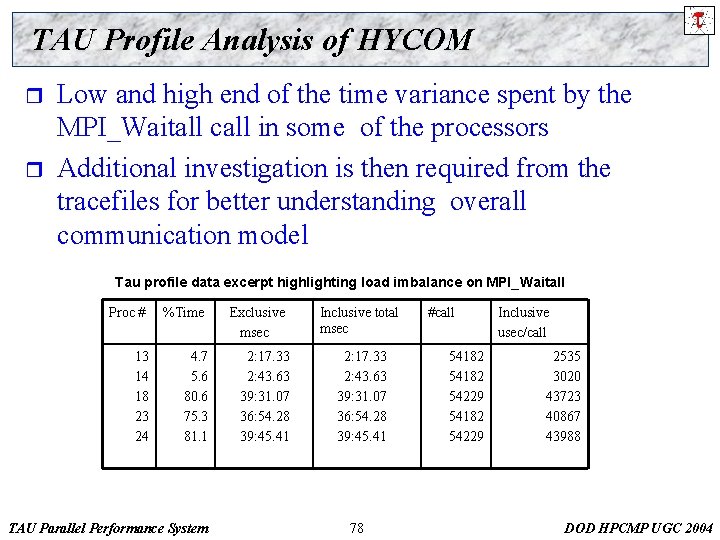
TAU Profile Analysis of HYCOM r r Low and high end of the time variance spent by the MPI_Waitall call in some of the processors Additional investigation is then required from the tracefiles for better understanding overall communication model Tau profile data excerpt highlighting load imbalance on MPI_Waitall Proc # %Time 13 14 18 23 24 4. 7 5. 6 80. 6 75. 3 81. 1 TAU Parallel Performance System Exclusive msec 2: 17. 33 2: 43. 63 39: 31. 07 36: 54. 28 39: 45. 41 Inclusive total msec 2: 17. 33 2: 43. 63 39: 31. 07 36: 54. 28 39: 45. 41 78 #call 54182 54229 Inclusive usec/call 2535 3020 43723 40867 43988 DOD HPCMP UGC 2004

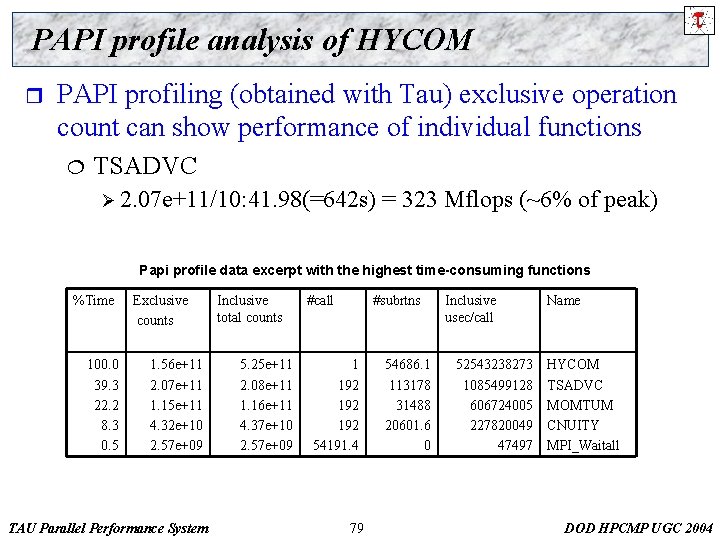
PAPI profile analysis of HYCOM r PAPI profiling (obtained with Tau) exclusive operation count can show performance of individual functions ¦ TSADVC Ø 2. 07 e+11/10: 41. 98(=642 s) = 323 Mflops (~6% of peak) Papi profile data excerpt with the highest time-consuming functions %Time 100. 0 39. 3 22. 2 8. 3 0. 5 Exclusive counts 1. 56 e+11 2. 07 e+11 1. 15 e+11 4. 32 e+10 2. 57 e+09 TAU Parallel Performance System Inclusive total counts 5. 25 e+11 2. 08 e+11 1. 16 e+11 4. 37 e+10 2. 57 e+09 #call #subrtns 1 192 192 54191. 4 79 54686. 1 113178 31488 20601. 6 0 Inclusive usec/call 52543238273 1085499128 606724005 227820049 47497 Name HYCOM TSADVC MOMTUM CNUITY MPI_Waitall DOD HPCMP UGC 2004

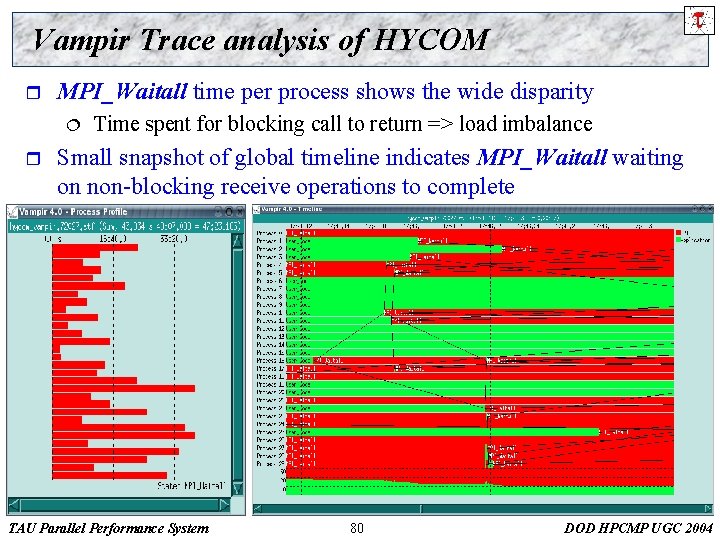
Vampir Trace analysis of HYCOM r MPI_Waitall time per process shows the wide disparity ¦ r Time spent for blocking call to return => load imbalance Small snapshot of global timeline indicates MPI_Waitall waiting on non-blocking receive operations to complete TAU Parallel Performance System 80 DOD HPCMP UGC 2004

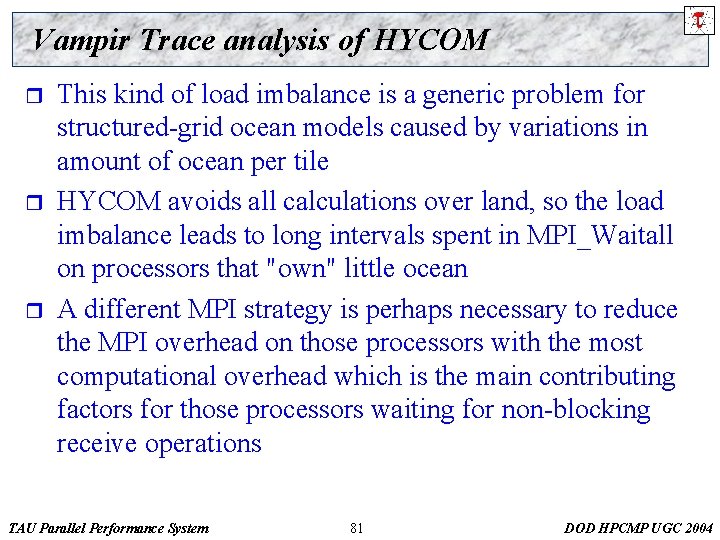
Vampir Trace analysis of HYCOM r r r This kind of load imbalance is a generic problem for structured-grid ocean models caused by variations in amount of ocean per tile HYCOM avoids all calculations over land, so the load imbalance leads to long intervals spent in MPI_Waitall on processors that "own" little ocean A different MPI strategy is perhaps necessary to reduce the MPI overhead on those processors with the most computational overhead which is the main contributing factors for those processors waiting for non-blocking receive operations TAU Parallel Performance System 81 DOD HPCMP UGC 2004

Air-Vehicles Unstructured flow Solver (AVUS) r CFD application formerly known as Cobalt 60 ¦ Parallel, implicit Euler/Navier-Stokes 3 -D flow solver Ø Second r r Solver accepts unstructured meshes composed of a mix of hexahedra, prisms, pyramids, and tetrahedron Solver employs a cell-centered, finite-volume method ¦ r order accurate in space and time Maintains a compact stencil on an unstructured mesh Solver incorporates two one-equation turbulence models ¦ ¦ Spalart-Allmaras and Baldwin-Barth models Either can be chosen for a flow simulation TAU Parallel Performance System 82 DOD HPCMP UGC 2004

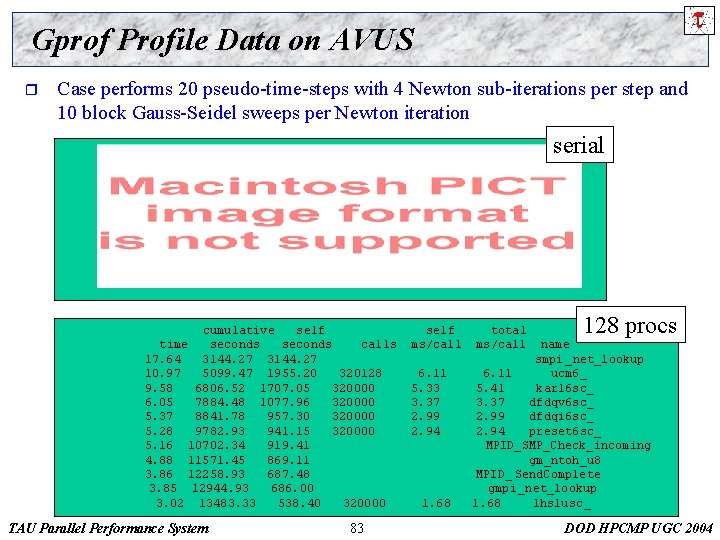
Gprof Profile Data on AVUS r Case performs 20 pseudo-time-steps with 4 Newton sub-iterations per step and 10 block Gauss-Seidel sweeps per Newton iteration serial cumulative self time seconds calls 17. 64 3144. 27 10. 97 5099. 47 1955. 20 320128 9. 58 6806. 52 1707. 05 320000 6. 05 7884. 48 1077. 96 320000 5. 37 8841. 78 957. 30 320000 5. 28 9782. 93 941. 15 320000 5. 16 10702. 34 919. 41 4. 88 11571. 45 869. 11 3. 86 12258. 93 687. 48 3. 85 12944. 93 686. 00 3. 02 13483. 33 538. 40 320000 TAU Parallel Performance System 83 self ms/call 6. 11 5. 33 3. 37 2. 99 2. 94 1. 68 total ms/call 128 procs name smpi _net_lookup 6. 11 ucm 6_ 5. 41 karl 6 sc_ 3. 37 dfdqv 6 sc_ 2. 99 dfdqi 6 sc_ 2. 94 preset 6 sc_ MPID_SMP_Check_incoming gm_ntoh_u 8 MPID_ Send. Complete gmpi _net_lookup 1. 68 lhslusc_ DOD HPCMP UGC 2004

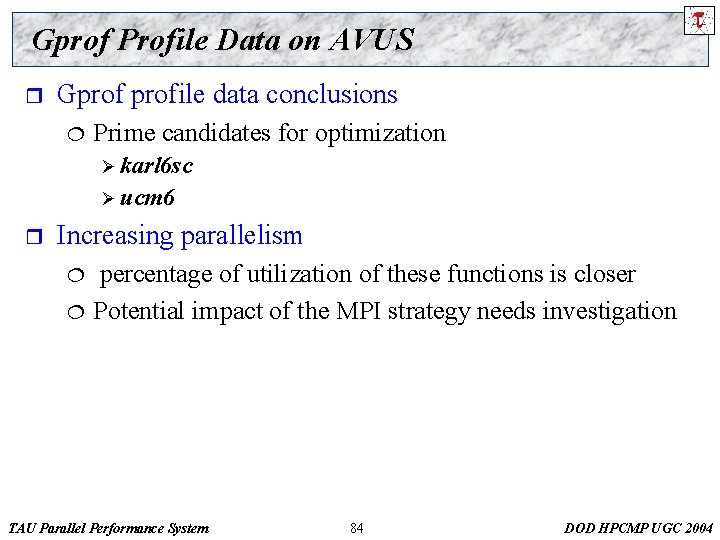
Gprof Profile Data on AVUS r Gprofile data conclusions ¦ Prime candidates for optimization Ø karl 6 sc Ø ucm 6 r Increasing parallelism ¦ ¦ percentage of utilization of these functions is closer Potential impact of the MPI strategy needs investigation TAU Parallel Performance System 84 DOD HPCMP UGC 2004

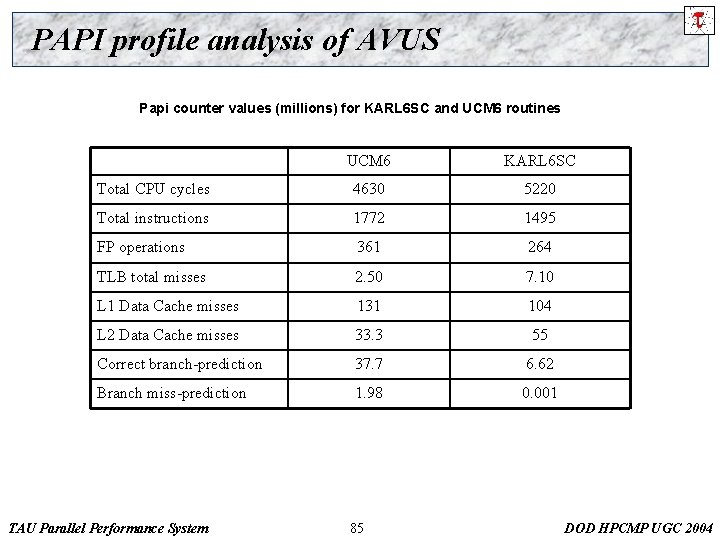
PAPI profile analysis of AVUS Papi counter values (millions) for KARL 6 SC and UCM 6 routines UCM 6 KARL 6 SC Total CPU cycles 4630 5220 Total instructions 1772 1495 FP operations 361 264 TLB total misses 2. 50 7. 10 L 1 Data Cache misses 131 104 L 2 Data Cache misses 33. 3 55 Correct branch-prediction 37. 7 6. 62 Branch miss-prediction 1. 98 0. 001 TAU Parallel Performance System 85 DOD HPCMP UGC 2004

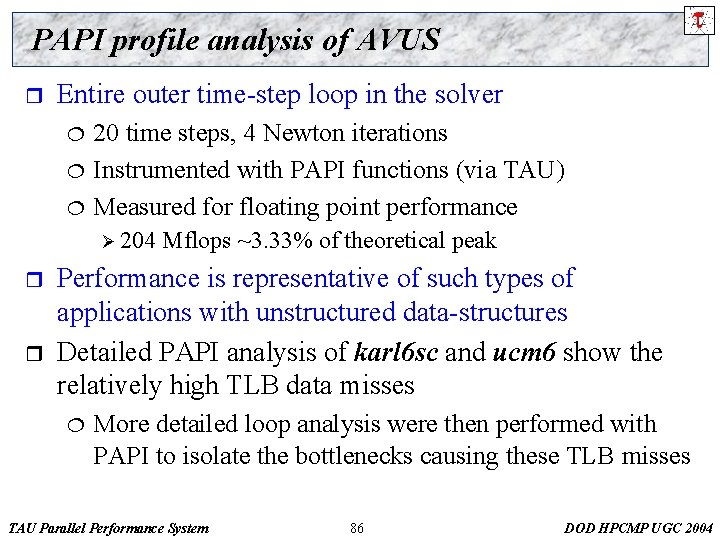
PAPI profile analysis of AVUS r Entire outer time-step loop in the solver ¦ ¦ ¦ 20 time steps, 4 Newton iterations Instrumented with PAPI functions (via TAU) Measured for floating point performance Ø 204 r r Mflops ~3. 33% of theoretical peak Performance is representative of such types of applications with unstructured data-structures Detailed PAPI analysis of karl 6 sc and ucm 6 show the relatively high TLB data misses ¦ More detailed loop analysis were then performed with PAPI to isolate the bottlenecks causing these TLB misses TAU Parallel Performance System 86 DOD HPCMP UGC 2004

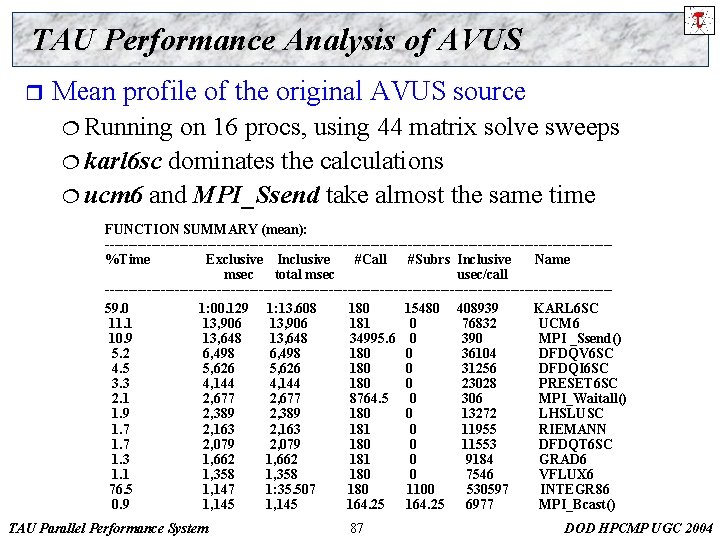
TAU Performance Analysis of AVUS r Mean profile of the original AVUS source ¦ Running on 16 procs, using 44 matrix solve sweeps ¦ karl 6 sc dominates the calculations ¦ ucm 6 and MPI_Ssend take almost the same time FUNCTION SUMMARY (mean): ------------------------------------------------------%Time Exclusive Inclusive #Call #Subrs Inclusive Name msec total msec usec/call ------------------------------------------------------59. 0 1: 00. 129 1: 13. 608 180 15480 408939 KARL 6 SC 11. 1 13, 906 181 0 76832 UCM 6 10. 9 13, 648 34995. 6 0 390 MPI _Ssend() 5. 2 6, 498 180 0 36104 DFDQV 6 SC 4. 5 5, 626 180 0 31256 DFDQI 6 SC 3. 3 4, 144 180 0 23028 PRESET 6 SC 2. 1 2, 677 8764. 5 0 306 MPI_Waitall() 1. 9 2, 389 180 0 13272 LHSLUSC 1. 7 2, 163 181 0 11955 RIEMANN 1. 7 2, 079 180 0 11553 DFDQT 6 SC 1. 3 1, 662 181 0 9184 GRAD 6 1. 1 1, 358 180 0 7546 VFLUX 6 76. 5 1, 147 1: 35. 507 180 1100 530597 INTEGR 86 0. 9 1, 145 164. 25 6977 MPI_Bcast() TAU Parallel Performance System 87 DOD HPCMP UGC 2004

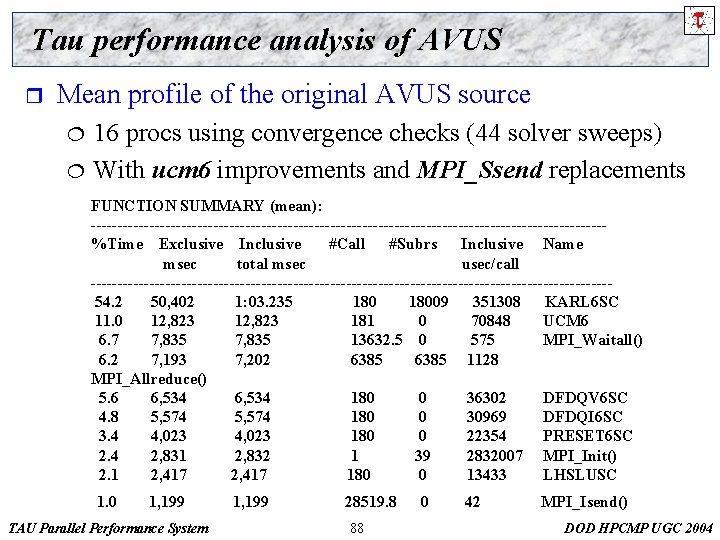
Tau performance analysis of AVUS r Mean profile of the original AVUS source ¦ ¦ 16 procs using convergence checks (44 solver sweeps) With ucm 6 improvements and MPI_Ssend replacements FUNCTION SUMMARY (mean): ------------------------------------------------%Time Exclusive Inclusive #Call #Subrs Inclusive Name msec total msec usec/call -------------------------------------------------54. 2 50, 402 1: 03. 235 18009 351308 KARL 6 SC 11. 0 12, 823 181 0 70848 UCM 6 6. 7 7, 835 13632. 5 0 575 MPI_Waitall() 6. 2 7, 193 7, 202 6385 1128 MPI_Allreduce() 5. 6 6, 534 180 0 36302 DFDQV 6 SC 4. 8 5, 574 180 0 30969 DFDQI 6 SC 3. 4 4, 023 180 0 22354 PRESET 6 SC 2. 4 2, 831 2, 832 1 39 2832007 MPI_Init() 2. 1 2, 417 180 0 13433 LHSLUSC 1. 0 1, 199 TAU Parallel Performance System 1, 199 28519. 8 88 0 42 MPI_Isend() DOD HPCMP UGC 2004

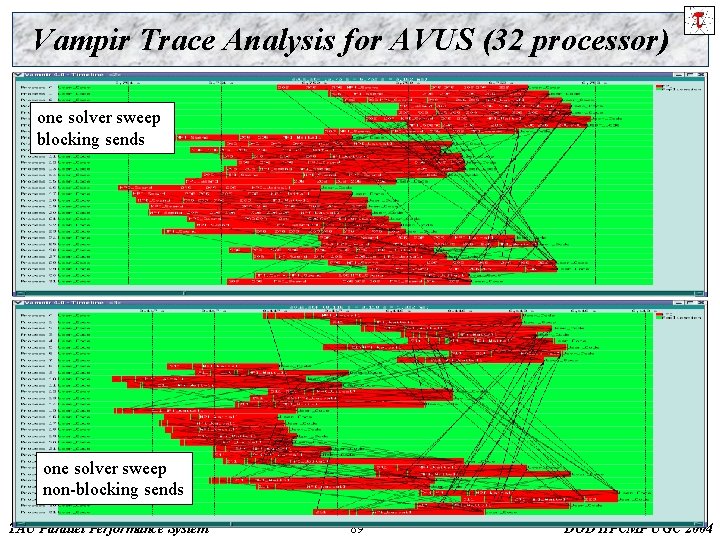
Vampir Trace Analysis for AVUS (32 processor) one solver sweep blocking sends one solver sweep non-blocking sends TAU Parallel Performance System 89 DOD HPCMP UGC 2004

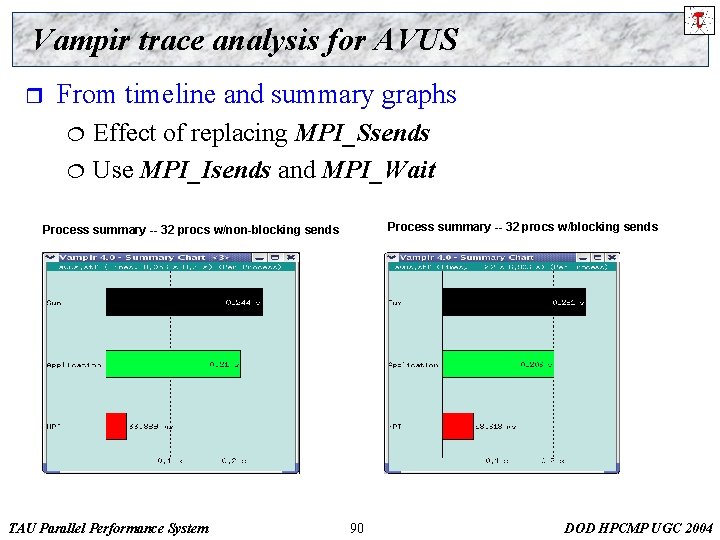
Vampir trace analysis for AVUS r From timeline and summary graphs ¦ ¦ Effect of replacing MPI_Ssends Use MPI_Isends and MPI_Wait Process summary -- 32 procs w/blocking sends Process summary -- 32 procs w/non-blocking sends TAU Parallel Performance System 90 DOD HPCMP UGC 2004

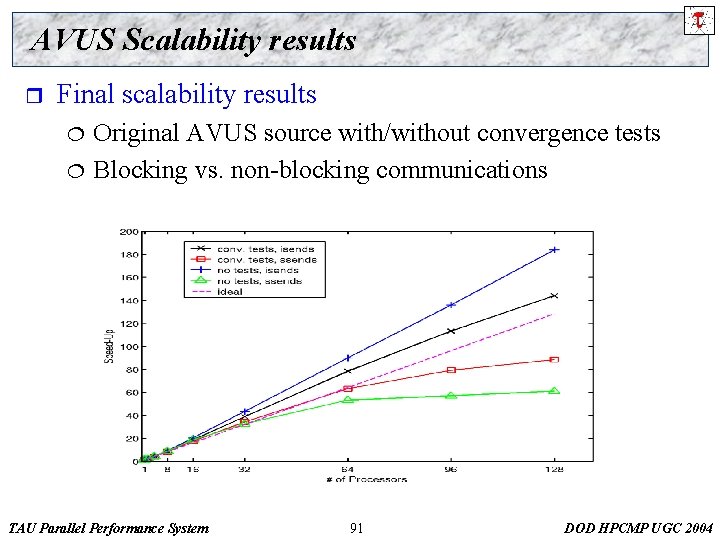
AVUS Scalability results r Final scalability results ¦ ¦ Original AVUS source with/without convergence tests Blocking vs. non-blocking communications TAU Parallel Performance System 91 DOD HPCMP UGC 2004

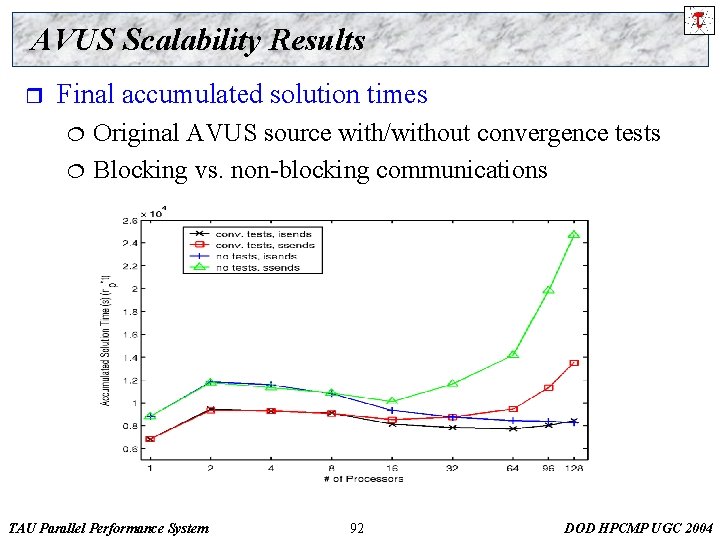
AVUS Scalability Results r Final accumulated solution times ¦ ¦ Original AVUS source with/without convergence tests Blocking vs. non-blocking communications TAU Parallel Performance System 92 DOD HPCMP UGC 2004

Performance Data Management r r r Performance evaluation of parallel programs and systems requires analysis of data from multiple experiments Little support exists for storing and evaluating datasets from a variety of experimentation scenarios Need open performance data management technology that can provide a common, reusable foundation for performance results storage, access and sharing Provide standard solutions for how to represent parallel performance data Performance Data Management Framework (Perf. DMF) TAU Parallel Performance System 93 DOD HPCMP UGC 2004

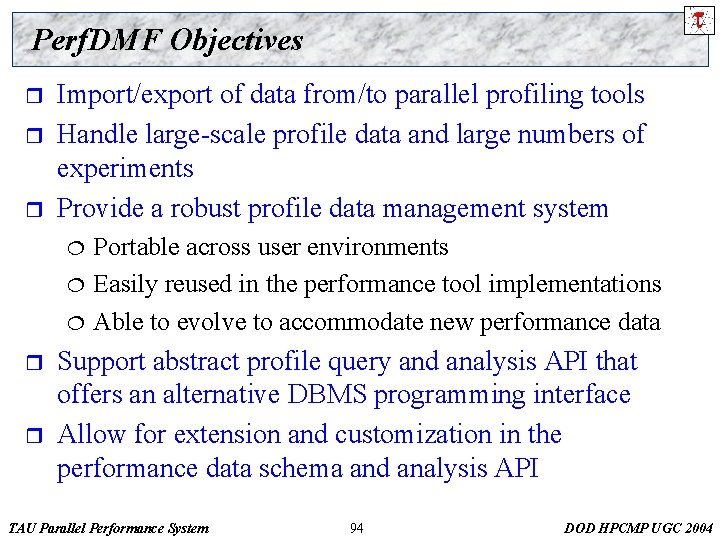
Perf. DMF Objectives r r r Import/export of data from/to parallel profiling tools Handle large-scale profile data and large numbers of experiments Provide a robust profile data management system ¦ ¦ ¦ r r Portable across user environments Easily reused in the performance tool implementations Able to evolve to accommodate new performance data Support abstract profile query and analysis API that offers an alternative DBMS programming interface Allow for extension and customization in the performance data schema and analysis API TAU Parallel Performance System 94 DOD HPCMP UGC 2004

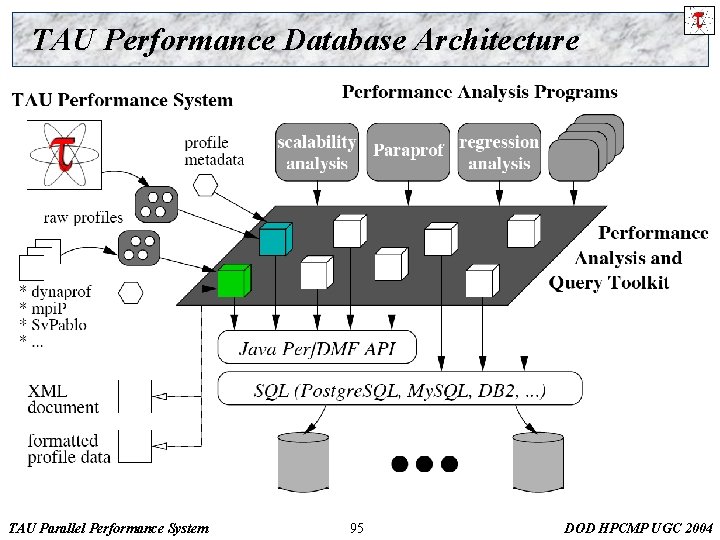
TAU Performance Database Architecture TAU Parallel Performance System 95 DOD HPCMP UGC 2004

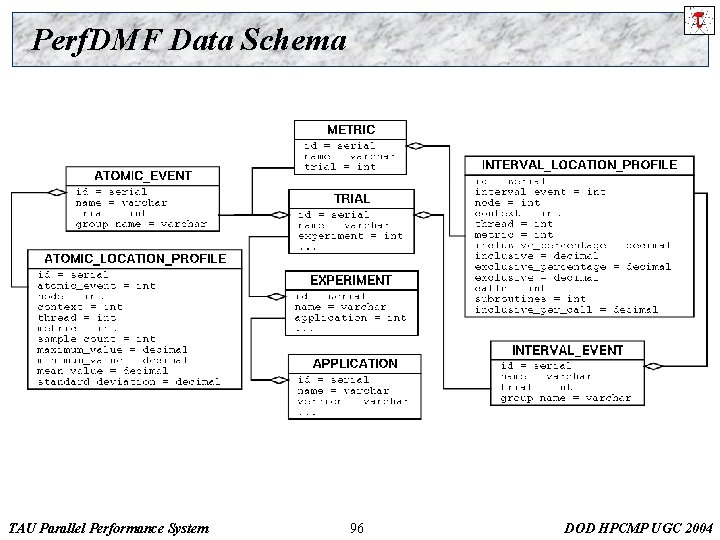
Perf. DMF Data Schema TAU Parallel Performance System 96 DOD HPCMP UGC 2004

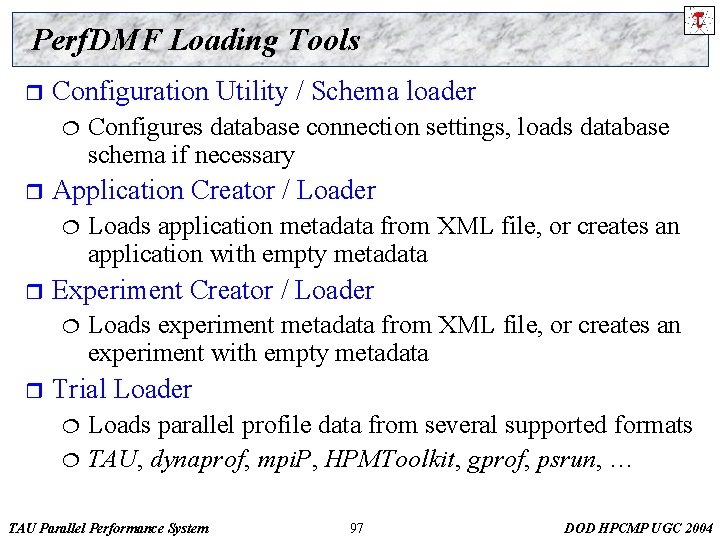
Perf. DMF Loading Tools r Configuration Utility / Schema loader ¦ r Application Creator / Loader ¦ r Loads application metadata from XML file, or creates an application with empty metadata Experiment Creator / Loader ¦ r Configures database connection settings, loads database schema if necessary Loads experiment metadata from XML file, or creates an experiment with empty metadata Trial Loader Loads parallel profile data from several supported formats ¦ TAU, dynaprof, mpi. P, HPMToolkit, gprof, psrun, … ¦ TAU Parallel Performance System 97 DOD HPCMP UGC 2004

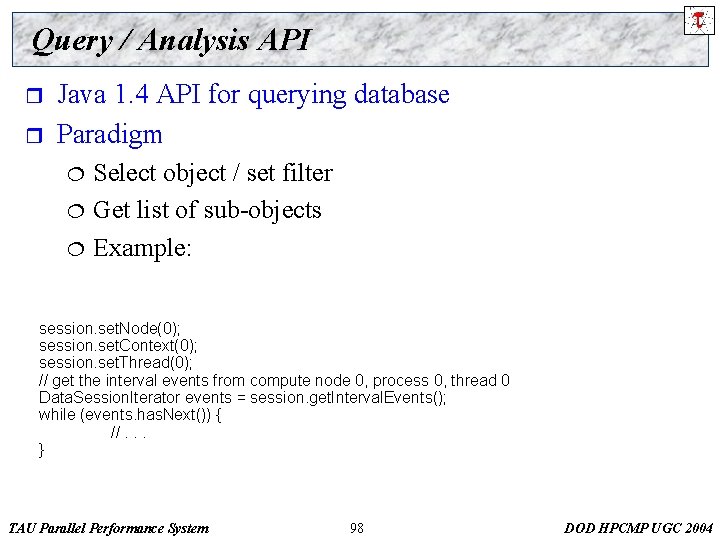
Query / Analysis API r r Java 1. 4 API for querying database Paradigm ¦ ¦ ¦ Select object / set filter Get list of sub-objects Example: session. set. Node(0); session. set. Context(0); session. set. Thread(0); // get the interval events from compute node 0, process 0, thread 0 Data. Session. Iterator events = session. get. Interval. Events(); while (events. has. Next()) { //. . . } TAU Parallel Performance System 98 DOD HPCMP UGC 2004

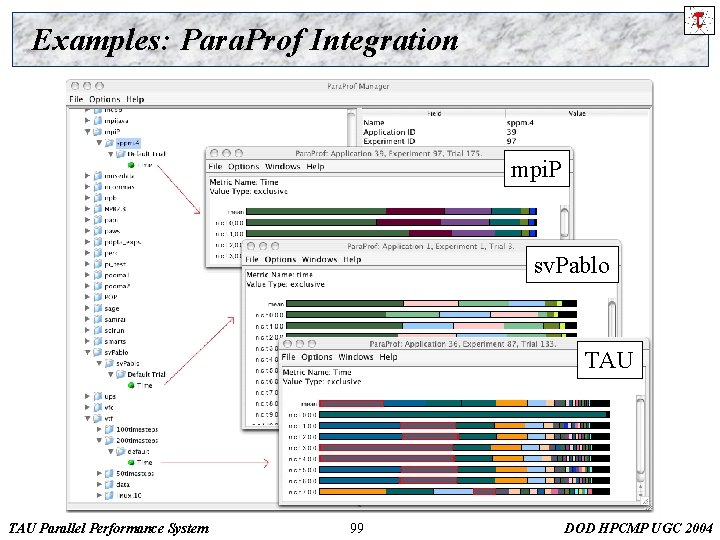
Examples: Para. Prof Integration mpi. P sv. Pablo TAU Parallel Performance System 99 DOD HPCMP UGC 2004

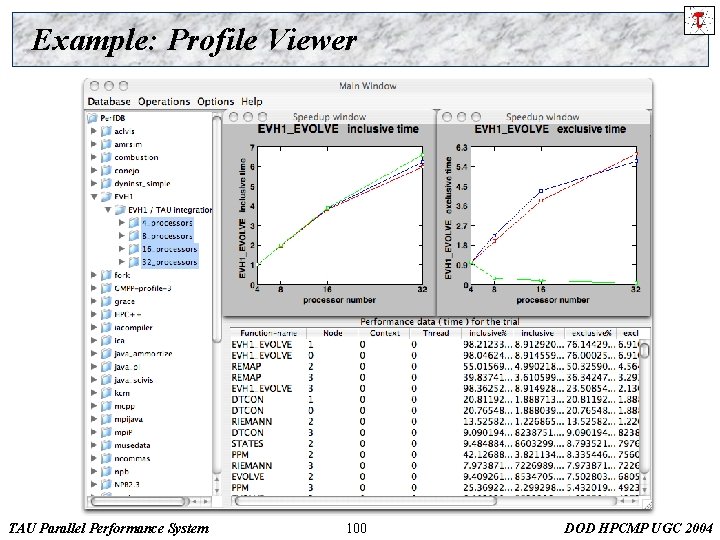
Example: Profile Viewer TAU Parallel Performance System 100 DOD HPCMP UGC 2004

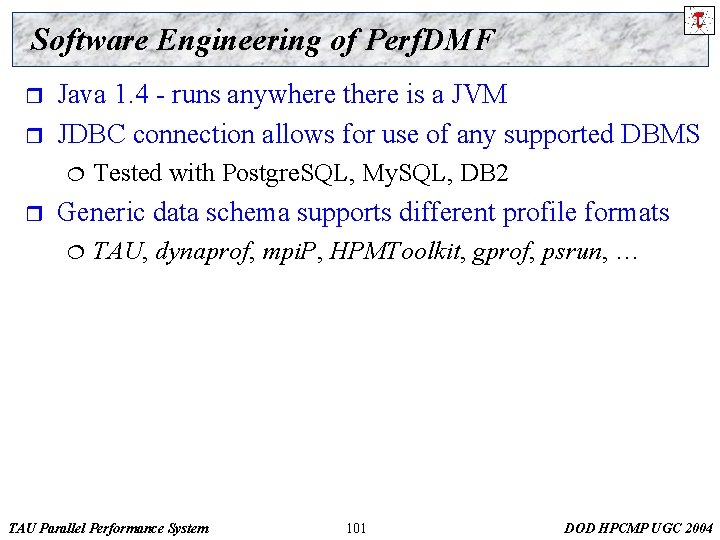
Software Engineering of Perf. DMF r r Java 1. 4 - runs anywhere there is a JVM JDBC connection allows for use of any supported DBMS ¦ r Tested with Postgre. SQL, My. SQL, DB 2 Generic data schema supports different profile formats ¦ TAU, dynaprof, mpi. P, HPMToolkit, gprof, psrun, … TAU Parallel Performance System 101 DOD HPCMP UGC 2004

Perf. DMF Future Work r Short term ¦ ¦ r Integration with CUBE Integration with PPerf. DB/PPerf. Xchange Support more profile formats Application of data mining operations on large parallel datasets (over 1000 threads of execution). Long term ¦ ¦ Performance profile data and analysis servers Shared performance repositories TAU Parallel Performance System 102 DOD HPCMP UGC 2004

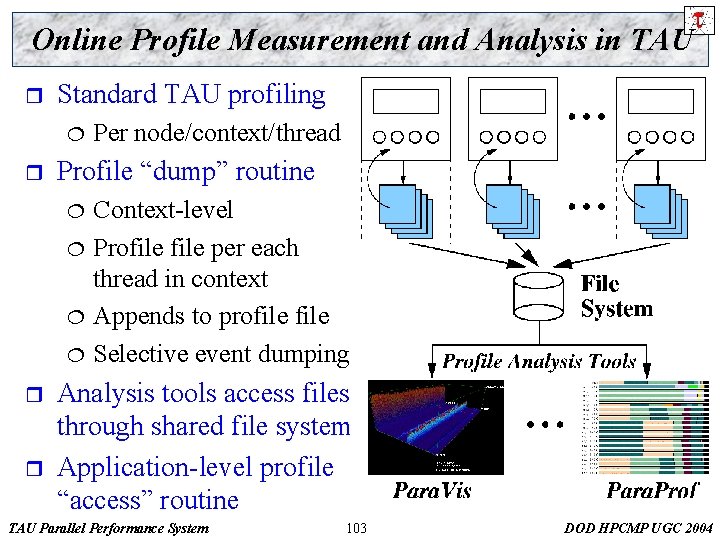
Online Profile Measurement and Analysis in TAU r Standard TAU profiling ¦ r Profile “dump” routine ¦ ¦ r r Per node/context/thread Context-level Profile per each thread in context Appends to profile Selective event dumping Analysis tools access files through shared file system Application-level profile “access” routine TAU Parallel Performance System 103 DOD HPCMP UGC 2004

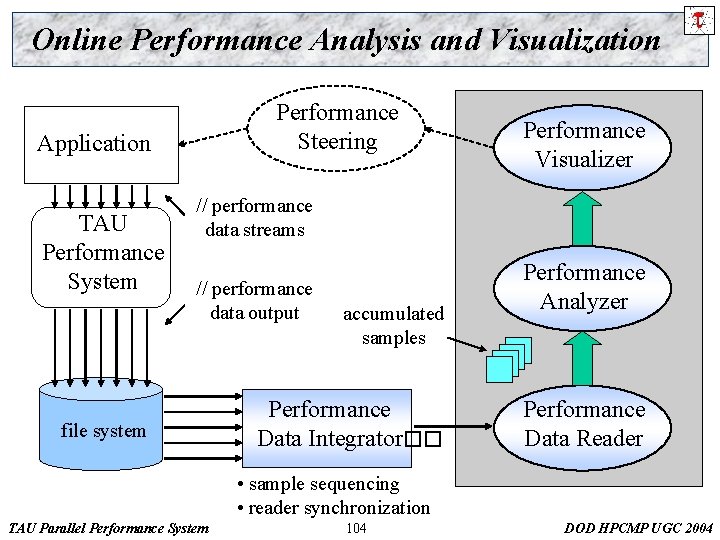
Online Performance Analysis and Visualization Performance Steering Application TAU Performance System Performance Visualizer // performance data streams // performance data output file system accumulated samples Performance Data Integrator�� Performance Analyzer Performance Data Reader • sample sequencing • reader synchronization TAU Parallel Performance System 104 DOD HPCMP UGC 2004

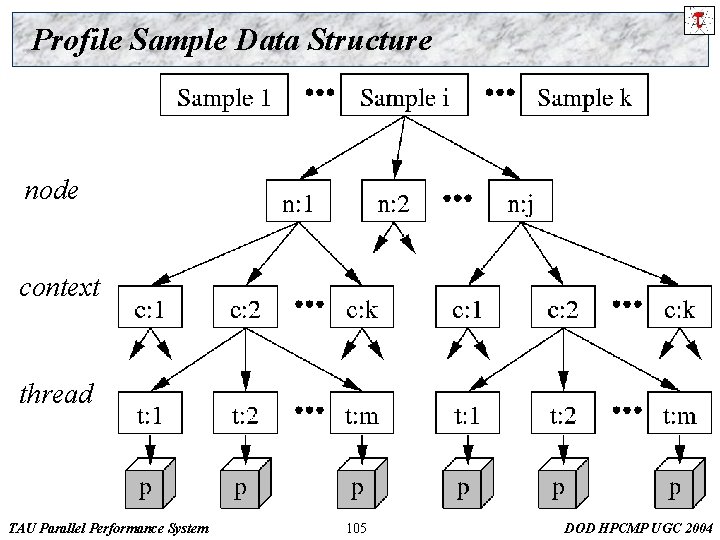
Profile Sample Data Structure node context thread TAU Parallel Performance System 105 DOD HPCMP UGC 2004

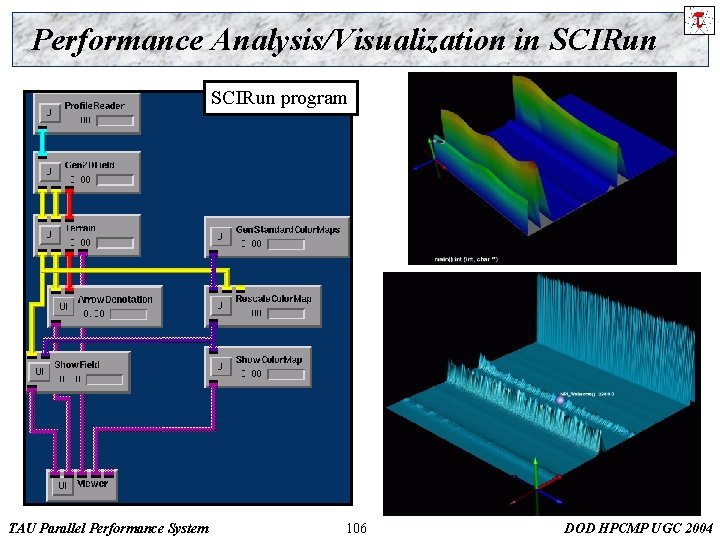
Performance Analysis/Visualization in SCIRun program TAU Parallel Performance System 106 DOD HPCMP UGC 2004

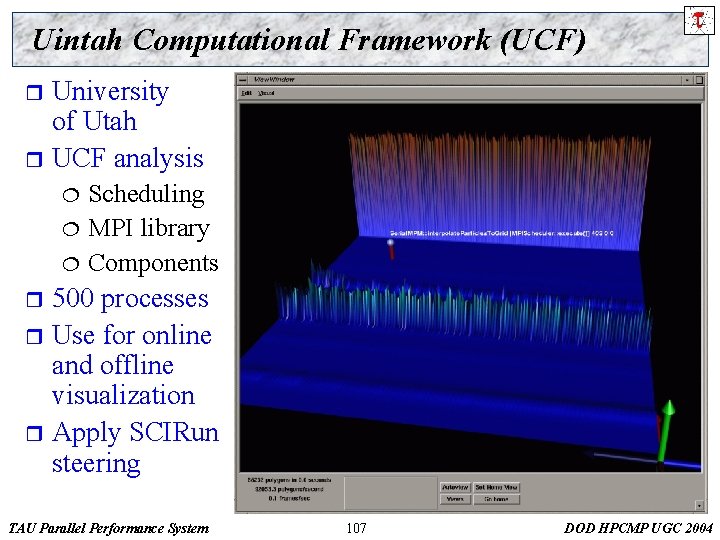
Uintah Computational Framework (UCF) University of Utah r UCF analysis r Scheduling ¦ MPI library ¦ Components ¦ 500 processes r Use for online and offline visualization r Apply SCIRun steering r TAU Parallel Performance System 107 DOD HPCMP UGC 2004

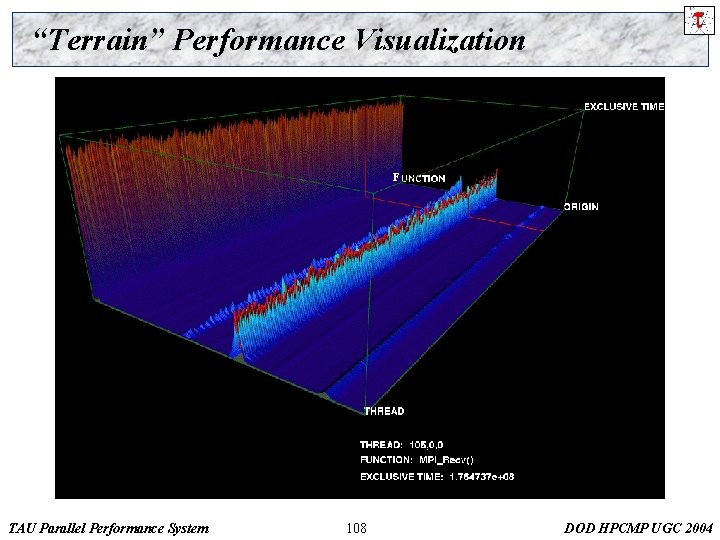
“Terrain” Performance Visualization F TAU Parallel Performance System 108 DOD HPCMP UGC 2004

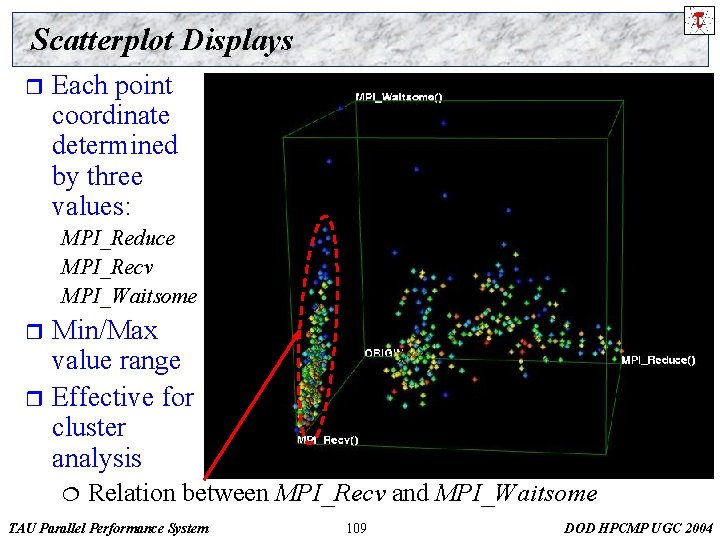
Scatterplot Displays r Each point coordinate determined by three values: MPI_Reduce MPI_Recv MPI_Waitsome Min/Max value range r Effective for cluster analysis r ¦ Relation between MPI_Recv and MPI_Waitsome TAU Parallel Performance System 109 DOD HPCMP UGC 2004

Online Unitah Performance Profiling r r Demonstration of online profiling capability Colliding elastic disks ¦ ¦ r Example 1 (Terrain visualization) ¦ ¦ r Exclusive execution time across event groups Multiple time steps Example 2 (Bargraph visualization) ¦ r Test material point method (MPM) code Executed on 512 processors ASCI Blue Pacific at LLNL MPI execution time and performance mapping Example 3 (Domain visualization) ¦ Task time allocation to “patches” TAU Parallel Performance System 110 DOD HPCMP UGC 2004

Example 1 (Event Groups) TAU Parallel Performance System 111 DOD HPCMP UGC 2004

Example 2 (MPI Performance) TAU Parallel Performance System 112 DOD HPCMP UGC 2004

Example 3 (Domain-Specific Visualization) TAU Parallel Performance System 113 DOD HPCMP UGC 2004

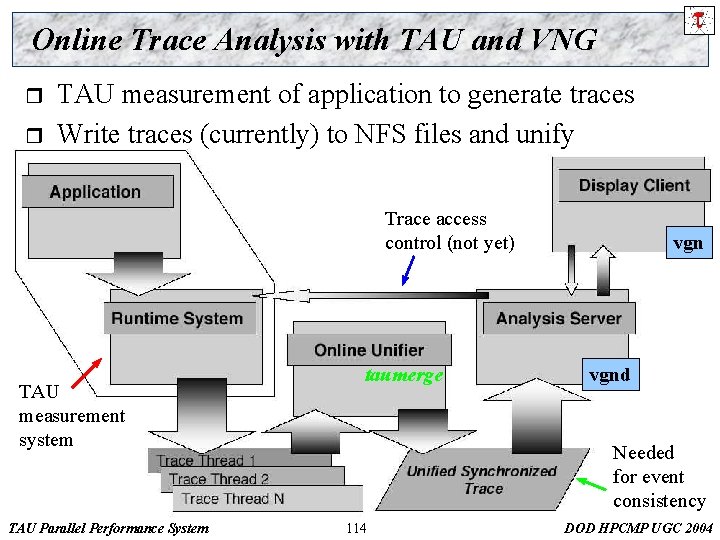
Online Trace Analysis with TAU and VNG r r TAU measurement of application to generate traces Write traces (currently) to NFS files and unify Trace access control (not yet) TAU measurement system TAU Parallel Performance System taumerge vgnd Needed for event consistency 114 DOD HPCMP UGC 2004

Integrated Performance Evaluation Environment TAU Parallel Performance System 115 DOD HPCMP UGC 2004