Python Performance Evaluation with the TAU Performance System
- Slides: 99

Python Performance Evaluation with the TAU Performance System John C. Linford, Sameer Shende, Allen Malony {jlinford, sameer, malony}@paratools. com Para. Tools, Inc. 2 July 2015, EMi. T’ 15 www. paratools. com/emit 15/TAU

Tutorial Overview • Performance optimization of Python applications • We will cover: – Profiling and debugging via the TAU Performance System – Performance analysis of Python, C/C++, Fortran – Python+X analysis – MPI and/or Open. MP analysis – Memory debugging – Hardware performance counters (PAPI) EMIT’ 15, Copyright © Para. Tools, Inc. 2

Schedule • The TAU Performance System from 10, 000 feet • Live demonstration of TAU + Python • Hands-on TAU with: – Simple pure Python – Python + X – Let’s build a CTM… • With Ipython! EMIT’ 15, Copyright © Para. Tools, Inc. 3

Python Performance Evaluation THE TAU PERFORMANCE SYSTEM EMIT’ 15, Copyright © Para. Tools, Inc. 4

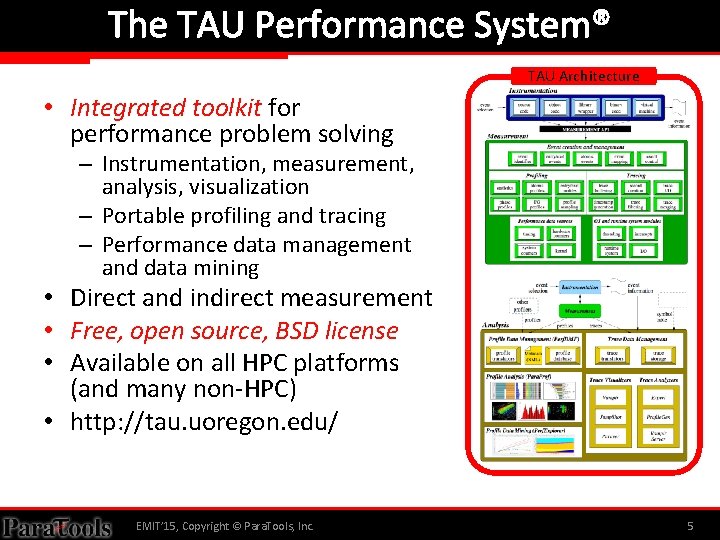
The TAU Performance System® TAU Architecture • Integrated toolkit for performance problem solving – Instrumentation, measurement, analysis, visualization – Portable profiling and tracing – Performance data management and data mining • Direct and indirect measurement • Free, open source, BSD license • Available on all HPC platforms (and many non-HPC) • http: //tau. uoregon. edu/ EMIT’ 15, Copyright © Para. Tools, Inc. 5

The TAU Performance System® • Tuning and Analysis Utilities (20+ year project) • Comprehensive performance profiling and tracing – Integrated, scalable, flexible, portable – Targets all parallel programming/execution paradigms • Integrated performance toolkit – – Instrumentation, measurement, analysis, visualization Widely-ported performance profiling / tracing system Performance data management and data mining Open source (BSD-style license) • Integrates with application frameworks EMIT’ 15, Copyright © Para. Tools, Inc. 6

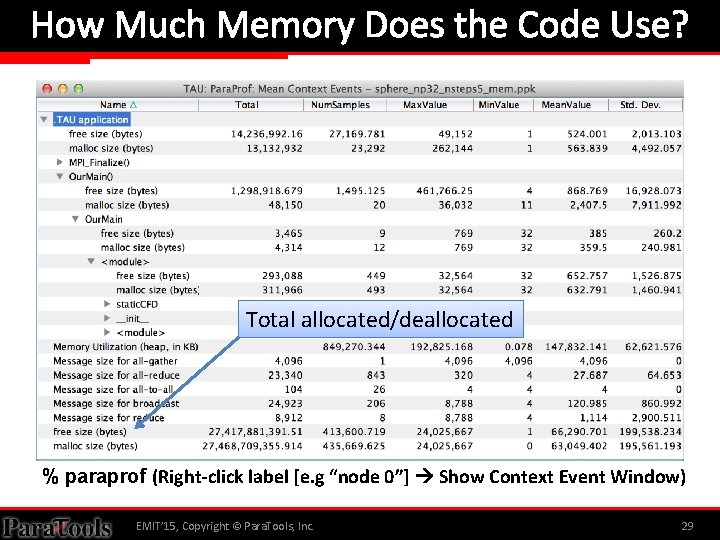
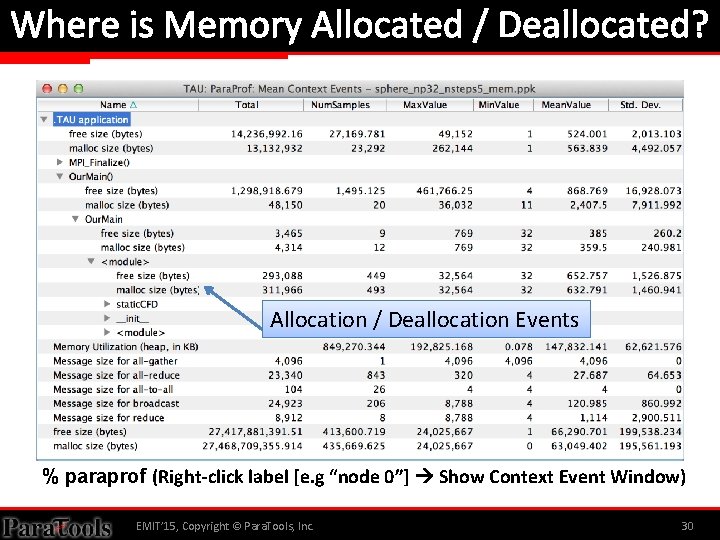
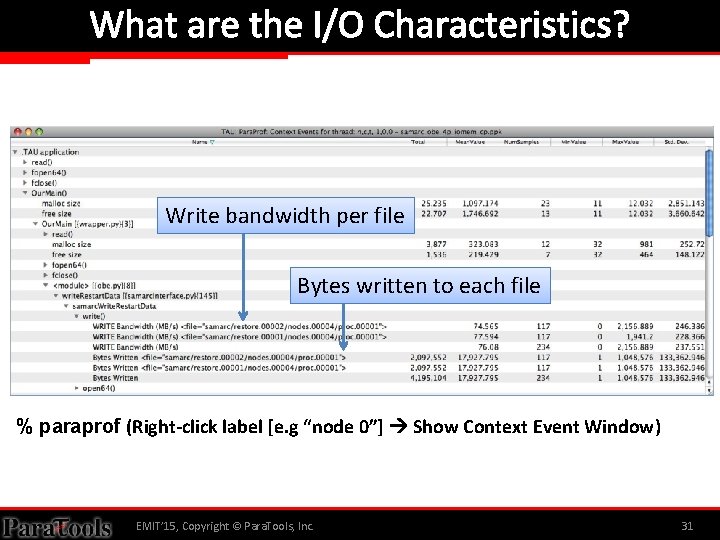
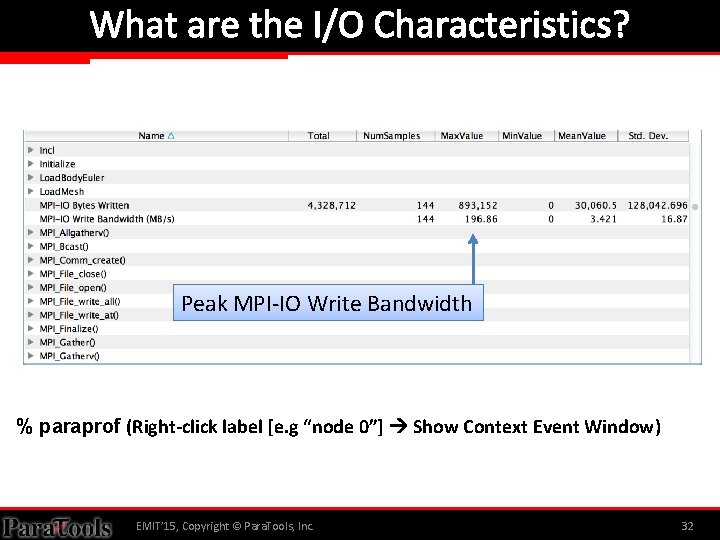
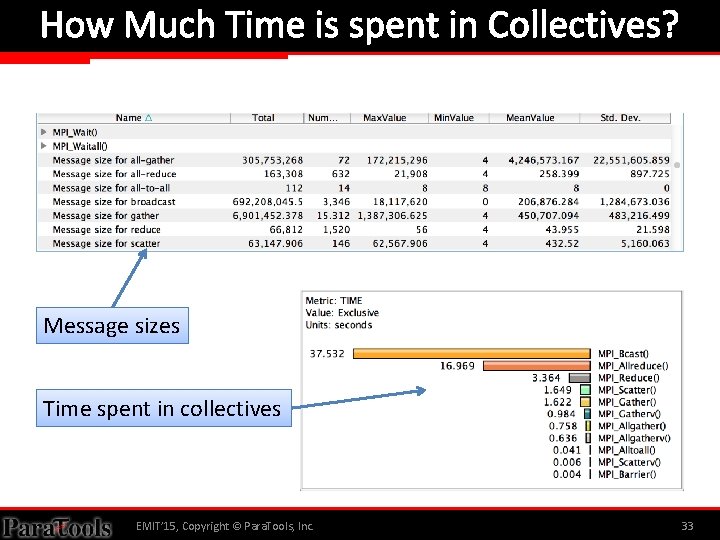
Questions TAU Can Answer • How much time is spent in each application routine and outer loops? Within loops, what is the contribution of each statement? • How many instructions are executed in these code regions? Floating point, Level 1 and 2 data cache misses, hits, branches taken, vector instructions? • What is the memory usage of the code? When and where is memory allocated/de-allocated? Are there any memory leaks? • What are the I/O characteristics of the code? What is the peak read and write bandwidth of individual calls, total volume? • What is the time spent waiting for collectives? • How does the application scale? EMIT’ 15, Copyright © Para. Tools, Inc. 7

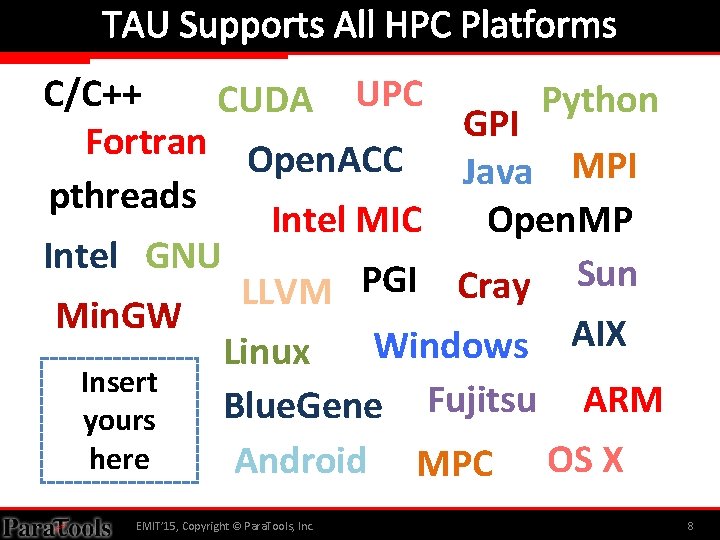
TAU Supports All HPC Platforms C/C++ CUDA UPC Python GPI Fortran Open. ACC Java MPI pthreads Intel MIC Open. MP Intel GNU Sun PGI Cray LLVM Min. GW AIX Windows Linux Insert Fujitsu ARM Blue. Gene yours here Android MPC OS X EMIT’ 15, Copyright © Para. Tools, Inc. 8

Python Performance Evaluation VOCABULARY EMIT’ 15, Copyright © Para. Tools, Inc. 9

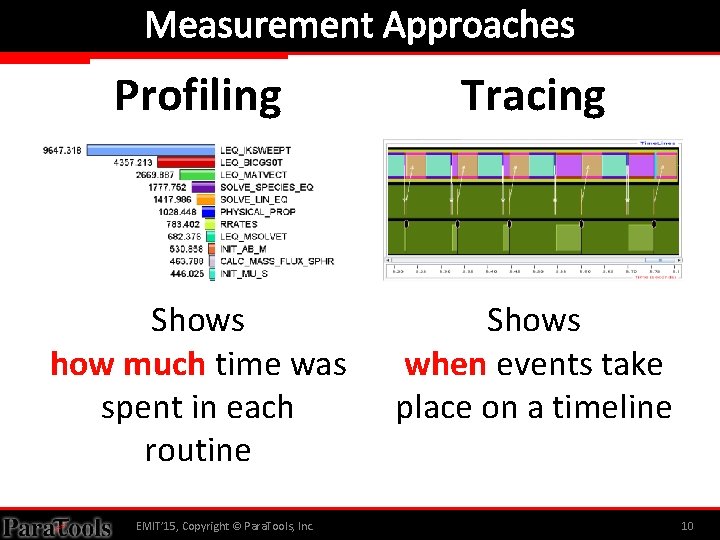
Measurement Approaches Profiling Tracing Shows how much time was spent in each routine Shows when events take place on a timeline EMIT’ 15, Copyright © Para. Tools, Inc. 10

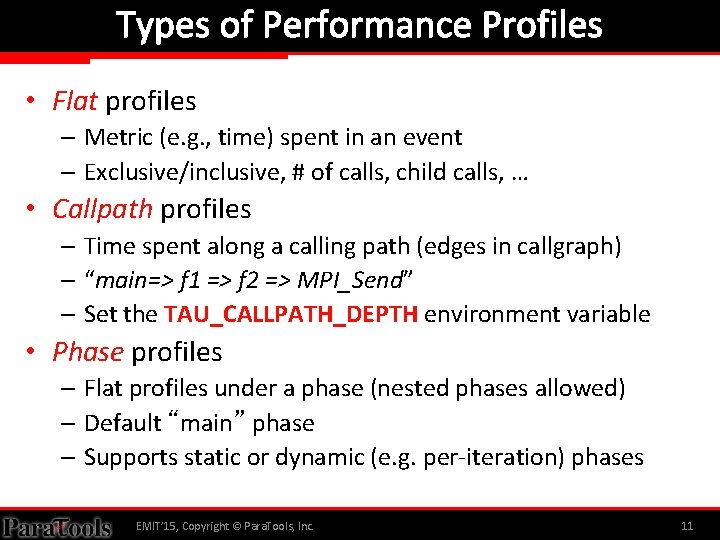
Types of Performance Profiles • Flat profiles – Metric (e. g. , time) spent in an event – Exclusive/inclusive, # of calls, child calls, … • Callpath profiles – Time spent along a calling path (edges in callgraph) – “main=> f 1 => f 2 => MPI_Send” – Set the TAU_CALLPATH_DEPTH environment variable • Phase profiles – Flat profiles under a phase (nested phases allowed) – Default “main” phase – Supports static or dynamic (e. g. per-iteration) phases EMIT’ 15, Copyright © Para. Tools, Inc. 11

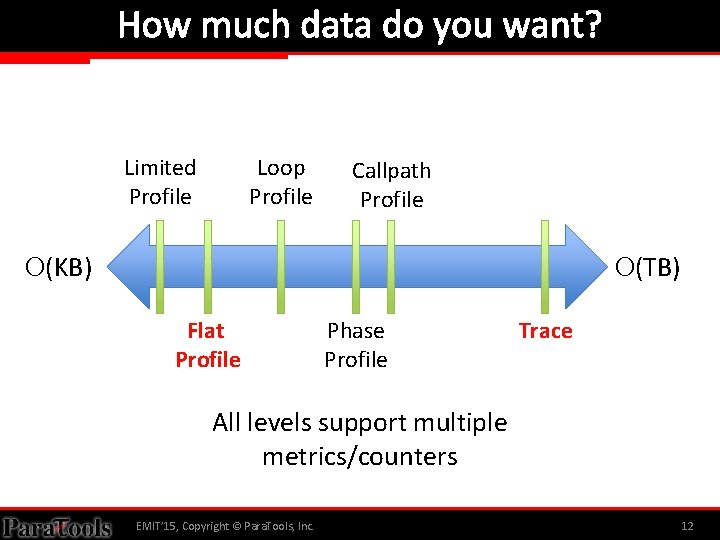
How much data do you want? Limited Profile Loop Profile Callpath Profile O(KB) O(TB) Flat Profile Phase Profile Trace All levels support multiple metrics/counters EMIT’ 15, Copyright © Para. Tools, Inc. 12

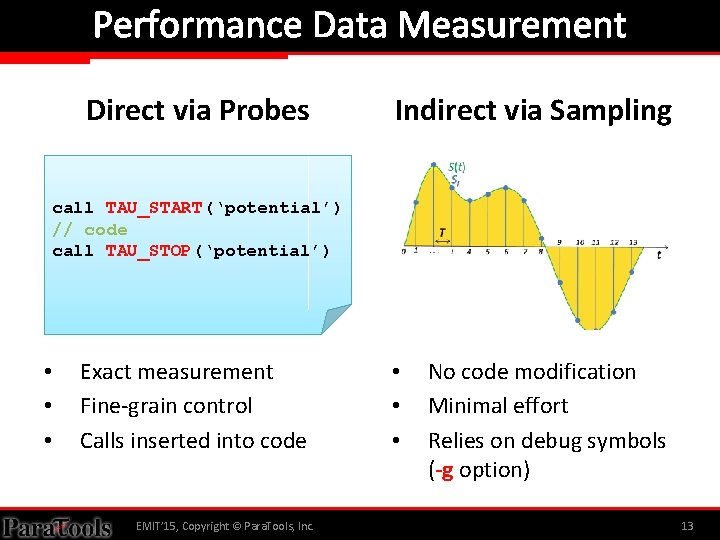
Performance Data Measurement Direct via Probes Indirect via Sampling call TAU_START(‘potential’) // code call TAU_STOP(‘potential’) • • • Exact measurement Fine-grain control Calls inserted into code EMIT’ 15, Copyright © Para. Tools, Inc. • • • No code modification Minimal effort Relies on debug symbols (-g option) 13

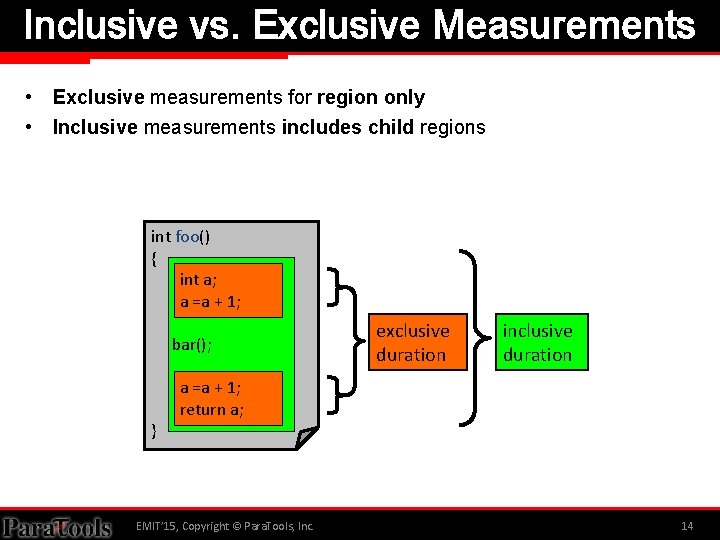
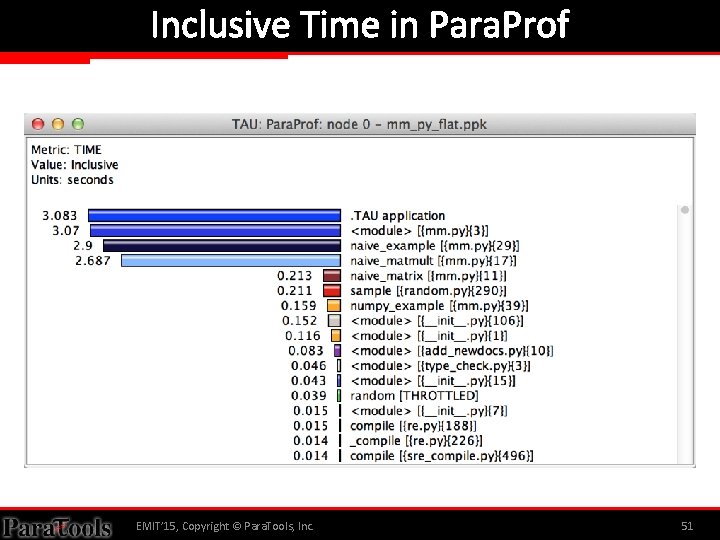
Inclusive vs. Exclusive Measurements • Exclusive measurements for region only • Inclusive measurements includes child regions int foo() { int a; a =a + 1; bar(); } exclusive duration inclusive duration a =a + 1; return a; EMIT’ 15, Copyright © Para. Tools, Inc. 14

Python Performance Evaluation PERFORMANCE ANALYSIS WORKFLOW EMIT’ 15, Copyright © Para. Tools, Inc. 15

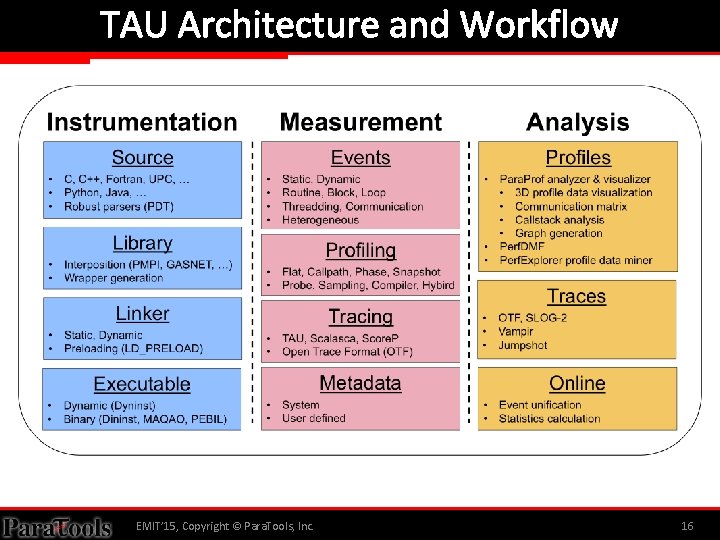
TAU Architecture and Workflow EMIT’ 15, Copyright © Para. Tools, Inc. 16

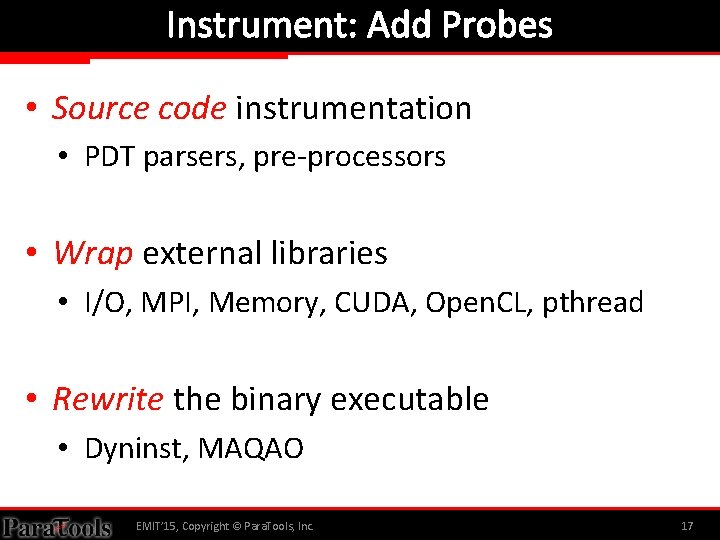
Instrument: Add Probes • Source code instrumentation • PDT parsers, pre-processors • Wrap external libraries • I/O, MPI, Memory, CUDA, Open. CL, pthread • Rewrite the binary executable • Dyninst, MAQAO EMIT’ 15, Copyright © Para. Tools, Inc. 17

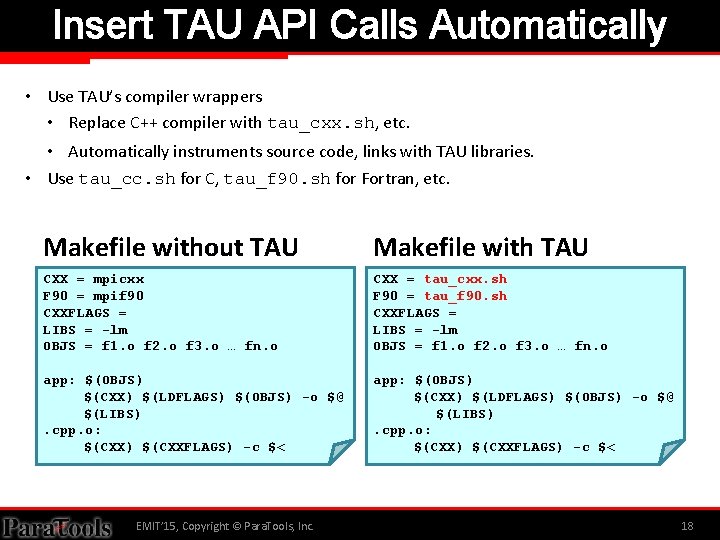
Insert TAU API Calls Automatically • Use TAU’s compiler wrappers • Replace C++ compiler with tau_cxx. sh, etc. • Automatically instruments source code, links with TAU libraries. • Use tau_cc. sh for C, tau_f 90. sh for Fortran, etc. Makefile without TAU Makefile with TAU CXX = mpicxx F 90 = mpif 90 CXXFLAGS = LIBS = -lm OBJS = f 1. o f 2. o f 3. o … fn. o CXX = tau_cxx. sh F 90 = tau_f 90. sh CXXFLAGS = LIBS = -lm OBJS = f 1. o f 2. o f 3. o … fn. o app: $(OBJS) $(CXX) $(LDFLAGS) $(OBJS) -o $@ $(LIBS). cpp. o: $(CXX) $(CXXFLAGS) -c $< EMIT’ 15, Copyright © Para. Tools, Inc. 18

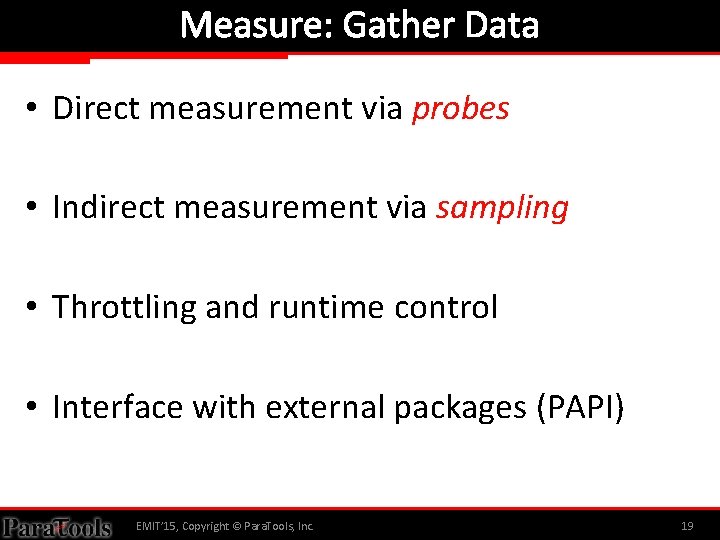
Measure: Gather Data • Direct measurement via probes • Indirect measurement via sampling • Throttling and runtime control • Interface with external packages (PAPI) EMIT’ 15, Copyright © Para. Tools, Inc. 19

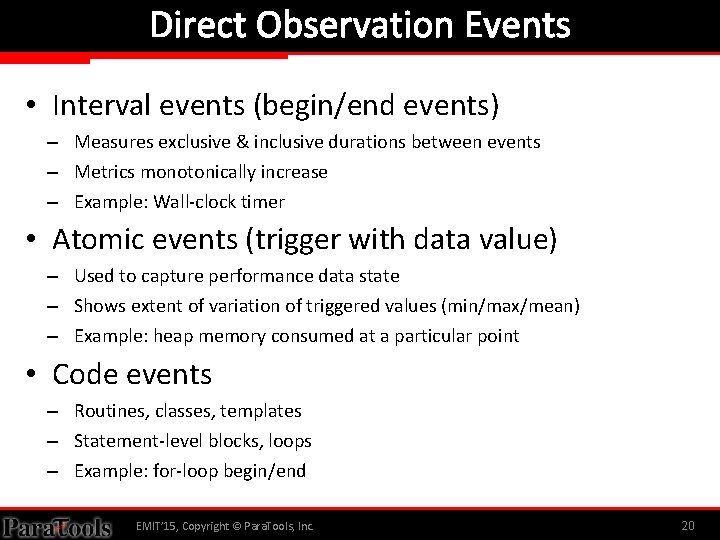
Direct Observation Events • Interval events (begin/end events) – Measures exclusive & inclusive durations between events – Metrics monotonically increase – Example: Wall-clock timer • Atomic events (trigger with data value) – Used to capture performance data state – Shows extent of variation of triggered values (min/max/mean) – Example: heap memory consumed at a particular point • Code events – Routines, classes, templates – Statement-level blocks, loops – Example: for-loop begin/end EMIT’ 15, Copyright © Para. Tools, Inc. 20

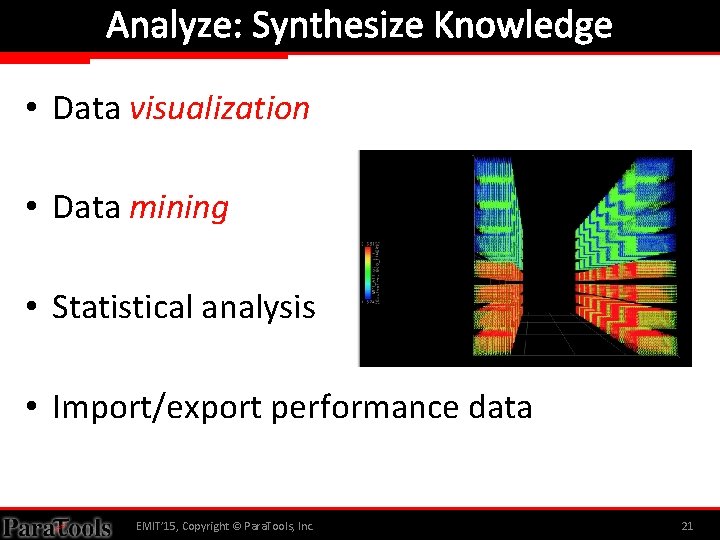
Analyze: Synthesize Knowledge • Data visualization • Data mining • Statistical analysis • Import/export performance data EMIT’ 15, Copyright © Para. Tools, Inc. 21

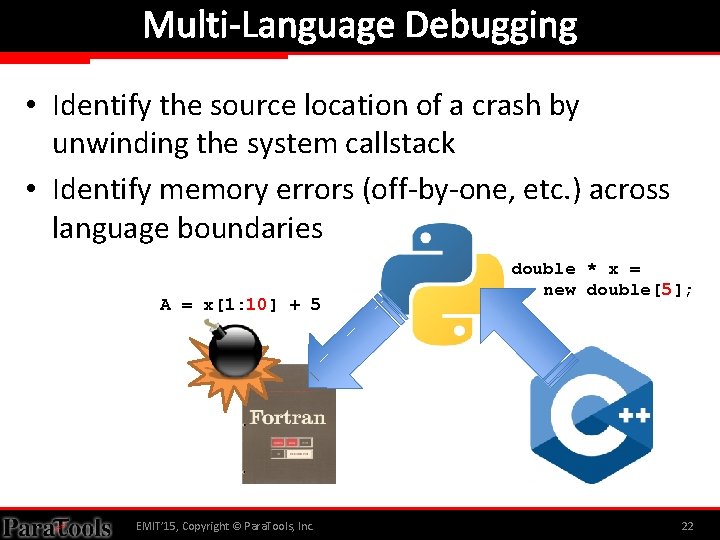
Multi-Language Debugging • Identify the source location of a crash by unwinding the system callstack • Identify memory errors (off-by-one, etc. ) across language boundaries A = x[1: 10] + 5 EMIT’ 15, Copyright © Para. Tools, Inc. double * x = new double[5]; 22

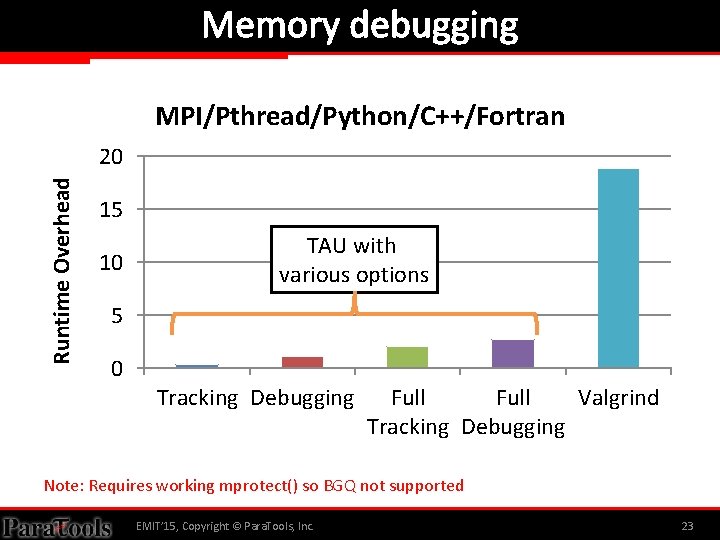
Memory debugging MPI/Pthread/Python/C++/Fortran Runtime Overhead 20 15 10 TAU with various options 5 0 Tracking Debugging Full Valgrind Tracking Debugging Note: Requires working mprotect() so BGQ not supported EMIT’ 15, Copyright © Para. Tools, Inc. 23

Python Performance Evaluation ANALYSIS EXAMPLES EMIT’ 15, Copyright © Para. Tools, Inc. 24

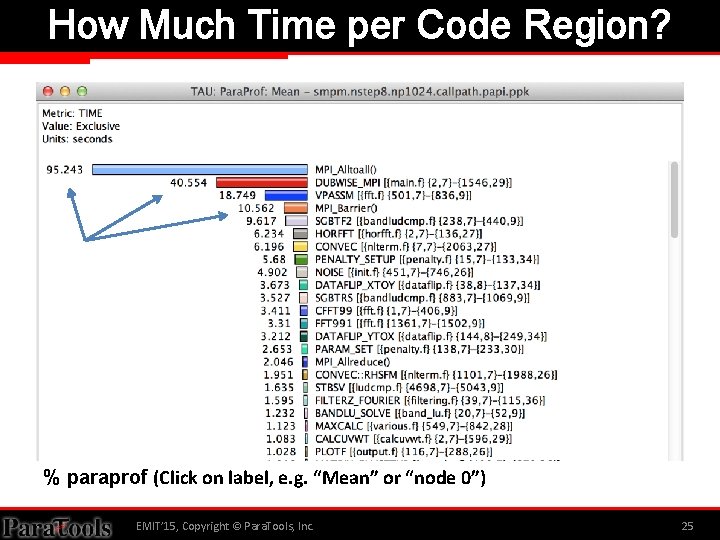
How Much Time per Code Region? % paraprof (Click on label, e. g. “Mean” or “node 0”) EMIT’ 15, Copyright © Para. Tools, Inc. 25

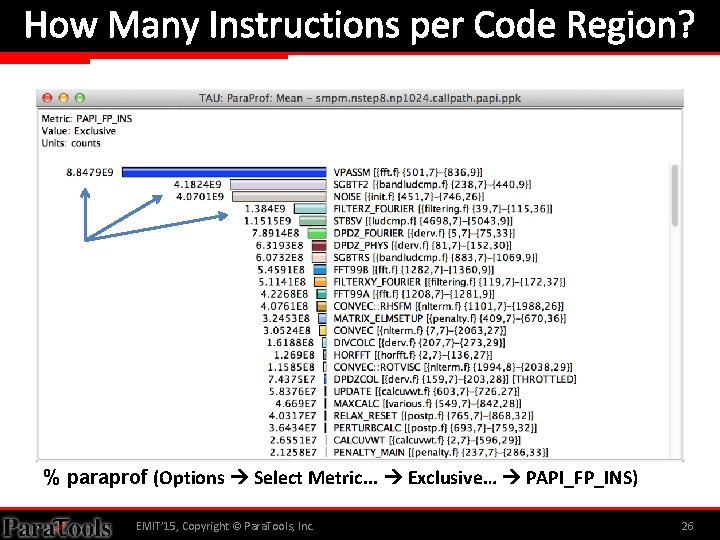
How Many Instructions per Code Region? % paraprof (Options Select Metric. . . Exclusive… PAPI_FP_INS) EMIT’ 15, Copyright © Para. Tools, Inc. 26

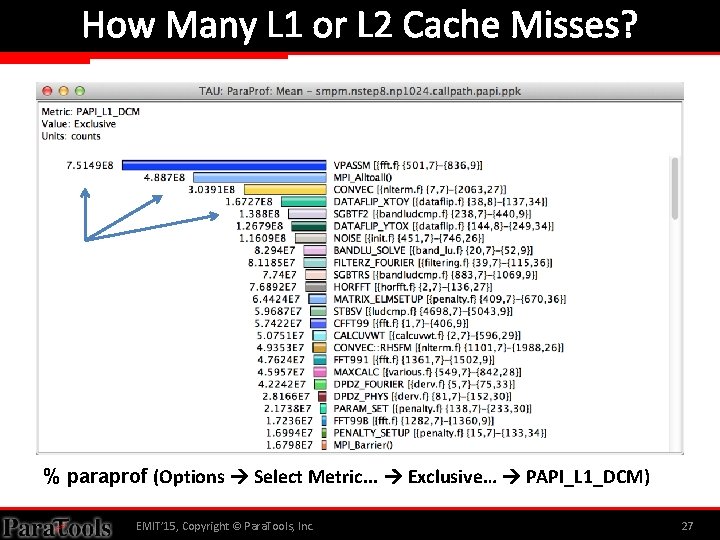
How Many L 1 or L 2 Cache Misses? % paraprof (Options Select Metric. . . Exclusive… PAPI_L 1_DCM) EMIT’ 15, Copyright © Para. Tools, Inc. 27

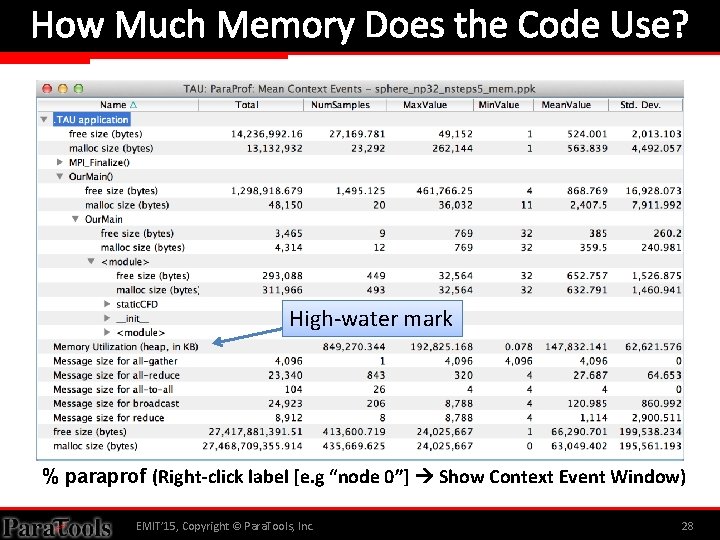
How Much Memory Does the Code Use? High-water mark % paraprof (Right-click label [e. g “node 0”] Show Context Event Window) EMIT’ 15, Copyright © Para. Tools, Inc. 28

How Much Memory Does the Code Use? Total allocated/deallocated % paraprof (Right-click label [e. g “node 0”] Show Context Event Window) EMIT’ 15, Copyright © Para. Tools, Inc. 29

Where is Memory Allocated / Deallocated? Allocation / Deallocation Events % paraprof (Right-click label [e. g “node 0”] Show Context Event Window) EMIT’ 15, Copyright © Para. Tools, Inc. 30

What are the I/O Characteristics? Write bandwidth per file Bytes written to each file % paraprof (Right-click label [e. g “node 0”] Show Context Event Window) EMIT’ 15, Copyright © Para. Tools, Inc. 31

What are the I/O Characteristics? Peak MPI-IO Write Bandwidth % paraprof (Right-click label [e. g “node 0”] Show Context Event Window) EMIT’ 15, Copyright © Para. Tools, Inc. 32

How Much Time is spent in Collectives? Message sizes Time spent in collectives EMIT’ 15, Copyright © Para. Tools, Inc. 33

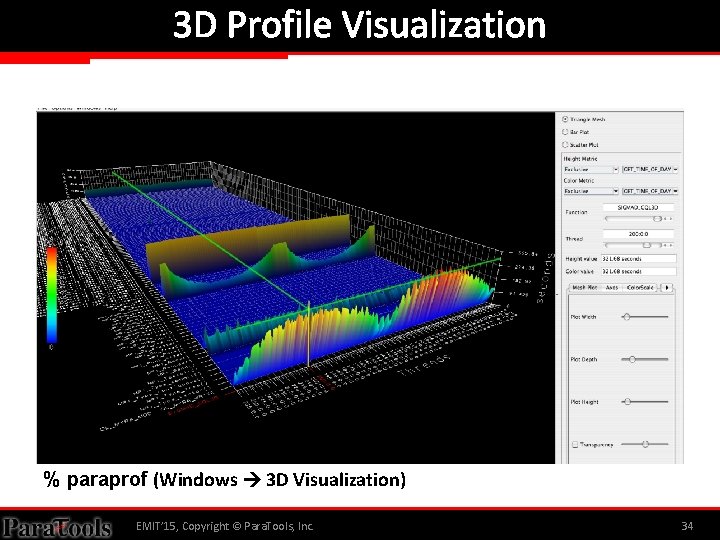
3 D Profile Visualization % paraprof (Windows 3 D Visualization) EMIT’ 15, Copyright © Para. Tools, Inc. 34

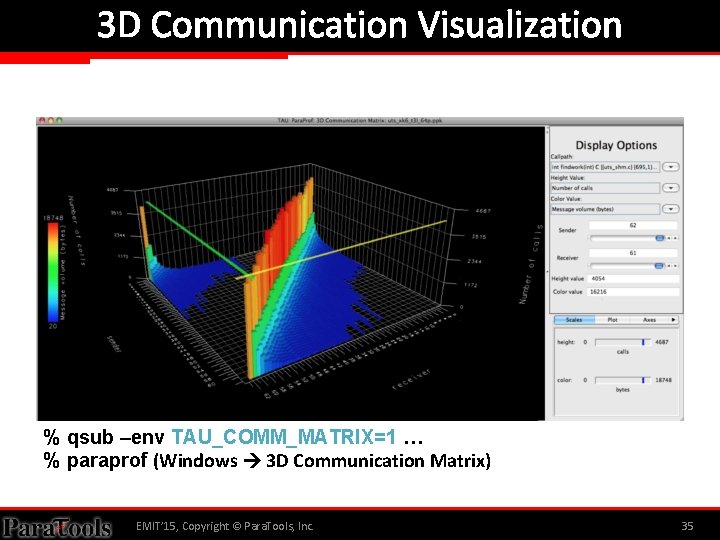
3 D Communication Visualization % qsub –env TAU_COMM_MATRIX=1 … % paraprof (Windows 3 D Communication Matrix) EMIT’ 15, Copyright © Para. Tools, Inc. 35

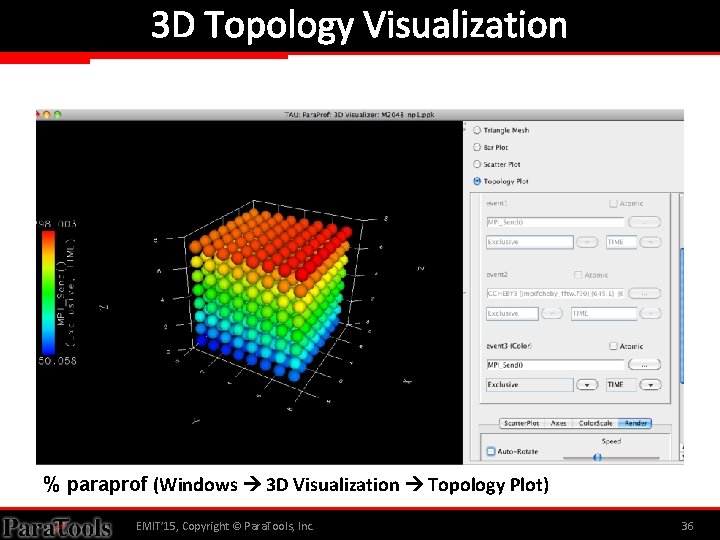
3 D Topology Visualization % paraprof (Windows 3 D Visualization Topology Plot) EMIT’ 15, Copyright © Para. Tools, Inc. 36

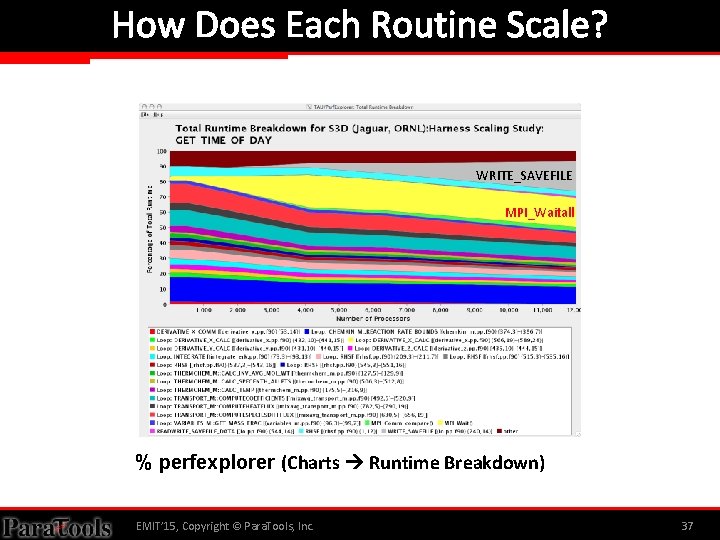
How Does Each Routine Scale? WRITE_SAVEFILE MPI_Waitall % perfexplorer (Charts Runtime Breakdown) EMIT’ 15, Copyright © Para. Tools, Inc. 37

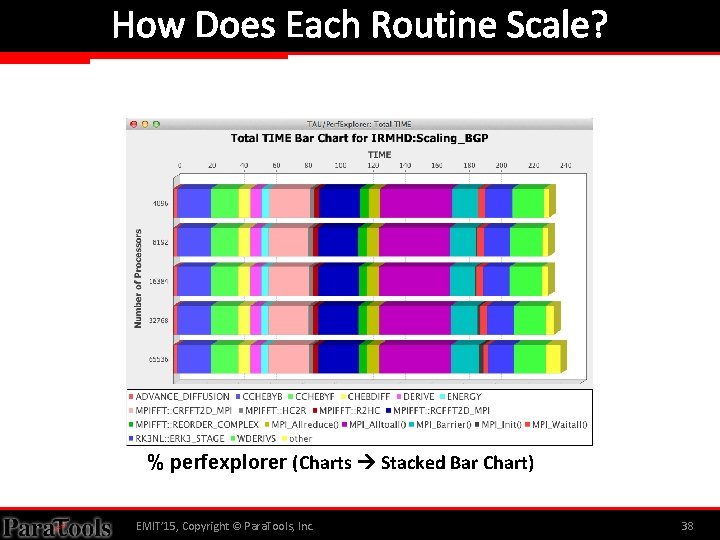
How Does Each Routine Scale? % perfexplorer (Charts Stacked Bar Chart) EMIT’ 15, Copyright © Para. Tools, Inc. 38

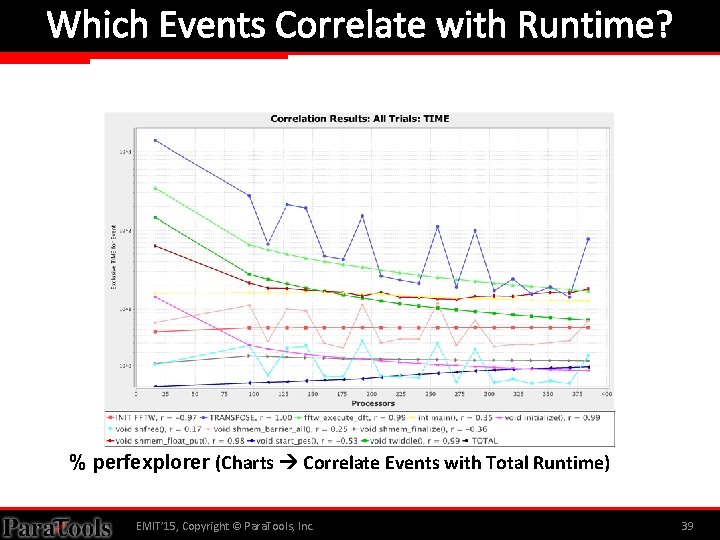
Which Events Correlate with Runtime? % perfexplorer (Charts Correlate Events with Total Runtime) EMIT’ 15, Copyright © Para. Tools, Inc. 39

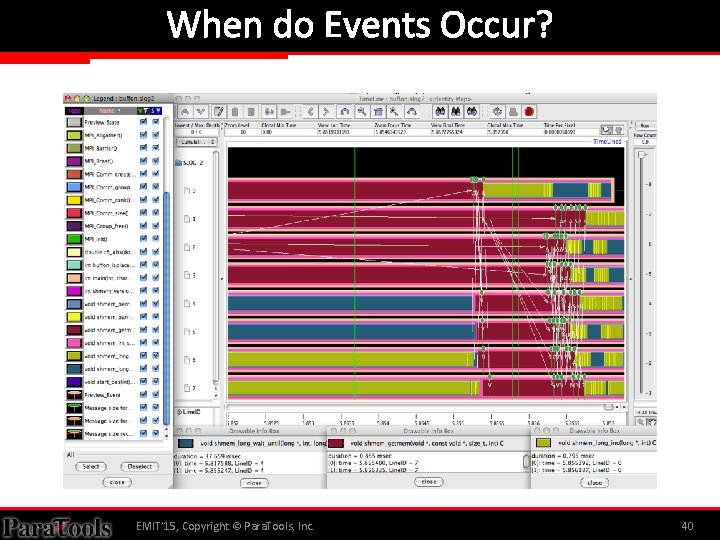
When do Events Occur? EMIT’ 15, Copyright © Para. Tools, Inc. 40

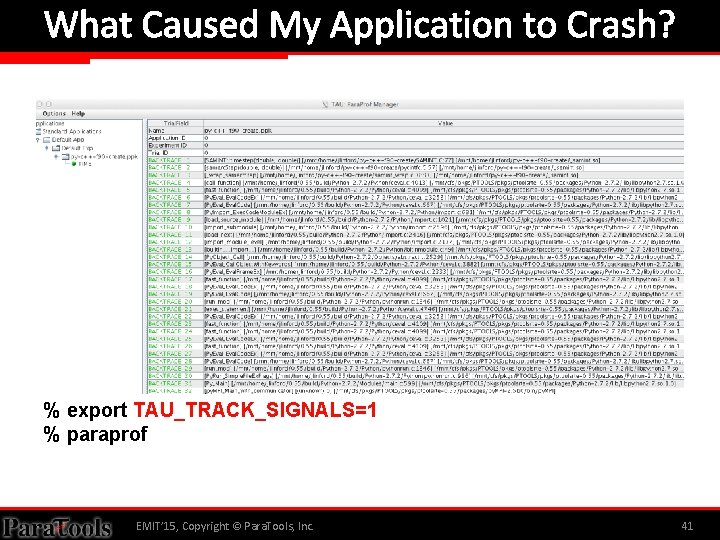
What Caused My Application to Crash? % export TAU_TRACK_SIGNALS=1 % paraprof EMIT’ 15, Copyright © Para. Tools, Inc. 41

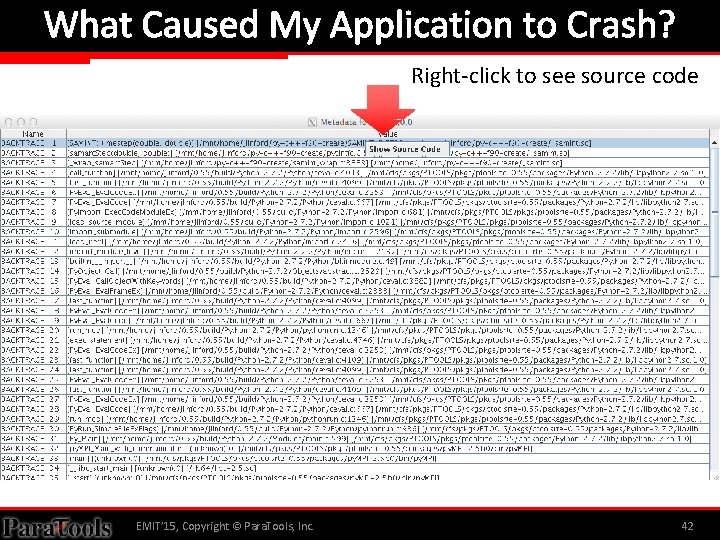
What Caused My Application to Crash? Right-click to see source code EMIT’ 15, Copyright © Para. Tools, Inc. 42

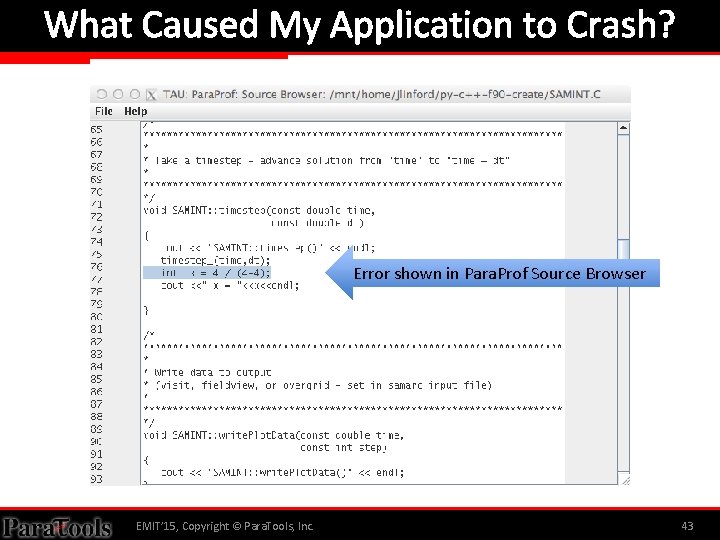
What Caused My Application to Crash? Error shown in Para. Prof Source Browser EMIT’ 15, Copyright © Para. Tools, Inc. 43

Python Performance Evaluation HANDS-ON EMIT’ 15, Copyright © Para. Tools, Inc. 44

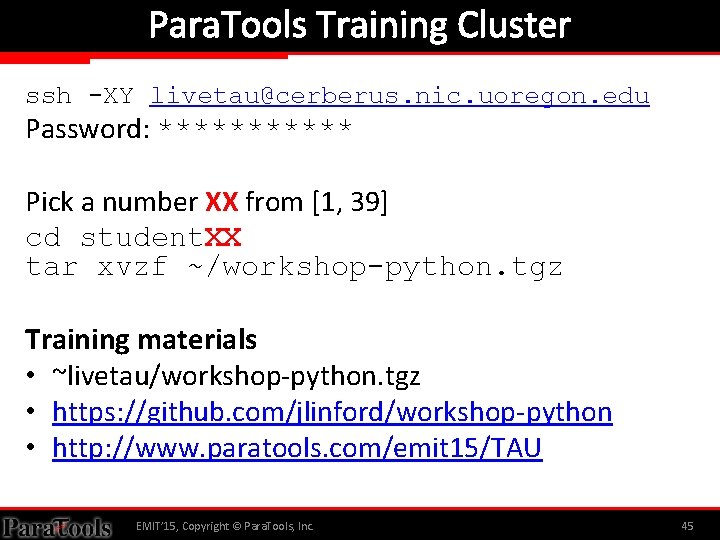
Para. Tools Training Cluster ssh -XY livetau@cerberus. nic. uoregon. edu Password: ****** Pick a number XX from [1, 39] cd student. XX tar xvzf ~/workshop-python. tgz Training materials • ~livetau/workshop-python. tgz • https: //github. com/jlinford/workshop-python • http: //www. paratools. com/emit 15/TAU EMIT’ 15, Copyright © Para. Tools, Inc. 45

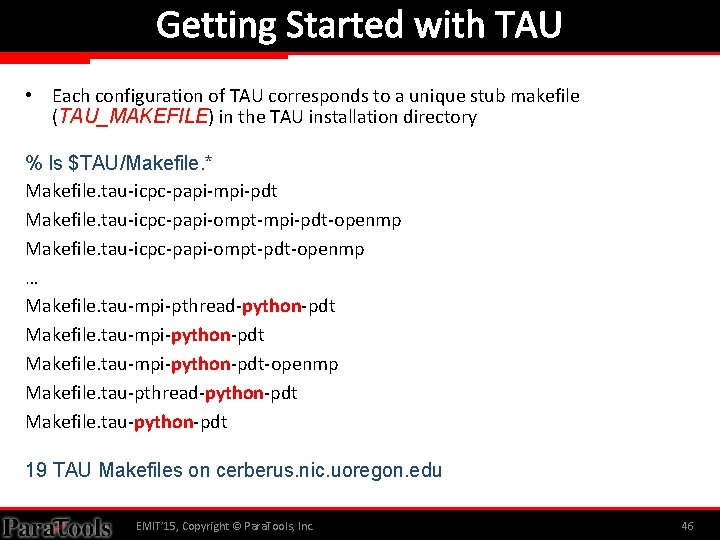
Getting Started with TAU • Each configuration of TAU corresponds to a unique stub makefile (TAU_MAKEFILE) in the TAU installation directory % ls $TAU/Makefile. * Makefile. tau-icpc-papi-mpi-pdt Makefile. tau-icpc-papi-ompt-mpi-pdt-openmp Makefile. tau-icpc-papi-ompt-pdt-openmp … Makefile. tau-mpi-pthread-python-pdt Makefile. tau-mpi-python-pdt-openmp Makefile. tau-pthread-python-pdt Makefile. tau-python-pdt 19 TAU Makefiles on cerberus. nic. uoregon. edu EMIT’ 15, Copyright © Para. Tools, Inc. 46

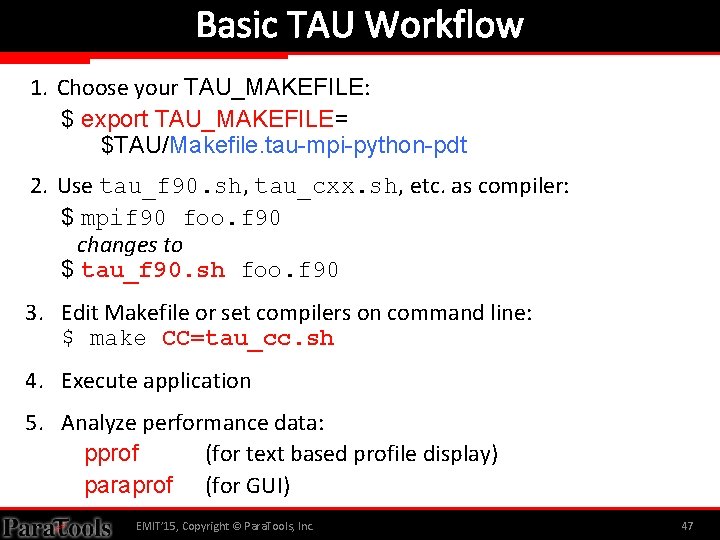
Basic TAU Workflow 1. Choose your TAU_MAKEFILE: $ export TAU_MAKEFILE= $TAU/Makefile. tau-mpi-python-pdt 2. Use tau_f 90. sh, tau_cxx. sh, etc. as compiler: $ mpif 90 foo. f 90 changes to $ tau_f 90. sh foo. f 90 3. Edit Makefile or set compilers on command line: $ make CC=tau_cc. sh 4. Execute application 5. Analyze performance data: pprof (for text based profile display) paraprof (for GUI) EMIT’ 15, Copyright © Para. Tools, Inc. 47

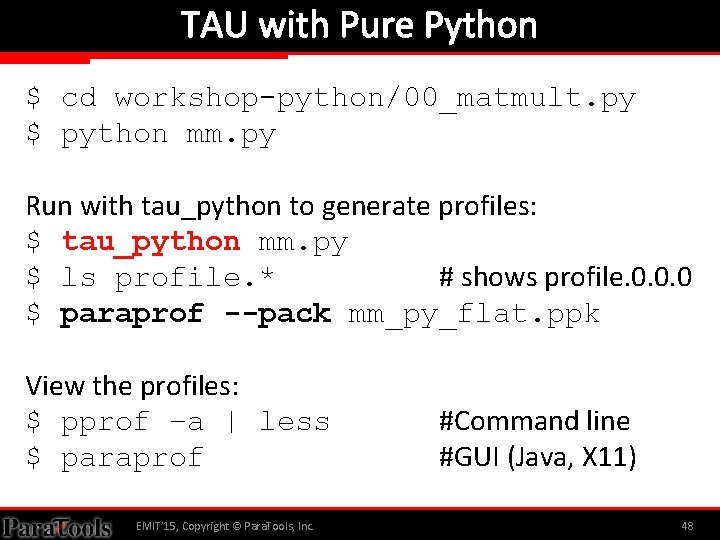
TAU with Pure Python $ cd workshop-python/00_matmult. py $ python mm. py Run with tau_python to generate profiles: $ tau_python mm. py $ ls profile. * # shows profile. 0. 0. 0 $ paraprof --pack mm_py_flat. ppk View the profiles: $ pprof –a | less $ paraprof EMIT’ 15, Copyright © Para. Tools, Inc. #Command line #GUI (Java, X 11) 48

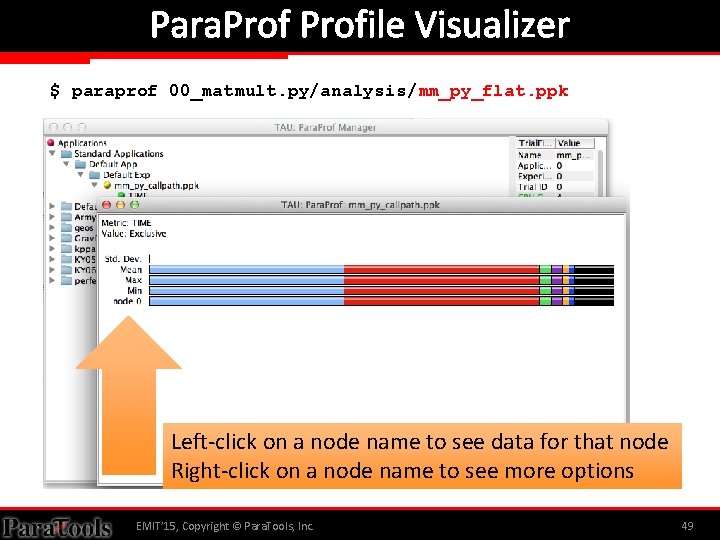
Para. Profile Visualizer $ paraprof 00_matmult. py/analysis/mm_py_flat. ppk Left-click on a node name to see data for that node Right-click on a node name to see more options EMIT’ 15, Copyright © Para. Tools, Inc. 49

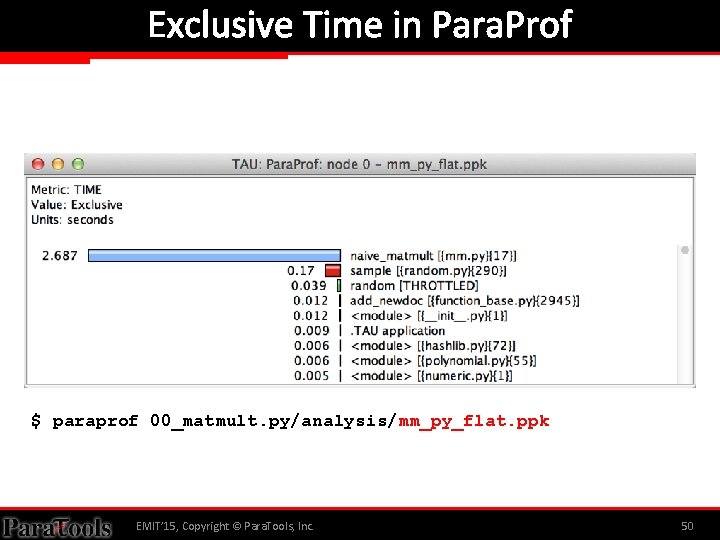
Exclusive Time in Para. Prof $ paraprof 00_matmult. py/analysis/mm_py_flat. ppk EMIT’ 15, Copyright © Para. Tools, Inc. 50

Inclusive Time in Para. Prof EMIT’ 15, Copyright © Para. Tools, Inc. 51

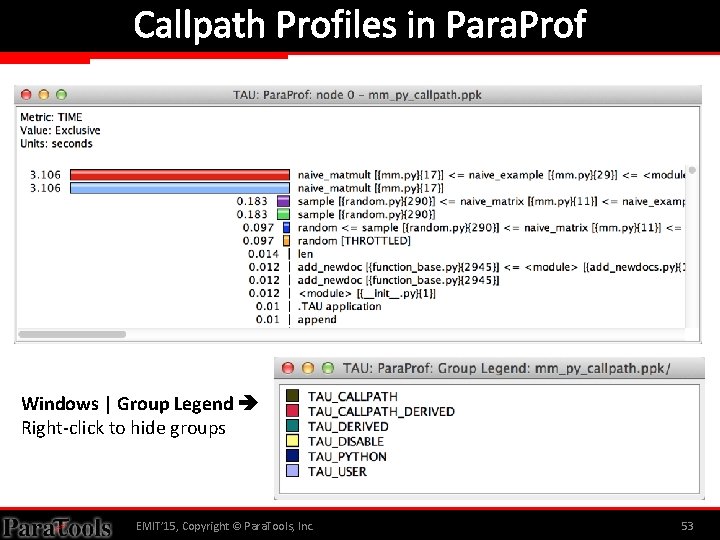
Callpath Profiles with Pure Python For callpath profiles: $ export TAU_CALLPATH=1 $ export TAU_CALLPATH_DEPTH=10 $ tau_python mm. py TAU_CALLPATH_DEPTH controls the depth of the recorded callpath. “ 10” is usually more than enough. EMIT’ 15, Copyright © Para. Tools, Inc. 52

Callpath Profiles in Para. Prof Windows | Group Legend Right-click to hide groups EMIT’ 15, Copyright © Para. Tools, Inc. 53

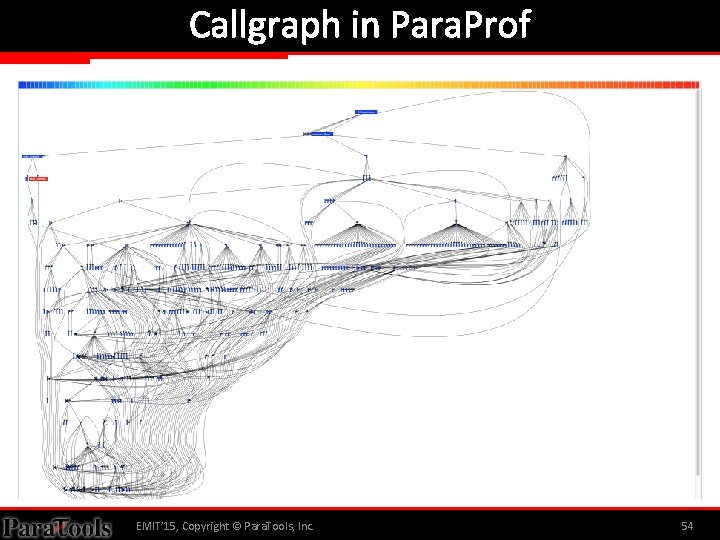
Callgraph in Para. Prof EMIT’ 15, Copyright © Para. Tools, Inc. 54

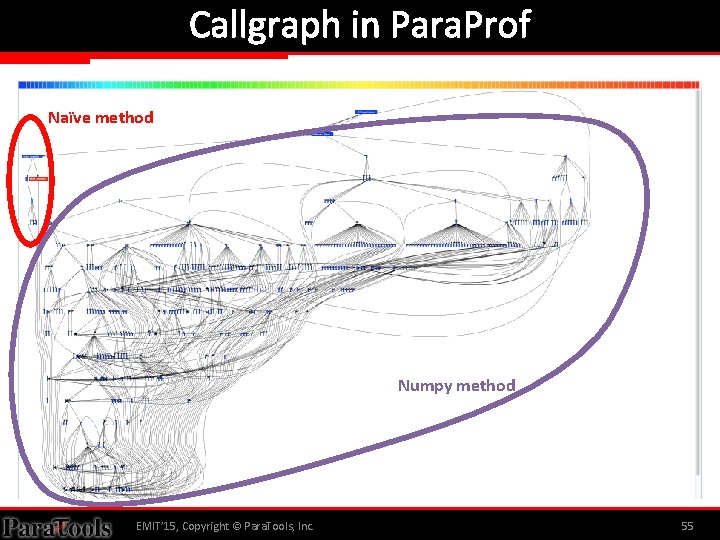
Callgraph in Para. Prof Naïve method Numpy method EMIT’ 15, Copyright © Para. Tools, Inc. 55

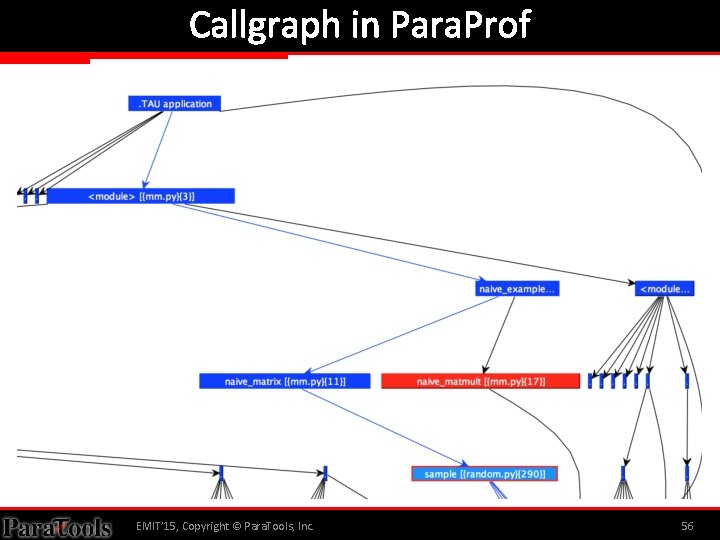
Callgraph in Para. Prof EMIT’ 15, Copyright © Para. Tools, Inc. 56

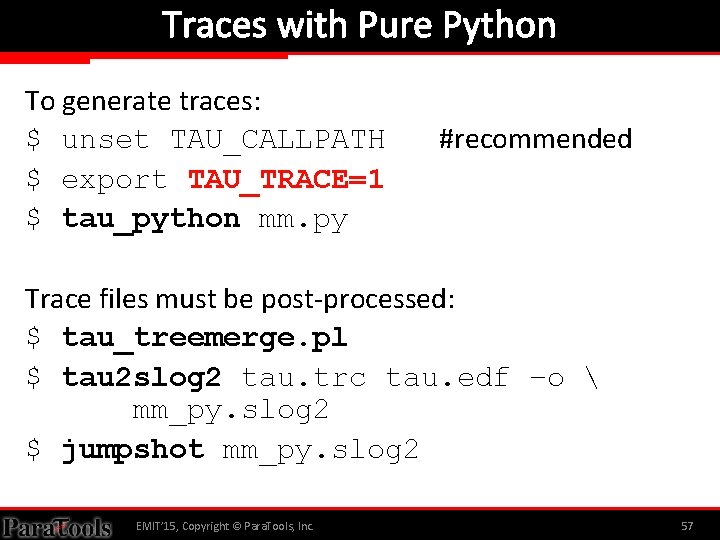
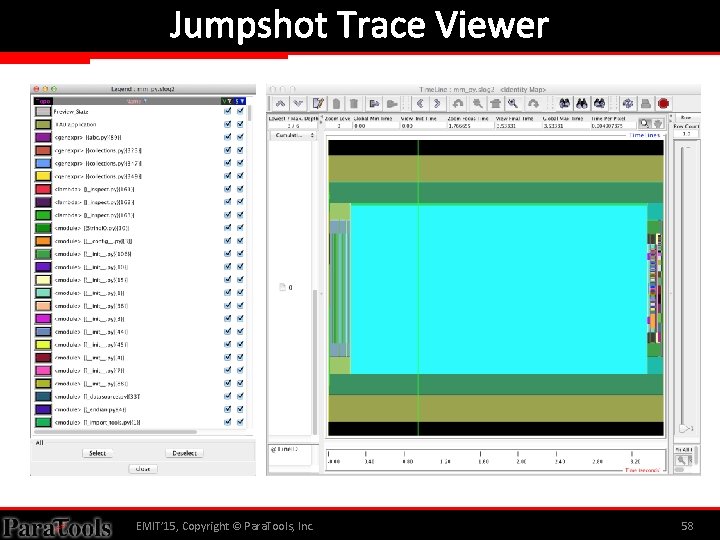
Traces with Pure Python To generate traces: $ unset TAU_CALLPATH $ export TAU_TRACE=1 $ tau_python mm. py #recommended Trace files must be post-processed: $ tau_treemerge. pl $ tau 2 slog 2 tau. trc tau. edf –o mm_py. slog 2 $ jumpshot mm_py. slog 2 EMIT’ 15, Copyright © Para. Tools, Inc. 57

Jumpshot Trace Viewer EMIT’ 15, Copyright © Para. Tools, Inc. 58

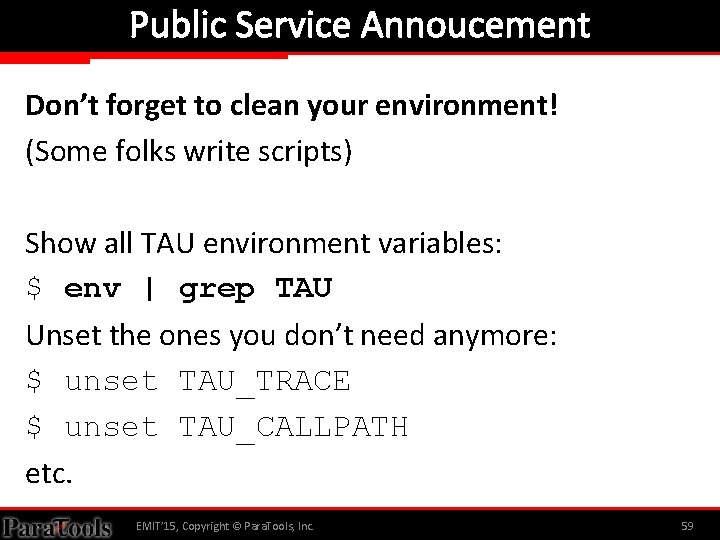
Public Service Annoucement Don’t forget to clean your environment! (Some folks write scripts) Show all TAU environment variables: $ env | grep TAU Unset the ones you don’t need anymore: $ unset TAU_TRACE $ unset TAU_CALLPATH etc. EMIT’ 15, Copyright © Para. Tools, Inc. 59

Python Performance Evaluation HANDS-ON: NATIVE LANGUAGES EMIT’ 15, Copyright © Para. Tools, Inc. 60

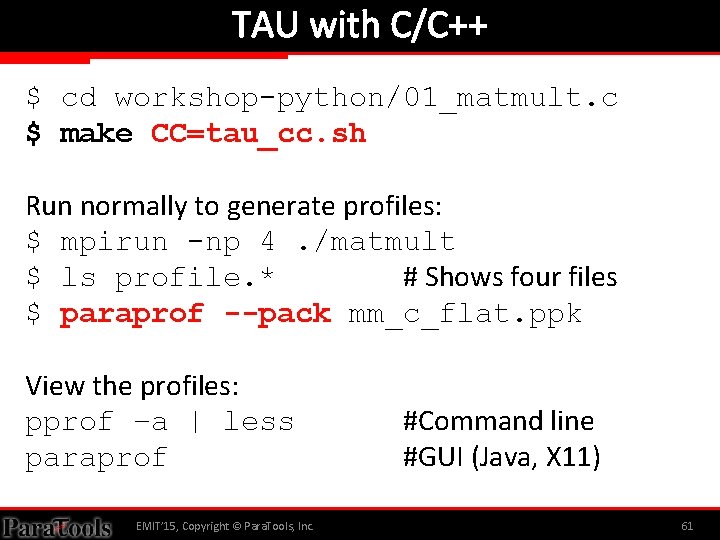
TAU with C/C++ $ cd workshop-python/01_matmult. c $ make CC=tau_cc. sh Run normally to generate profiles: $ mpirun -np 4. /matmult $ ls profile. * # Shows four files $ paraprof --pack mm_c_flat. ppk View the profiles: pprof –a | less paraprof EMIT’ 15, Copyright © Para. Tools, Inc. #Command line #GUI (Java, X 11) 61

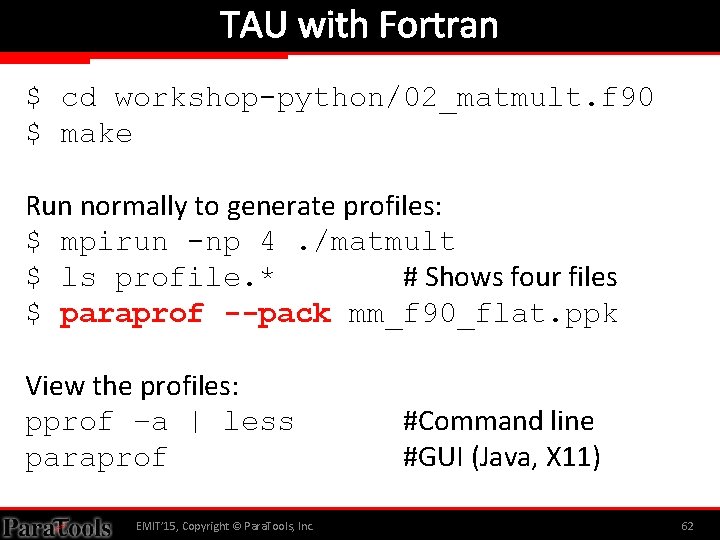
TAU with Fortran $ cd workshop-python/02_matmult. f 90 $ make Run normally to generate profiles: $ mpirun -np 4. /matmult $ ls profile. * # Shows four files $ paraprof --pack mm_f 90_flat. ppk View the profiles: pprof –a | less paraprof EMIT’ 15, Copyright © Para. Tools, Inc. #Command line #GUI (Java, X 11) 62

Python Performance Evaluation HANDS-ON: PYTHON+MPI (MPI 4 PY) EMIT’ 15, Copyright © Para. Tools, Inc. 63

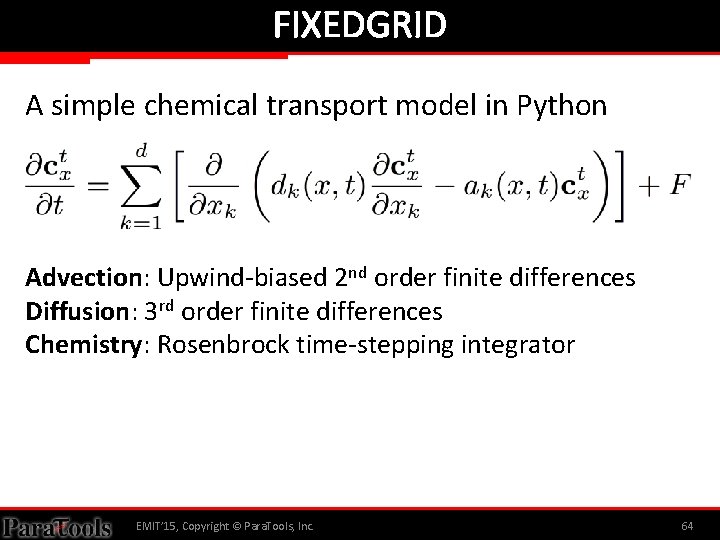
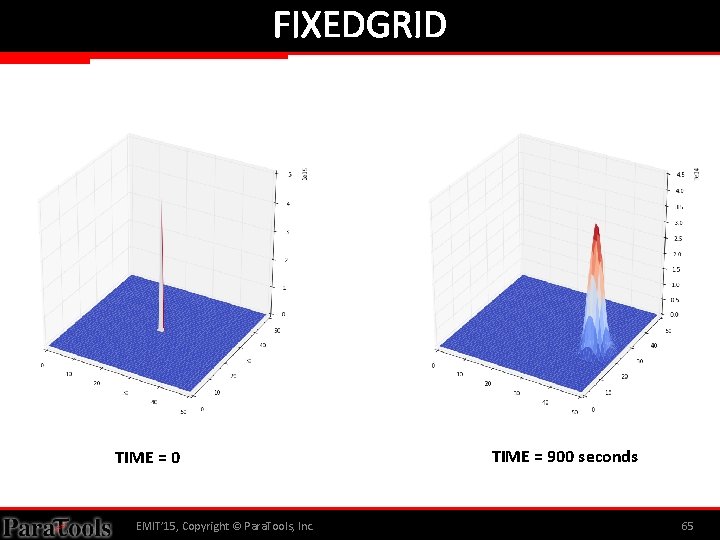
FIXEDGRID A simple chemical transport model in Python Advection: Upwind-biased 2 nd order finite differences Diffusion: 3 rd order finite differences Chemistry: Rosenbrock time-stepping integrator EMIT’ 15, Copyright © Para. Tools, Inc. 64

FIXEDGRID TIME = 0 EMIT’ 15, Copyright © Para. Tools, Inc. TIME = 900 seconds 65

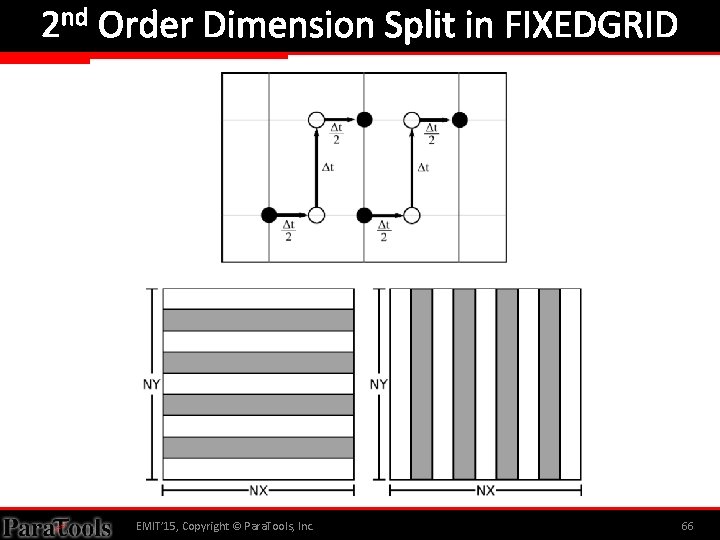
2 nd Order Dimension Split in FIXEDGRID EMIT’ 15, Copyright © Para. Tools, Inc. 66

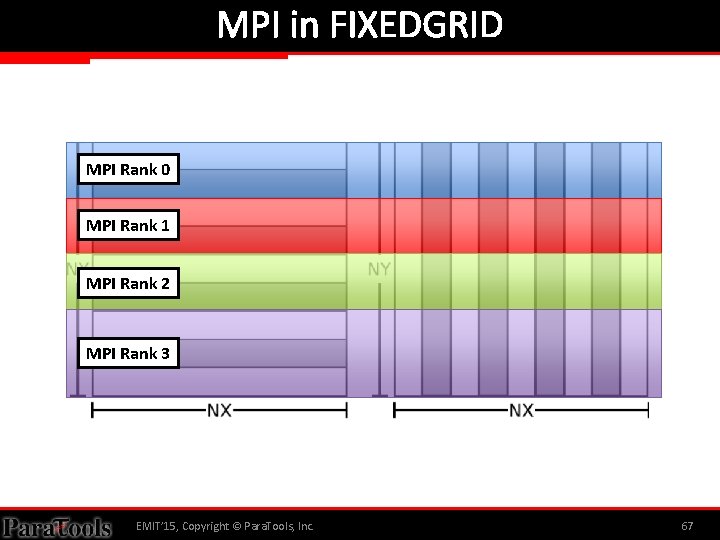
MPI in FIXEDGRID MPI Rank 0 MPI Rank 1 MPI Rank 2 MPI Rank 3 EMIT’ 15, Copyright © Para. Tools, Inc. 67

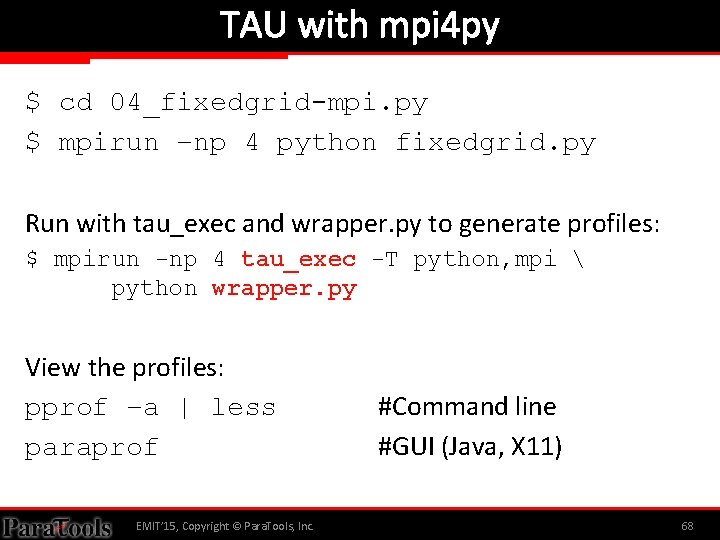
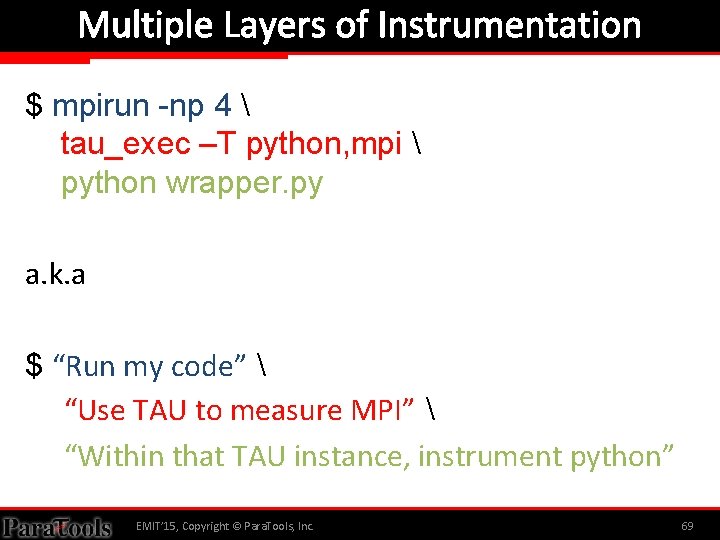
TAU with mpi 4 py $ cd 04_fixedgrid-mpi. py $ mpirun –np 4 python fixedgrid. py Run with tau_exec and wrapper. py to generate profiles: $ mpirun -np 4 tau_exec -T python, mpi python wrapper. py View the profiles: pprof –a | less paraprof EMIT’ 15, Copyright © Para. Tools, Inc. #Command line #GUI (Java, X 11) 68

Multiple Layers of Instrumentation $ mpirun -np 4 tau_exec –T python, mpi python wrapper. py a. k. a $ “Run my code” “Use TAU to measure MPI” “Within that TAU instance, instrument python” EMIT’ 15, Copyright © Para. Tools, Inc. 69

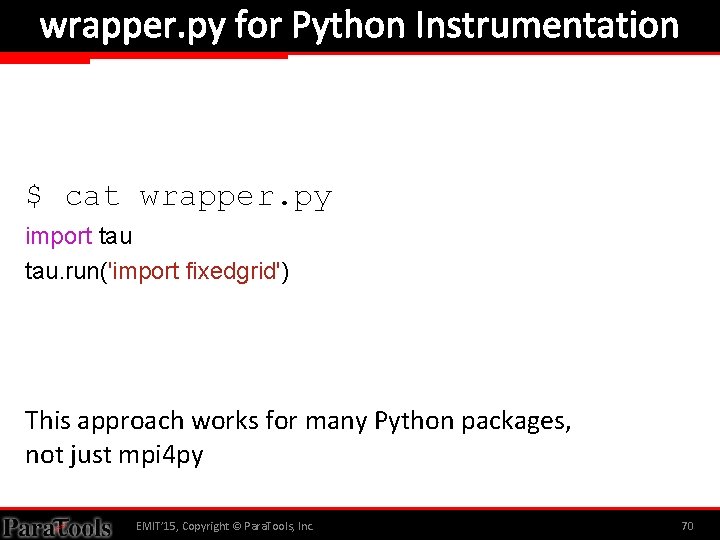
wrapper. py for Python Instrumentation $ cat wrapper. py import tau. run('import fixedgrid') This approach works for many Python packages, not just mpi 4 py EMIT’ 15, Copyright © Para. Tools, Inc. 70

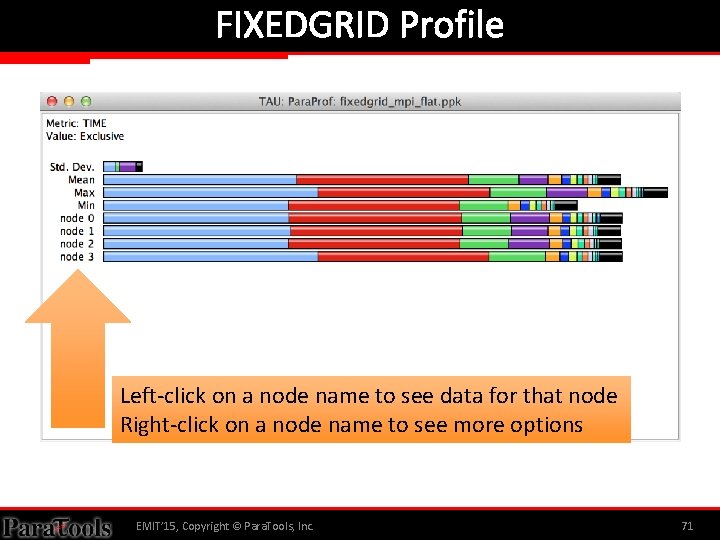
FIXEDGRID Profile Left-click on a node name to see data for that node Right-click on a node name to see more options EMIT’ 15, Copyright © Para. Tools, Inc. 71

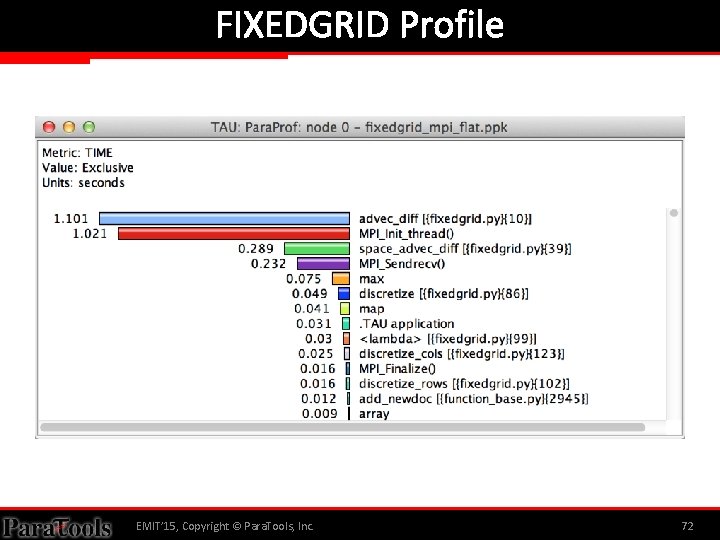
FIXEDGRID Profile EMIT’ 15, Copyright © Para. Tools, Inc. 72

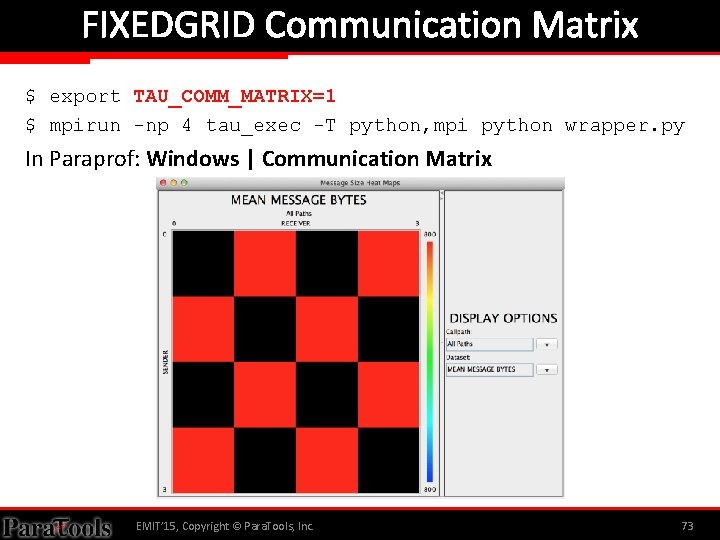
FIXEDGRID Communication Matrix $ export TAU_COMM_MATRIX=1 $ mpirun -np 4 tau_exec -T python, mpi python wrapper. py In Paraprof: Windows | Communication Matrix EMIT’ 15, Copyright © Para. Tools, Inc. 73

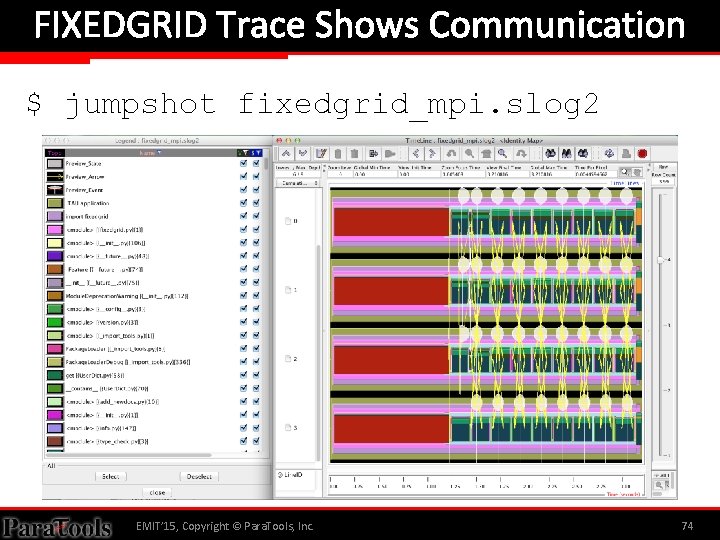
FIXEDGRID Trace Shows Communication $ jumpshot fixedgrid_mpi. slog 2 EMIT’ 15, Copyright © Para. Tools, Inc. 74

Perf. Explorer $ $ $ … $ cd 04_fixedgrid-mpi. py/analysis taudb_configure --create-default taudb_loadtrial fixedgrid_np 1. ppk taudb_loadtrial fixedgrid_np 2. ppk taudb_loadtrial fixedgrid_np 3. ppk perfexplorer EMIT’ 15, Copyright © Para. Tools, Inc. 75

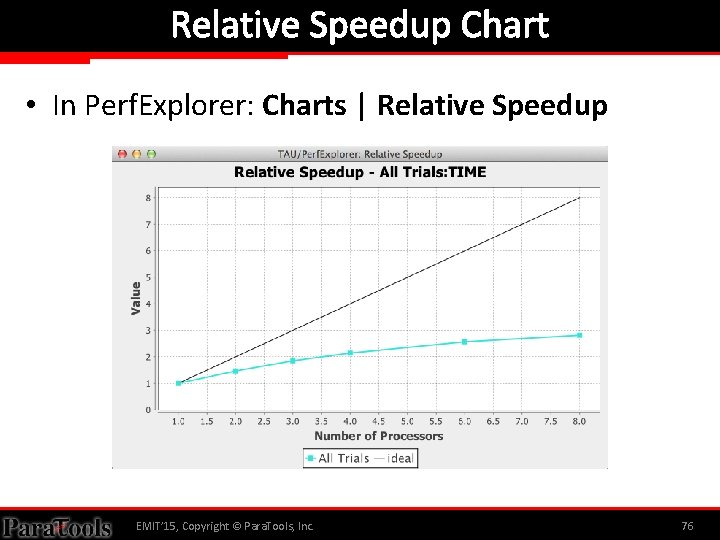
Relative Speedup Chart • In Perf. Explorer: Charts | Relative Speedup EMIT’ 15, Copyright © Para. Tools, Inc. 76

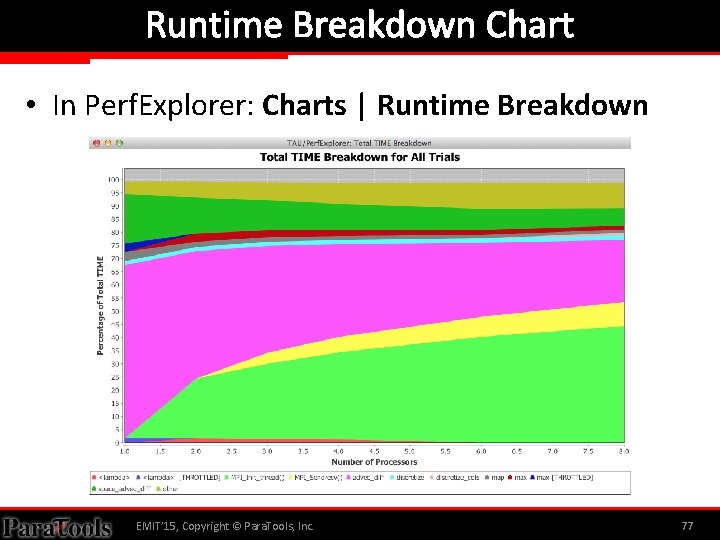
Runtime Breakdown Chart • In Perf. Explorer: Charts | Runtime Breakdown EMIT’ 15, Copyright © Para. Tools, Inc. 77

Python Performance Evaluation HANDS-ON: PYTHON+X (BECAUSE WE CAN) EMIT’ 15, Copyright © Para. Tools, Inc. 78

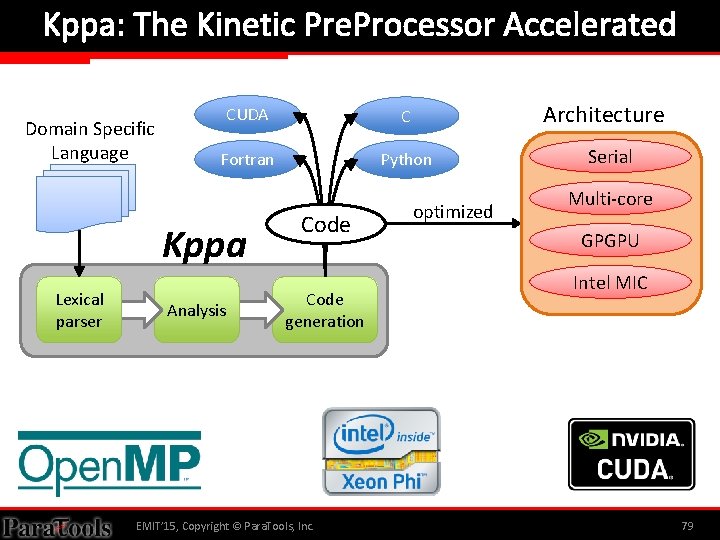
Kppa: The Kinetic Pre. Processor Accelerated Domain Specific Language C Fortran Python Kppa Lexical parser Architecture CUDA Analysis Code generation EMIT’ 15, Copyright © Para. Tools, Inc. optimized Serial Multi-core GPGPU Intel MIC 79

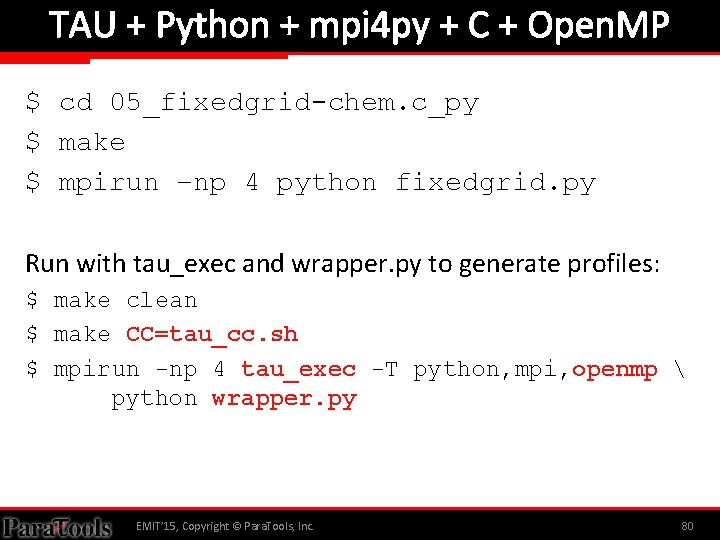
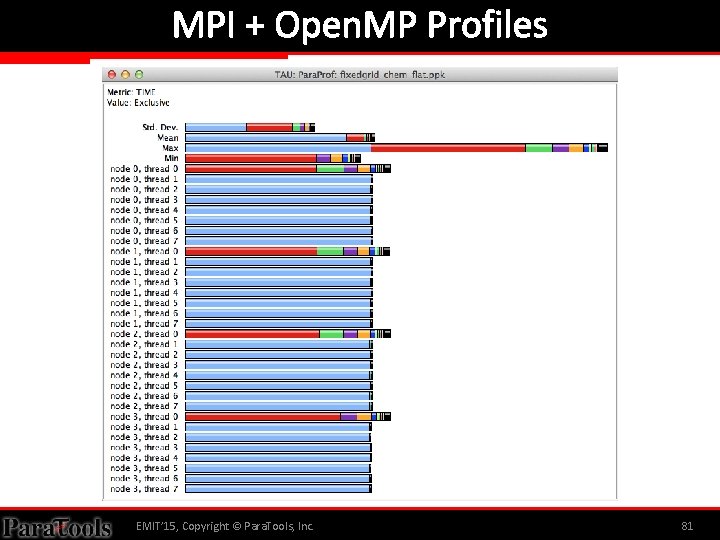
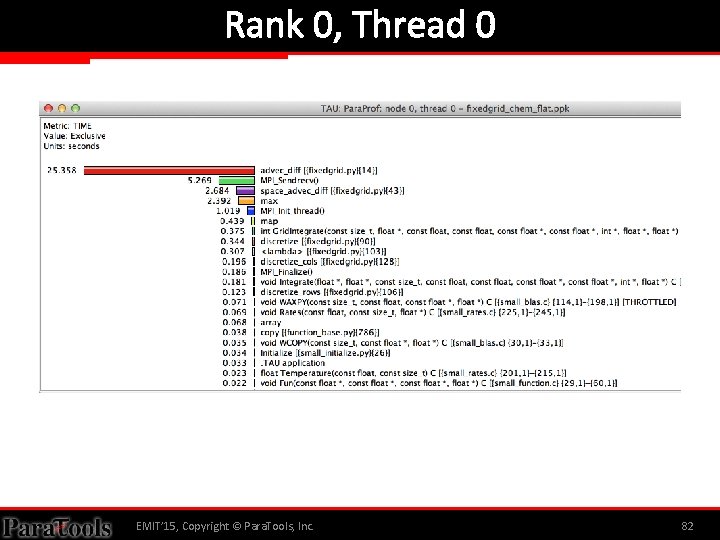
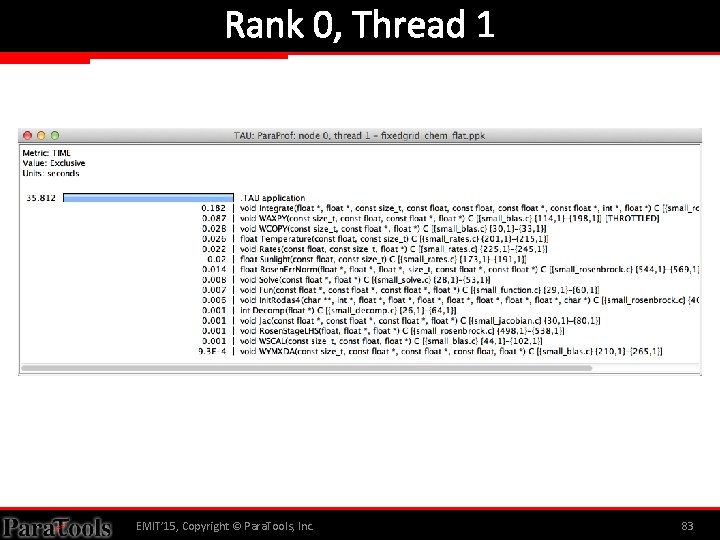
TAU + Python + mpi 4 py + C + Open. MP $ cd 05_fixedgrid-chem. c_py $ make $ mpirun –np 4 python fixedgrid. py Run with tau_exec and wrapper. py to generate profiles: $ make clean $ make CC=tau_cc. sh $ mpirun -np 4 tau_exec -T python, mpi, openmp python wrapper. py EMIT’ 15, Copyright © Para. Tools, Inc. 80

MPI + Open. MP Profiles EMIT’ 15, Copyright © Para. Tools, Inc. 81

Rank 0, Thread 0 EMIT’ 15, Copyright © Para. Tools, Inc. 82

Rank 0, Thread 1 EMIT’ 15, Copyright © Para. Tools, Inc. 83

Python Performance Evaluation HANDS-ON: DEBUGGING EMIT’ 15, Copyright © Para. Tools, Inc. 84

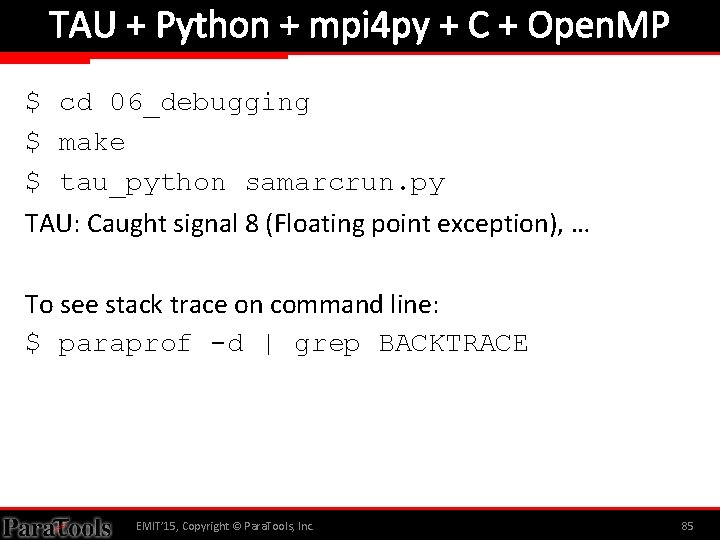
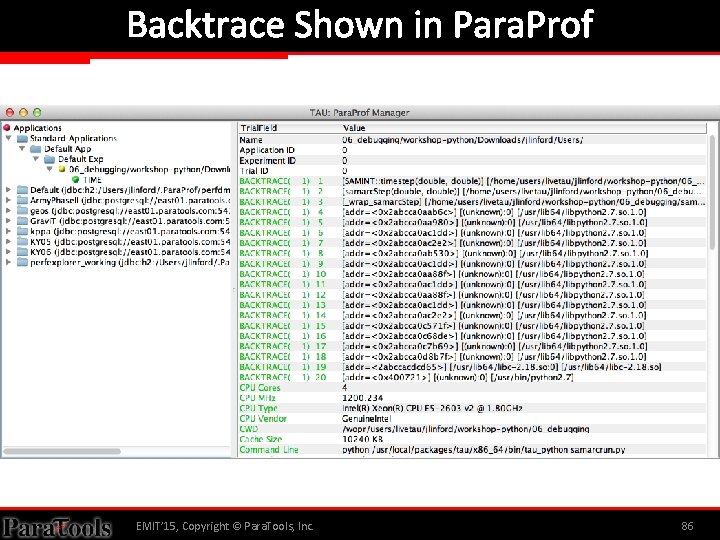
TAU + Python + mpi 4 py + C + Open. MP $ cd 06_debugging $ make $ tau_python samarcrun. py TAU: Caught signal 8 (Floating point exception), … To see stack trace on command line: $ paraprof -d | grep BACKTRACE EMIT’ 15, Copyright © Para. Tools, Inc. 85

Backtrace Shown in Para. Prof EMIT’ 15, Copyright © Para. Tools, Inc. 86

Python Performance Evaluation HANDS-ON: TAU AND IPYTHON EMIT’ 15, Copyright © Para. Tools, Inc. 87

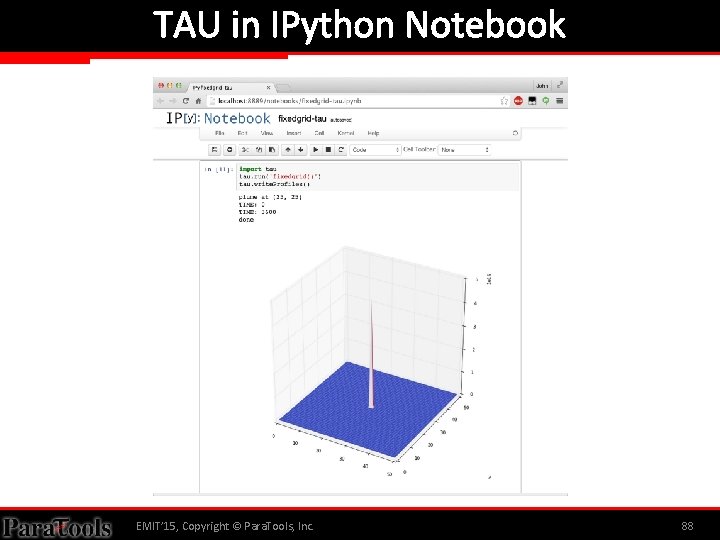
TAU in IPython Notebook EMIT’ 15, Copyright © Para. Tools, Inc. 88

Python Performance Evaluation CONCLUSION EMIT’ 15, Copyright © Para. Tools, Inc. 89

Download TAU from U. Oregon http: //tau. uoregon. edu http: //www. hpclinux. com [Live. DVD] Free download, open source, BSD license EMIT’ 15, Copyright © Para. Tools, Inc. 90

Acknowledgements • Department of Energy – – • • Office of Science Argonne National Laboratory Oak Ridge National Laboratory NNSA/ASC Trilabs (SNL, LLNL, LANL) HPCMP Do. D PETTT Program National Science Foundation – Glassbox, SI-2 • • University of Tennessee University of New Hampshire – • Jean Perez, Benjamin Chandran University of Oregon – Allen D. Malony, Sameer Shende – Kevin Huck, Wyatt Spear • TU Dresden – Holger Brunst, Andreas Knupfer – Wolfgang Nagel • Research Centre Jülich – Bernd Mohr – Felix Wolf EMIT’ 15, Copyright © Para. Tools, Inc. 91

TAU Performance System REFERENCE EMIT’ 15, Copyright © Para. Tools, Inc. 92

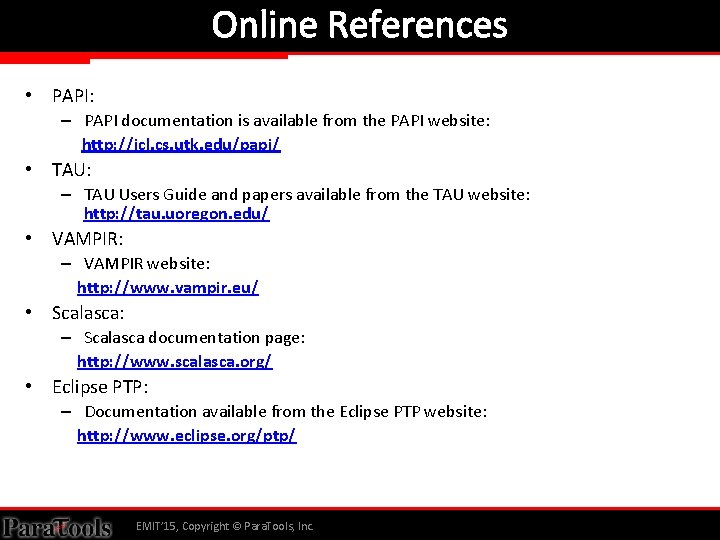
Online References • PAPI: – PAPI documentation is available from the PAPI website: http: //icl. cs. utk. edu/papi/ • TAU: – TAU Users Guide and papers available from the TAU website: http: //tau. uoregon. edu/ • VAMPIR: – VAMPIR website: http: //www. vampir. eu/ • Scalasca: – Scalasca documentation page: http: //www. scalasca. org/ • Eclipse PTP: – Documentation available from the Eclipse PTP website: http: //www. eclipse. org/ptp/ EMIT’ 15, Copyright © Para. Tools, Inc. 93

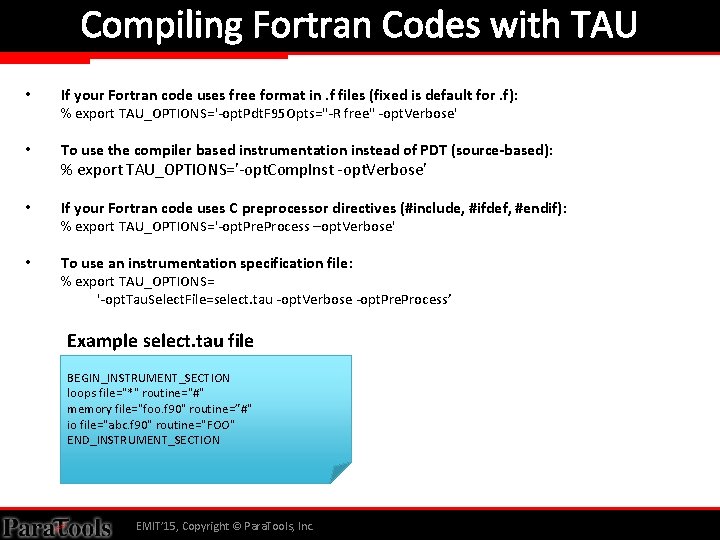
Compiling Fortran Codes with TAU • If your Fortran code uses free format in. f files (fixed is default for. f): % export TAU_OPTIONS='-opt. Pdt. F 95 Opts="-R free" -opt. Verbose' • To use the compiler based instrumentation instead of PDT (source-based): % export TAU_OPTIONS='-opt. Comp. Inst -opt. Verbose' • If your Fortran code uses C preprocessor directives (#include, #ifdef, #endif): % export TAU_OPTIONS='-opt. Pre. Process –opt. Verbose' • To use an instrumentation specification file: % export TAU_OPTIONS= '-opt. Tau. Select. File=select. tau -opt. Verbose -opt. Pre. Process’ Example select. tau file BEGIN_INSTRUMENT_SECTION loops file="*" routine="#" memory file="foo. f 90" routine=”#" io file="abc. f 90" routine="FOO" END_INSTRUMENT_SECTION EMIT’ 15, Copyright © Para. Tools, Inc. 94

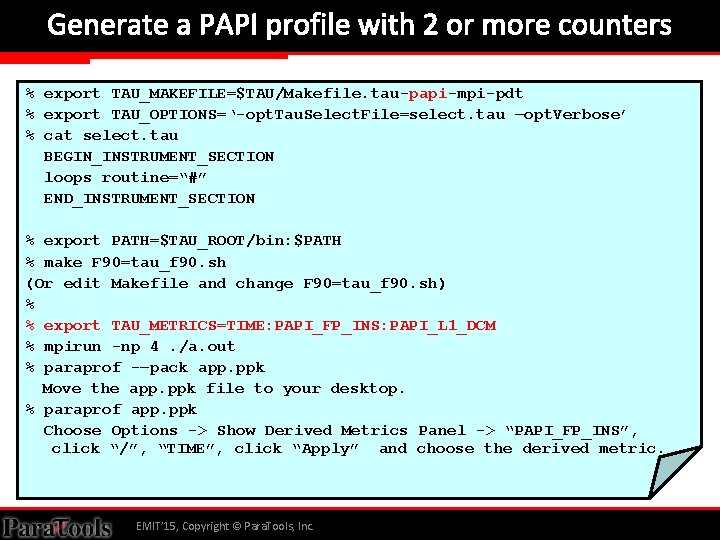
Generate a PAPI profile with 2 or more counters % export TAU_MAKEFILE=$TAU/Makefile. tau-papi-mpi-pdt % export TAU_OPTIONS=‘-opt. Tau. Select. File=select. tau –opt. Verbose’ % cat select. tau BEGIN_INSTRUMENT_SECTION loops routine=“#” END_INSTRUMENT_SECTION % export PATH=$TAU_ROOT/bin: $PATH % make F 90=tau_f 90. sh (Or edit Makefile and change F 90=tau_f 90. sh) % % export TAU_METRICS=TIME: PAPI_FP_INS: PAPI_L 1_DCM % mpirun -np 4. /a. out % paraprof -–pack app. ppk Move the app. ppk file to your desktop. % paraprof app. ppk Choose Options -> Show Derived Metrics Panel -> “PAPI_FP_INS”, click “/”, “TIME”, click “Apply” and choose the derived metric. EMIT’ 15, Copyright © Para. Tools, Inc. 95

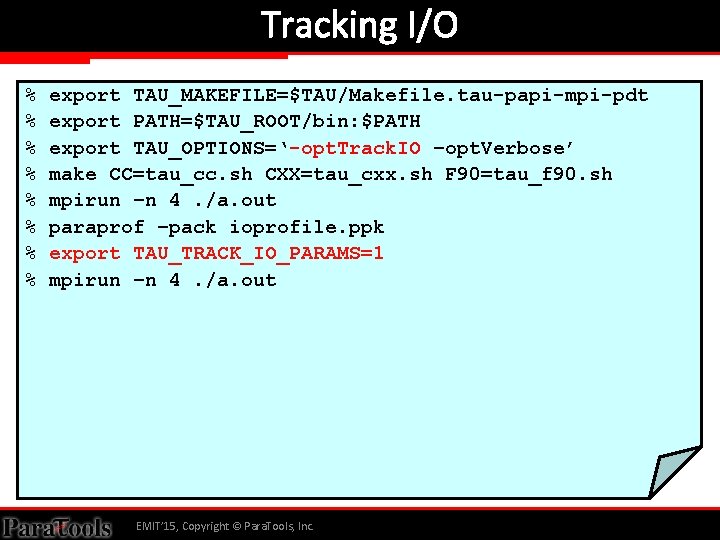
Tracking I/O % % % % export TAU_MAKEFILE=$TAU/Makefile. tau-papi-mpi-pdt export PATH=$TAU_ROOT/bin: $PATH export TAU_OPTIONS=‘-opt. Track. IO –opt. Verbose’ make CC=tau_cc. sh CXX=tau_cxx. sh F 90=tau_f 90. sh mpirun –n 4. /a. out paraprof –pack ioprofile. ppk export TAU_TRACK_IO_PARAMS=1 mpirun –n 4. /a. out EMIT’ 15, Copyright © Para. Tools, Inc. 96

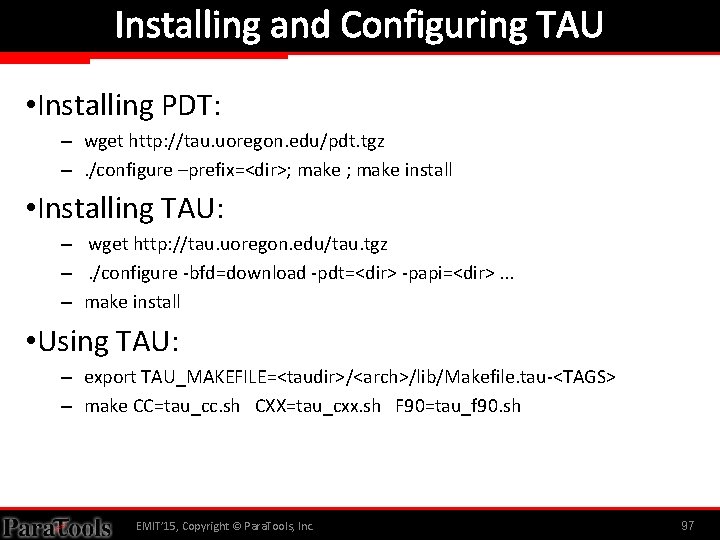
Installing and Configuring TAU • Installing PDT: – wget http: //tau. uoregon. edu/pdt. tgz –. /configure –prefix=<dir>; make install • Installing TAU: – wget http: //tau. uoregon. edu/tau. tgz –. /configure -bfd=download -pdt=<dir> -papi=<dir>. . . – make install • Using TAU: – export TAU_MAKEFILE=<taudir>/<arch>/lib/Makefile. tau-<TAGS> – make CC=tau_cc. sh CXX=tau_cxx. sh F 90=tau_f 90. sh EMIT’ 15, Copyright © Para. Tools, Inc. 97

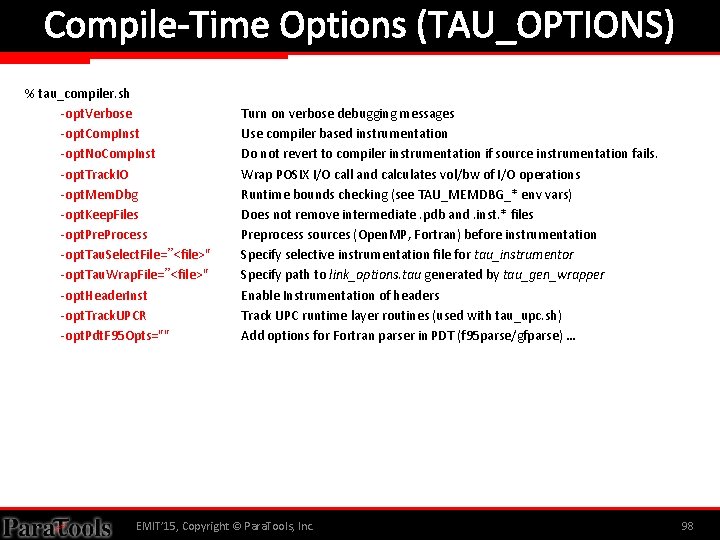
Compile-Time Options (TAU_OPTIONS) % tau_compiler. sh -opt. Verbose -opt. Comp. Inst -opt. No. Comp. Inst -opt. Track. IO -opt. Mem. Dbg -opt. Keep. Files -opt. Pre. Process -opt. Tau. Select. File=”<file>" -opt. Tau. Wrap. File=”<file>" -opt. Header. Inst -opt. Track. UPCR -opt. Pdt. F 95 Opts="" Turn on verbose debugging messages Use compiler based instrumentation Do not revert to compiler instrumentation if source instrumentation fails. Wrap POSIX I/O call and calculates vol/bw of I/O operations Runtime bounds checking (see TAU_MEMDBG_* env vars) Does not remove intermediate. pdb and. inst. * files Preprocess sources (Open. MP, Fortran) before instrumentation Specify selective instrumentation file for tau_instrumentor Specify path to link_options. tau generated by tau_gen_wrapper Enable Instrumentation of headers Track UPC runtime layer routines (used with tau_upc. sh) Add options for Fortran parser in PDT (f 95 parse/gfparse) … EMIT’ 15, Copyright © Para. Tools, Inc. 98

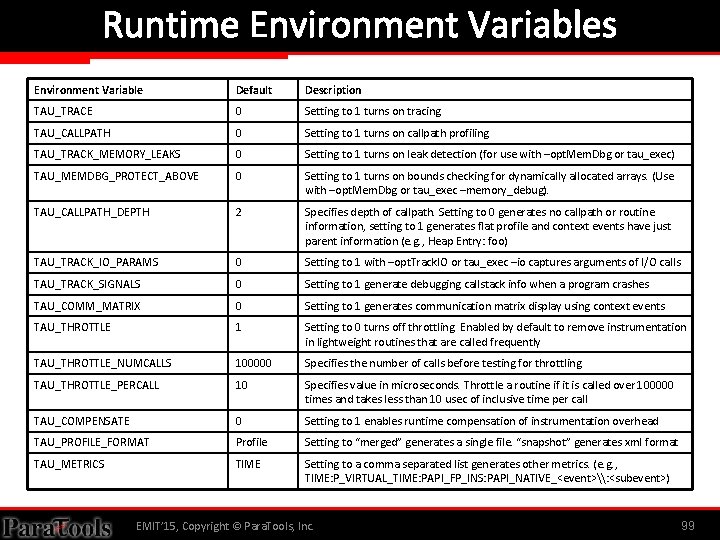
Runtime Environment Variables Environment Variable Default Description TAU_TRACE 0 Setting to 1 turns on tracing TAU_CALLPATH 0 Setting to 1 turns on callpath profiling TAU_TRACK_MEMORY_LEAKS 0 Setting to 1 turns on leak detection (for use with –opt. Mem. Dbg or tau_exec) TAU_MEMDBG_PROTECT_ABOVE 0 Setting to 1 turns on bounds checking for dynamically allocated arrays. (Use with –opt. Mem. Dbg or tau_exec –memory_debug). TAU_CALLPATH_DEPTH 2 Specifies depth of callpath. Setting to 0 generates no callpath or routine information, setting to 1 generates flat profile and context events have just parent information (e. g. , Heap Entry: foo) TAU_TRACK_IO_PARAMS 0 Setting to 1 with –opt. Track. IO or tau_exec –io captures arguments of I/O calls TAU_TRACK_SIGNALS 0 Setting to 1 generate debugging callstack info when a program crashes TAU_COMM_MATRIX 0 Setting to 1 generates communication matrix display using context events TAU_THROTTLE 1 Setting to 0 turns off throttling. Enabled by default to remove instrumentation in lightweight routines that are called frequently TAU_THROTTLE_NUMCALLS 100000 Specifies the number of calls before testing for throttling TAU_THROTTLE_PERCALL 10 Specifies value in microseconds. Throttle a routine if it is called over 100000 times and takes less than 10 usec of inclusive time per call TAU_COMPENSATE 0 Setting to 1 enables runtime compensation of instrumentation overhead TAU_PROFILE_FORMAT Profile Setting to “merged” generates a single file. “snapshot” generates xml format TAU_METRICS TIME Setting to a comma separated list generates other metrics. (e. g. , TIME: P_VIRTUAL_TIME: PAPI_FP_INS: PAPI_NATIVE_<event>\: <subevent>) EMIT’ 15, Copyright © Para. Tools, Inc. 99