Network management system 1 PERFORMANCE MANAGEMENT Performance management

- Slides: 40

Network management system 1 PERFORMANCE MANAGEMENT

Performance management 2 • Performance Management provides functions to evaluate and report upon the behavior of telecommunication equipment and the effectiveness of the network or network element. • Its role is to gather and analyze statistical data for the purpose of monitoring and correcting the behavior and effectiveness of the network, network elements, or other equipment and to aid in planning, provisioning, maintenance and the measurement of quality.

Performance management 3 Performance management tries to quantify performance by using some measurable quantity such as : Capacity Traffic Throughput Response time

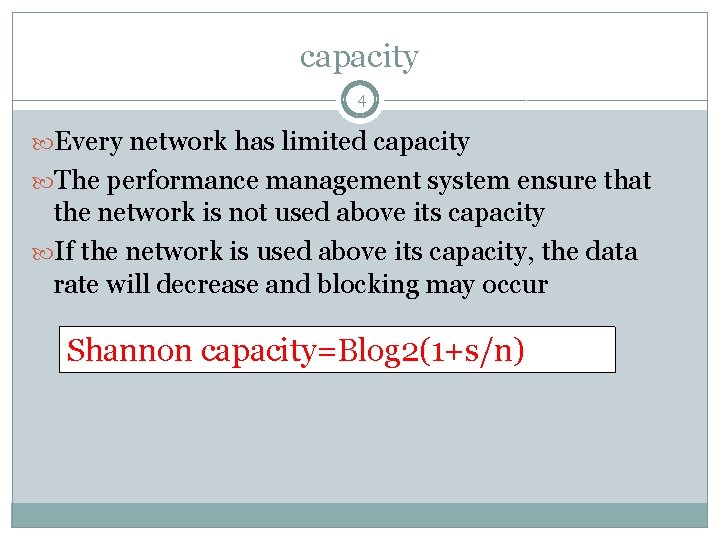
capacity 4 Every network has limited capacity The performance management system ensure that the network is not used above its capacity If the network is used above its capacity, the data rate will decrease and blocking may occur Shannon capacity=Blog 2(1+s/n)

Traffic 5 Traffic ca be measured in two ways: Internally : measured by the number of packets travelling inside the network Externally : measured by exchange of packets outside the network

Throughput 6 Performance management monitors the throughput to make sure that it is not reduced to unacceptable levels.

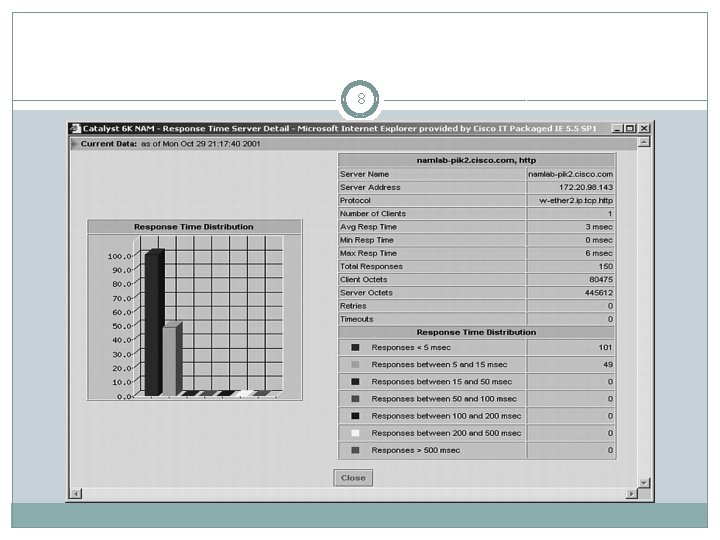
Response time 7 Response time is normally measured from the time a user requests a service to the time the service is granted It can be affected by capacity and traffic

8

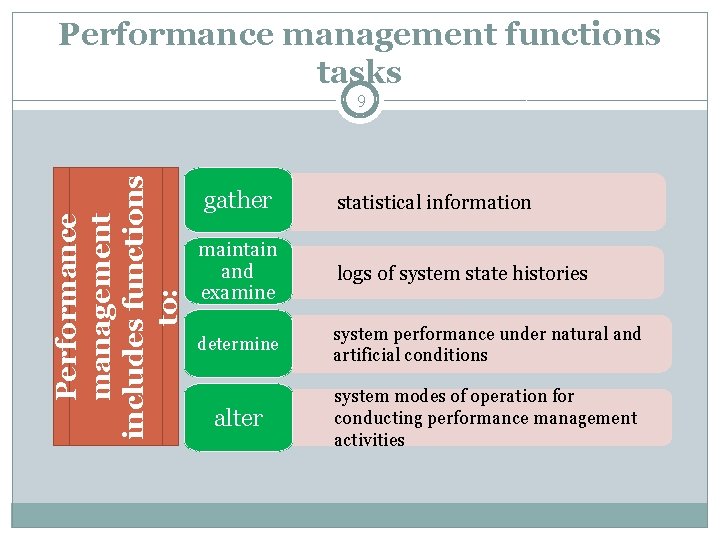
Performance management functions tasks Performance management includes functions to: 9 gather statistical information maintain and examine logs of system state histories determine system performance under natural and artificial conditions alter system modes of operation for conducting performance management activities

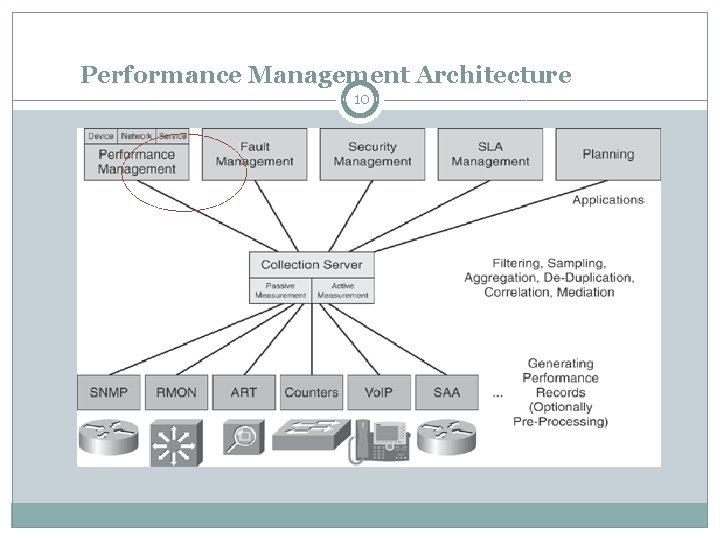
Performance Management Architecture 10

SNMP 11 can be assigned to both performance and accounting and could lead to long theoretical discussions concerning which area they belong to.

RMON 12 RMON provides general network utilization details, such as traffic patterns, top talkers, and applications in the network. RMON information can be collected both at the core and at the edge

ART 13 ART measures delays between request/response sequences in application flows, such as HTTP and FTP, but it can monitor only applications that use well-known TCP ports. To provide end-to-end measurement, an ART probe is needed at both the client and the server end

Counters 14 provide information about data that an application sends and receives over the network

Vo. IP 15 Troubleshooting Cisco Vo. IP call quality is relatively straight forward with the right monitoring and diagnostic tools to help you identify the cause. The most likely causes include: Jitter resulting from congestion in the LAN or the access link, load sharing, routing table updates, and route flapping Latency as a result of propagation delay, handling delay, queuing delay, router outages or link congestion Packet loss occurring from link failures, traffic congestion leading to buffer overflow in routers, faulty networking hardware and occasionally a misrouted packet.

SAA 16 Systems Application Architecture (SAA) was IBM's strategy for enterprise computing in the late 1980 s and early 1990 s. SAA defined three layers of service: Common User Access Common Programming Interface Common Communications Support

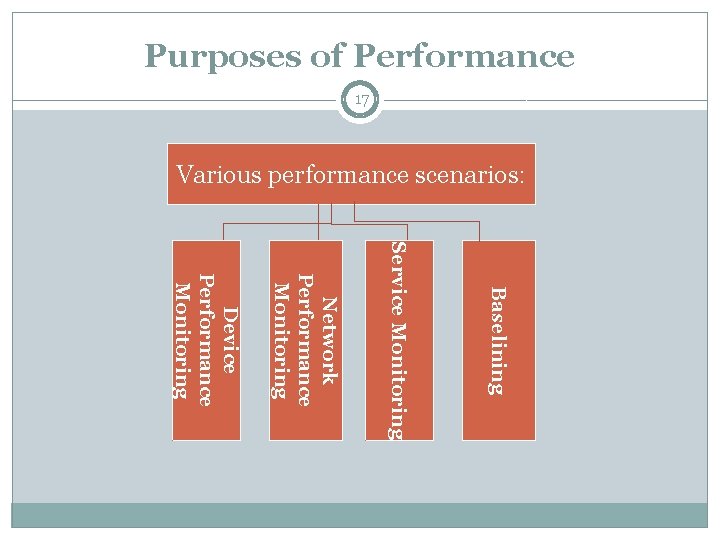
Purposes of Performance 17 Various performance scenarios: Baselining Service Monitoring Network Performance Monitoring Device Performance Monitoring

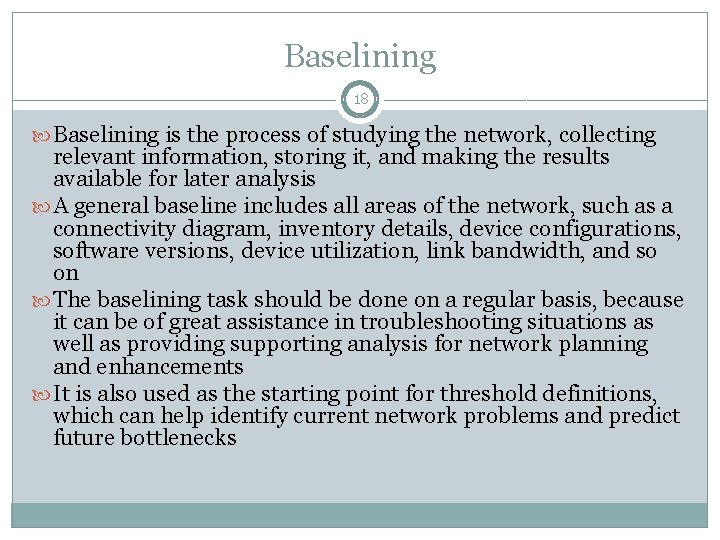
Baselining 18 Baselining is the process of studying the network, collecting relevant information, storing it, and making the results available for later analysis A general baseline includes all areas of the network, such as a connectivity diagram, inventory details, device configurations, software versions, device utilization, link bandwidth, and so on The baselining task should be done on a regular basis, because it can be of great assistance in troubleshooting situations as well as providing supporting analysis for network planning and enhancements It is also used as the starting point for threshold definitions, which can help identify current network problems and predict future bottlenecks

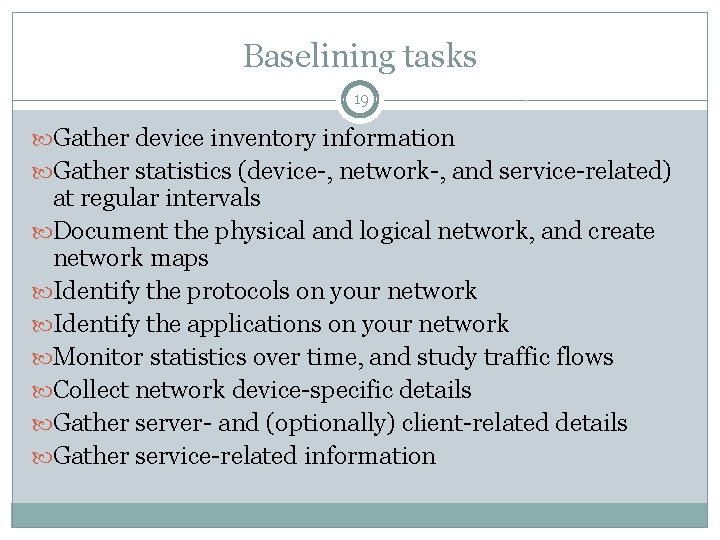
Baselining tasks 19 Gather device inventory information Gather statistics (device-, network-, and service-related) at regular intervals Document the physical and logical network, and create network maps Identify the protocols on your network Identify the applications on your network Monitor statistics over time, and study traffic flows Collect network device-specific details Gather server- and (optionally) client-related details Gather service-related information

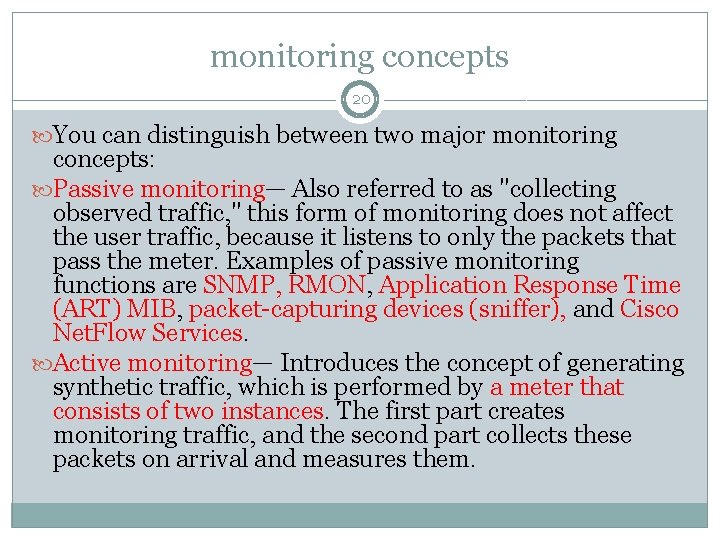
monitoring concepts 20 You can distinguish between two major monitoring concepts: Passive monitoring— Also referred to as "collecting observed traffic, " this form of monitoring does not affect the user traffic, because it listens to only the packets that pass the meter. Examples of passive monitoring functions are SNMP, RMON, Application Response Time (ART) MIB, packet-capturing devices (sniffer), and Cisco Net. Flow Services. Active monitoring— Introduces the concept of generating synthetic traffic, which is performed by a meter that consists of two instances. The first part creates monitoring traffic, and the second part collects these packets on arrival and measures them.

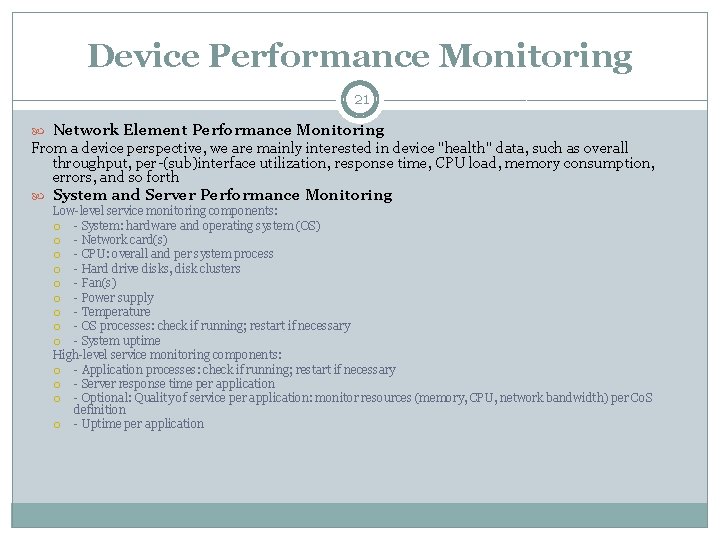
Device Performance Monitoring 21 Network Element Performance Monitoring From a device perspective, we are mainly interested in device "health" data, such as overall throughput, per-(sub)interface utilization, response time, CPU load, memory consumption, errors, and so forth System and Server Performance Monitoring Low-level service monitoring components: - System: hardware and operating system (OS) - Network card(s) - CPU: overall and per system process - Hard drive disks, disk clusters - Fan(s) - Power supply - Temperature - OS processes: check if running; restart if necessary - System uptime High-level service monitoring components: - Application processes: check if running; restart if necessary - Server response time per application - Optional: Quality of service per application: monitor resources (memory, CPU, network bandwidth) per Co. S definition - Uptime per application

Network Performance Monitoring 22 Network connectivity and response time can be monitored with basic tools such as ping and traceroute or with more advanced tools such as Ping -MIB, Cisco IP SLA, external probes, or a monitoring application running at the PC or serve

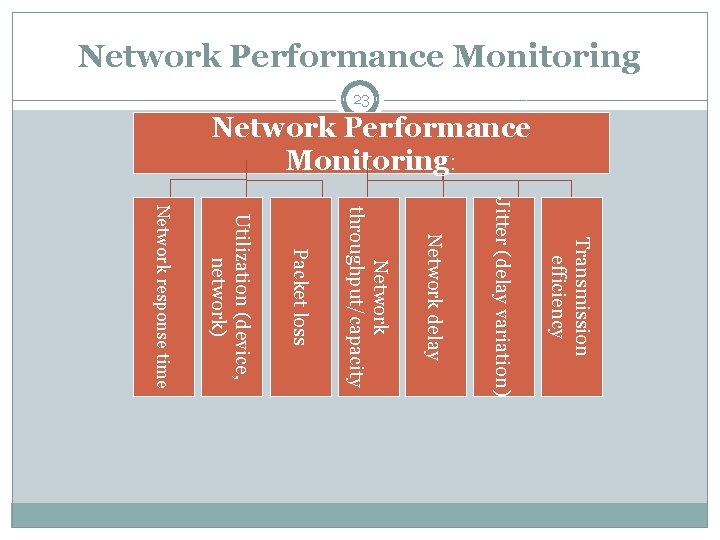
Network Performance Monitoring 23 Network Performance Monitoring: Transmission efficiency Jitter (delay variation) Network delay Network throughput/capacity Packet loss Utilization (device, network) Network response time

Network Performance Monitoring: 24 Transmission efficiency Calculation of transmission efficiency is related to the number of invalid packets; it measures the error-free traffic on the network and compares the rate of erroneous packets to accurate packets

Network Performance Monitoring: 25 Jitter jitter is the variation in latency as measured in the variability over time of the packet latency across a network. A network with constant latency has no variation (or jitter). The standards-based term is "packet delay variation" (PDV). PDV is an important quality of service factor in assessment of network performance.

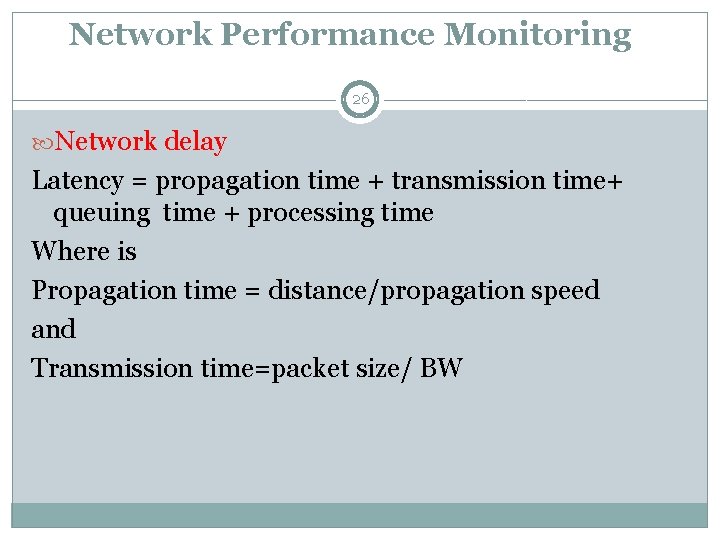
Network Performance Monitoring: 26 Network delay Latency = propagation time + transmission time+ queuing time + processing time Where is Propagation time = distance/propagation speed and Transmission time=packet size/ BW

Network Performance Monitoring: 27 Packet loss it occurs when one or more packets of data travelling across a computer network fail to reach their destination

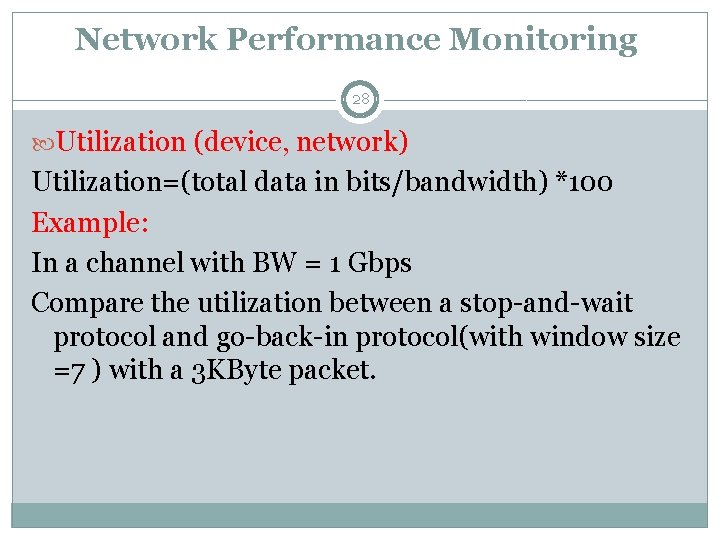
Network Performance Monitoring: 28 Utilization (device, network) Utilization=(total data in bits/bandwidth) *100 Example: In a channel with BW = 1 Gbps Compare the utilization between a stop-and-wait protocol and go-back-in protocol(with window size =7 ) with a 3 KByte packet.

Service Monitoring 29 Service availability measurements require explicit measurement devices or applications, because a clear distinction between server and service is necessary

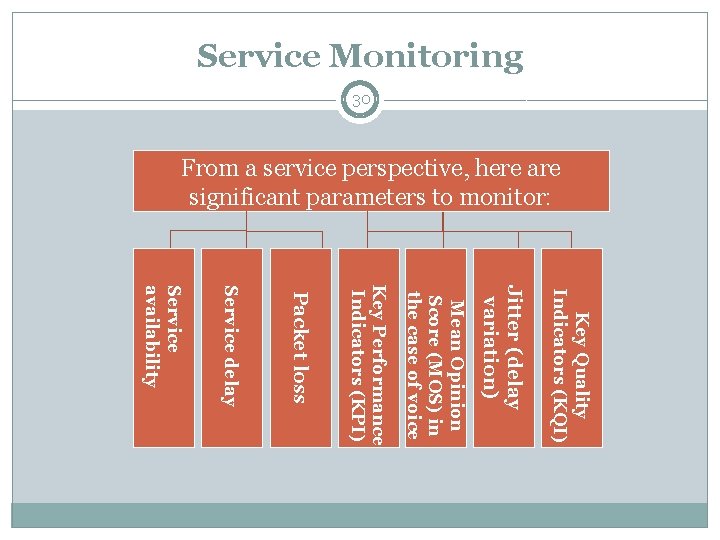
Service Monitoring 30 From a service perspective, here are significant parameters to monitor: Key Quality Indicators (KQI) Jitter (delay variation) Mean Opinion Score (MOS) in the case of voice Key Performance Indicators (KPI) Packet loss Service delay Service availability

Service Monitoring 31 Key Quality Indicators (KQI) Maintaining a dynamic Data Quality environment involves creating a monitoring and feedback mechanism for quality analysts, data stewards and corporate compliance officers. Logan. Britton provides actionable Data Quality metrics known as Key Quality Indicators or (KQI’s). These are high level indicators in the form of reports and dashboards used to monitor your critical data enabling the implementation of preventative measures

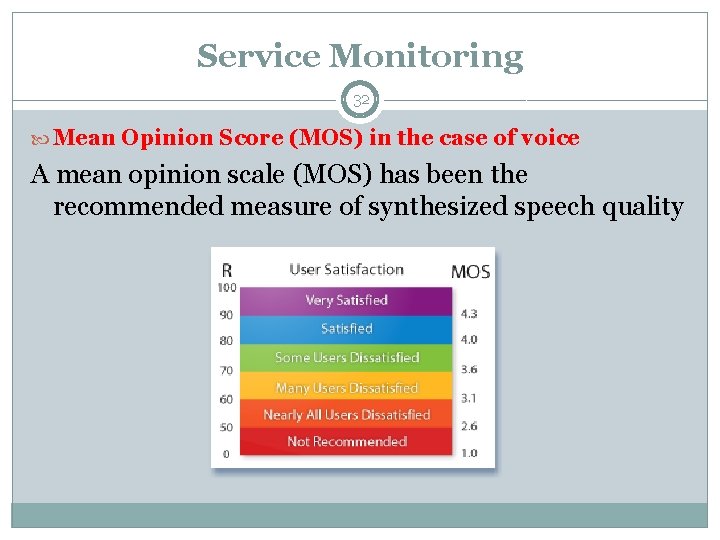
Service Monitoring 32 Mean Opinion Score (MOS) in the case of voice A mean opinion scale (MOS) has been the recommended measure of synthesized speech quality

Service Monitoring 33 Key Performance Indicators (KPI) is a measurable value that demonstrates how effectively a company is achieving key business objectives Organizations use KPIs to evaluate their success at reaching targets.

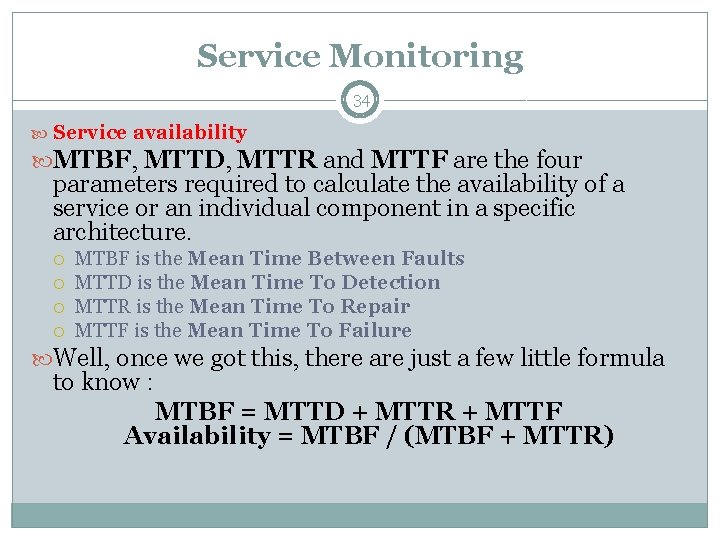
Service Monitoring 34 Service availability MTBF, MTTD, MTTR and MTTF are the four parameters required to calculate the availability of a service or an individual component in a specific architecture. MTBF is the Mean Time Between Faults MTTD is the Mean Time To Detection MTTR is the Mean Time To Repair MTTF is the Mean Time To Failure Well, once we got this, there are just a few little formula to know : MTBF = MTTD + MTTR + MTTF Availability = MTBF / (MTBF + MTTR)

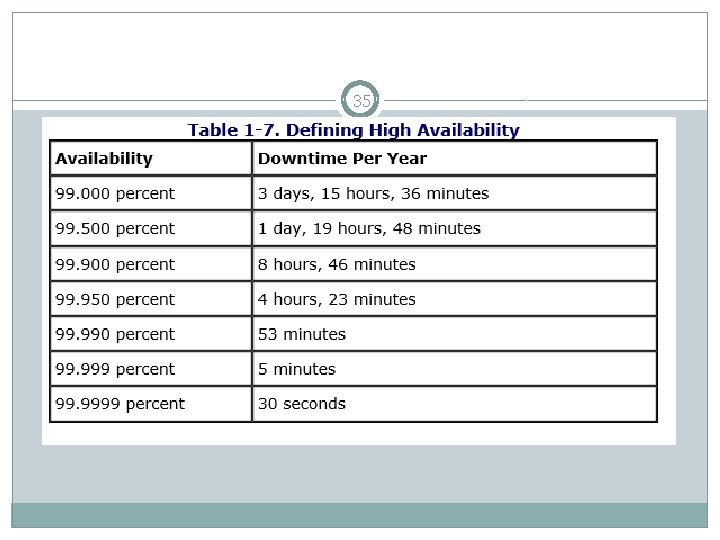
35

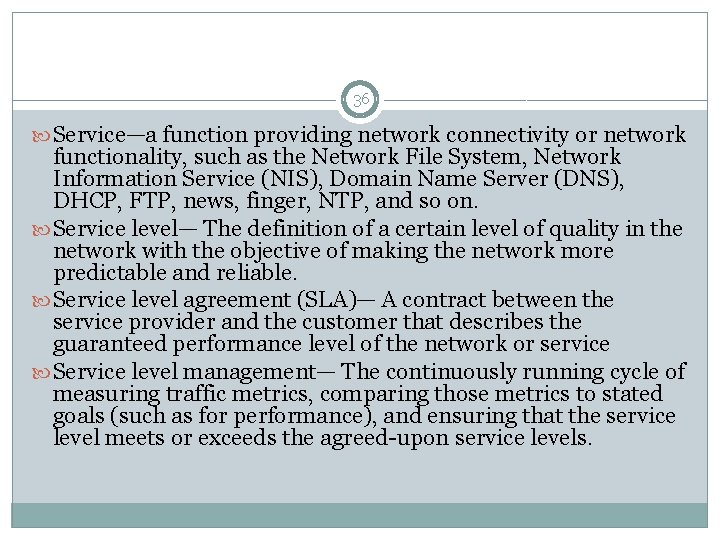
36 Service—a function providing network connectivity or network functionality, such as the Network File System, Network Information Service (NIS), Domain Name Server (DNS), DHCP, FTP, news, finger, NTP, and so on. Service level— The definition of a certain level of quality in the network with the objective of making the network more predictable and reliable. Service level agreement (SLA)— A contract between the service provider and the customer that describes the guaranteed performance level of the network or service Service level management— The continuously running cycle of measuring traffic metrics, comparing those metrics to stated goals (such as for performance), and ensuring that the service level meets or exceeds the agreed-upon service levels.

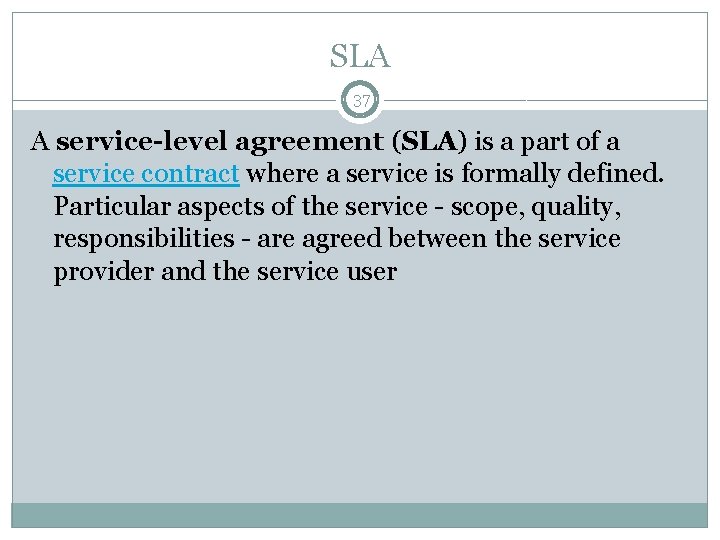
SLA 37 A service-level agreement (SLA) is a part of a service contract where a service is formally defined. Particular aspects of the service - scope, quality, responsibilities - are agreed between the service provider and the service user

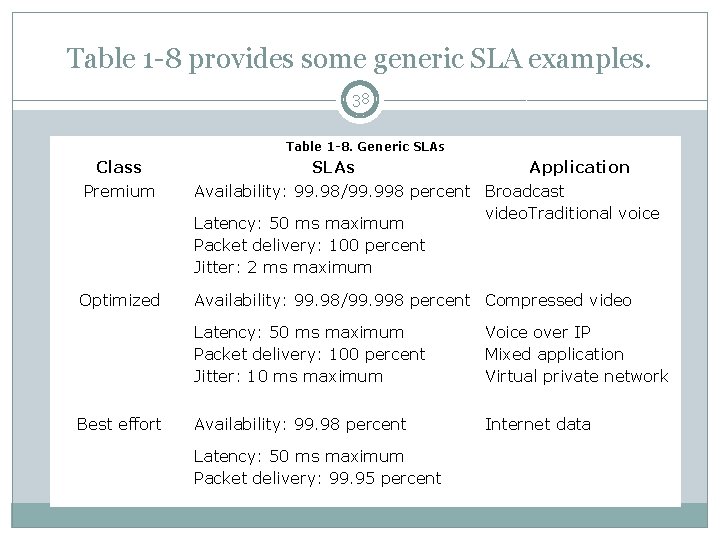
Table 1 -8 provides some generic SLA examples. 38 Table 1 -8. Generic SLAs Class Premium SLAs Application Availability: 99. 98/99. 998 percent Broadcast video. Traditional voice Latency: 50 ms maximum Packet delivery: 100 percent Jitter: 2 ms maximum Optimized Availability: 99. 98/99. 998 percent Compressed video Best effort Latency: 50 ms maximum Packet delivery: 100 percent Jitter: 10 ms maximum Voice over IP Mixed application Virtual private network Availability: 99. 98 percent Internet data Latency: 50 ms maximum Packet delivery: 99. 95 percent

Abbreviations 39 Meaning SNMP RMON ART Vo. IP SAA MIB PDV KQI KPI MOS SLA

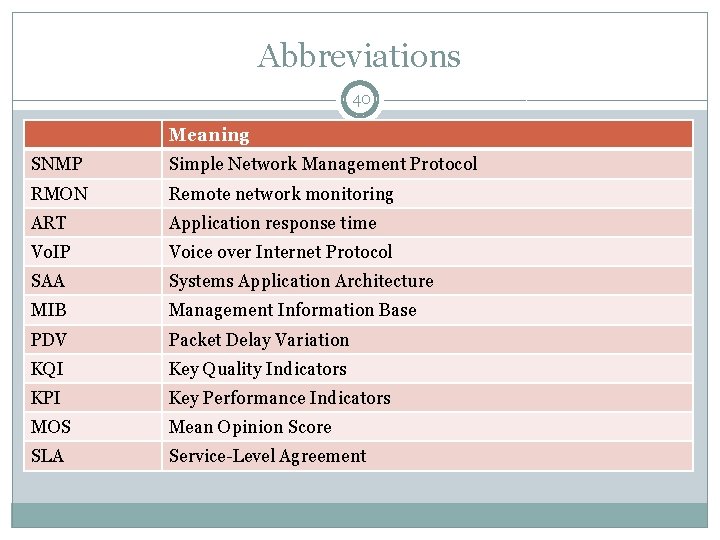
Abbreviations 40 Meaning SNMP Simple Network Management Protocol RMON Remote network monitoring ART Application response time Vo. IP Voice over Internet Protocol SAA Systems Application Architecture MIB Management Information Base PDV Packet Delay Variation KQI Key Quality Indicators KPI Key Performance Indicators MOS Mean Opinion Score SLA Service-Level Agreement