SYSTEMS ANALYSIS AND DESIGN Input Output Design CHAPTER


 Select (methods) Create (document, report…)")

 Signal (imp events, opportunities…) Trigger (action) Confirm (action)")


 :")


")
- Slides: 80
SYSTEMS ANALYSIS AND DESIGN Input & Output Design CHAPTER 3 1
Topics To Be Learnt Objective of Output Types of Presenting Information Designing Printed Output (Printed Reports, Printed Output Method, Special Forms, Multiple Copies) Objective of Input Design Data Capturing Guidelines Designing of Source Document Layout Captions Coding Techniques Classification Code Function Code Sequence Code Significant Digit Subset Code Mnemonic Code Input Tests Validations and 2
Part I Managing Output
How to Identify Computer Output Needs
Identify (specific output) Select (methods) Create (document, report…)
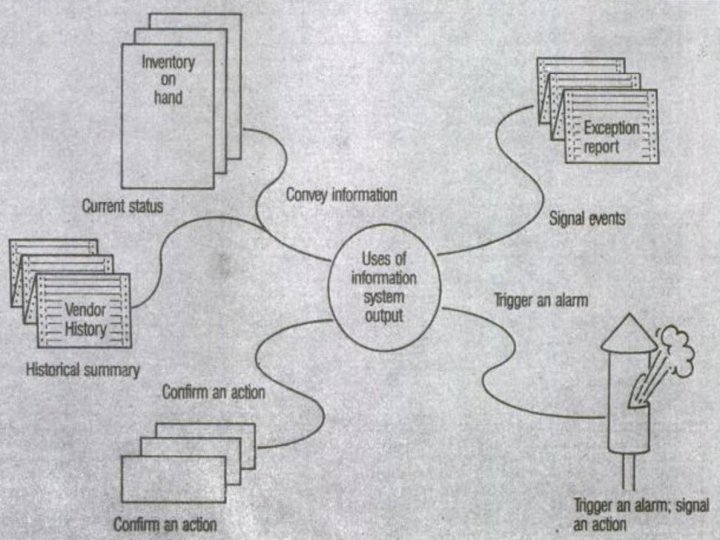
Output Objectives
Convey (past activity, current status…) Signal (imp events, opportunities…) Trigger (action) Confirm (action)
Types of Output
Report Document Message
Output Originates from • Retrieval from a Data Store • Transmission from a process or system activity • Directly from an input Source
Key Output Questions
Who will Receive? What is its Planned Use? How Much Detail is Need? When & How Often Needed? By What Method?
Types of Presenting Information
Less is Better!
Tabular Graphic Color Presentation
Tabular Format
My Internet Usage Information of the Month September, 2012
My Internet Usage Information of the Month September, 2012
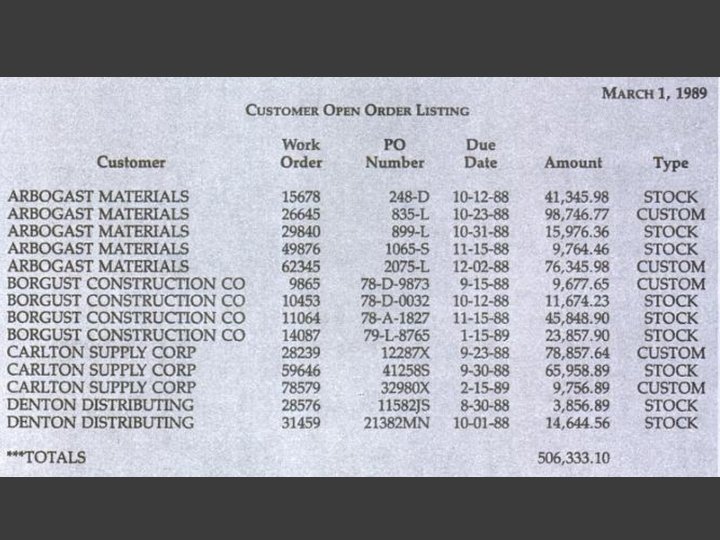
Conditions to use Tabular Format Details dominate and few narrative comments or explanations are needed. Details are presented in discrete categories Each category must be labeled Totals must be drawn or comparisons made between components
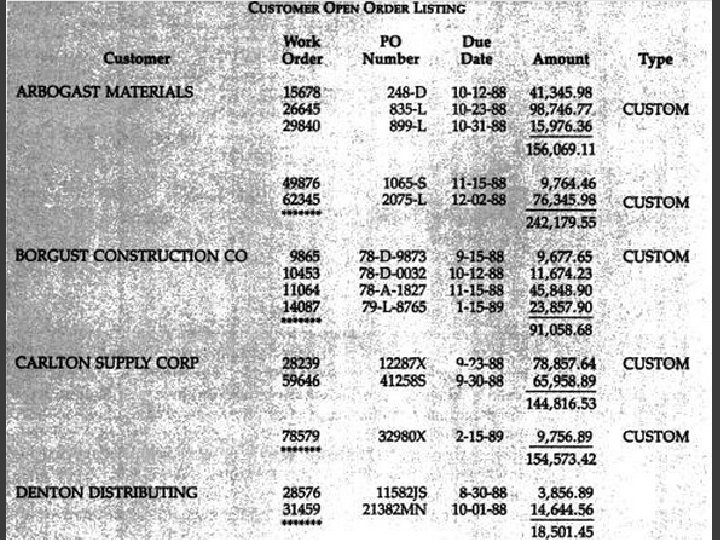
Exceptions to the normal expectations Major categories or groups of activities or entities These Should Stand out Summaries of major categories or activities Unique identification information Time-Dependent entities Etc…
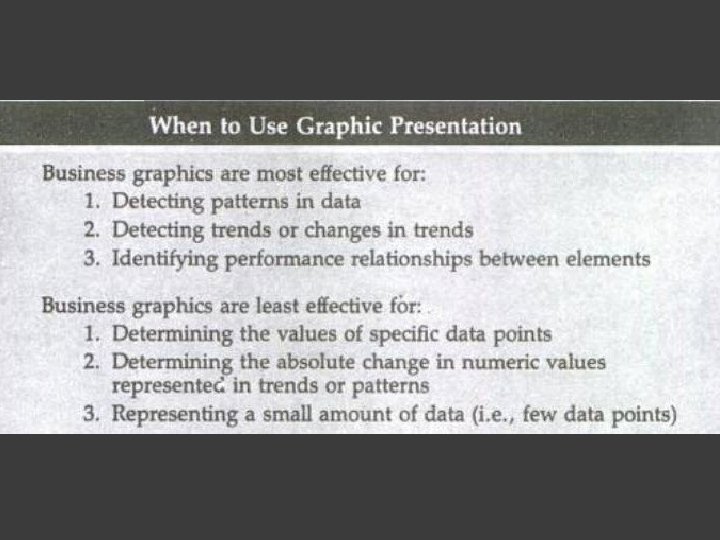
Graphic Format
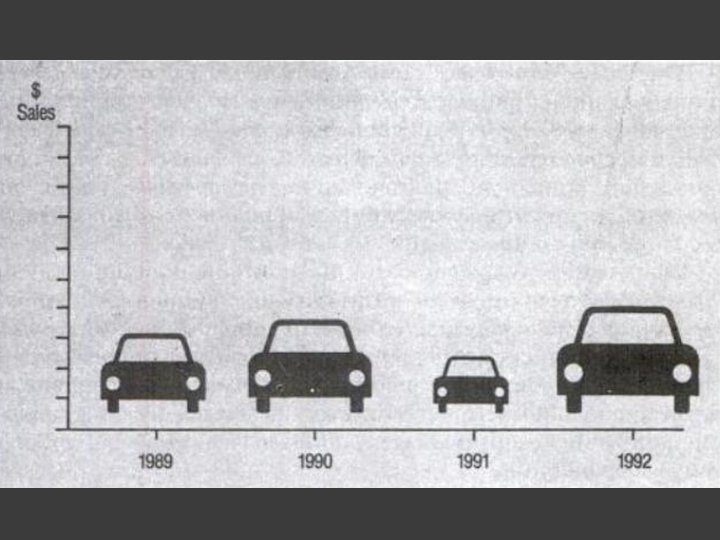
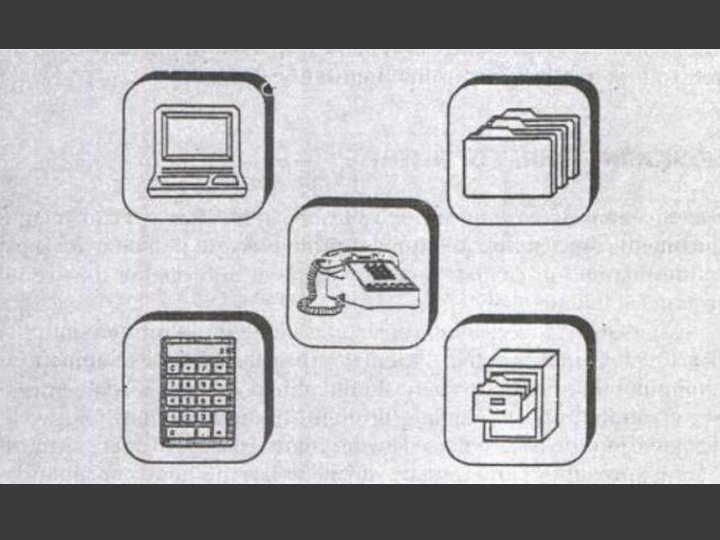
Types of Business Graphics When to Use Graphics • Facilitating Effective Presentation of Data • Managing Information Volume • Fulfilling Personal Preference • Standards in Design of Graphics Using Icons
A tabular format 1989 Month Million 1 1. 8 1 1. 58 2 1. 94 2 1. 76 3 1. 85 4 1. 70 4 1. 91 5 1. 81 5 1. 93 6 1. 85 6 1. 61 7 1. 76 7 1. 58 8 1. 74 8 1. 71 9 1. 51 9 1. 61 10 1. 53 10 1. 68 11 1. 46 11 1. 47 12 1. 35 12 1. 41 1990
A graphical format Impact of Presentation form on Recognizing Performance Fluctuation 2, 5 Monthly Sales (in millions) 2 1, 5 1 0, 5 0 Jan Feb Mar Apr May Jun 1989 Jul Aug Sep Oct Nov Dec Jan Feb Mar Apr May Jun Month and Year 1990 Jul Aug Sep Oct Nov Dec
A tabular format Month A B 1 5, 85, 000 5, 81, 335 2 5, 91, 000 5, 80, 665 3 5, 46, 115 5, 76, 344 4 5, 91, 847 5, 46, 132 5 5, 51, 818 5, 74, 333 6 5, 84, 346 5, 76, 246 7 5, 81, 651 5, 49, 385 8 5, 76, 482 5, 71, 329 9 5, 92, 343 5, 876 10 5, 87, 612 5, 55, 364 11 5, 94, 888 5, 68, 851 12 5, 99, 500 5, 96, 343
A graphical format 610 000 600 000 590 000 580 000 570 000 560 000 A 550 000 B 540 000 530 000 520 000 510 000 Jan Feb Mar Apr May Jun Jul Aug Sep Oct Nov Dec Comparing Customer A & B
o t d e e e N r o o M N w o ! s h t S har C
Arial 10 pt. Bookman Old Style 10 pt. Arial 12 pt. Bookman Old Style 12 pt. Arial 14 pt. Bookman Old Style 14 pt. Arial 16 pt. Bookman Old Style 16 pt. Arial 18 pt. Bookman Old Style 18 pt. Arial 20 pt. Bookman Old Style 20 pt. Arial 24 pt. Bookman Old Style 24 pt. Arial 28 pt. Bookman Old Style 28 pt. Comic Sans MS 10 pt. Monotype Corsiva 10 pt. Comic Sans MS 12 pt. Monotype Corsiva 12 pt. Comic Sans MS 14 pt. Monotype Corsiva 14 pt. Comic Sans MS 16 pt. Monotype Corsiva 16 pt. Comic Sans MS 18 pt. Monotype Corsiva 18 pt. Comic Sans MS 20 pt. Monotype Corsiva 20 pt. Comic Sans MS 24 pt. Monotype Corsiva 24 pt. Comic Sans MS 28 pt. Monotype Corsiva 28 pt.
Keep In Mind While Selecting Icons Immediately recognized and understood If No Familiar icon, use Labels Same icon for particular information Avoid Overcrowding Avoid Labeling icons A Common Size
Color Presentation
A Good, Colored Presentation
Designing Printed Output
Printed Reports • • Printed Output Methods Special Forms Multiple Copies of Output Turnaround Documents Developing a Printed Output Layout • Conventions for Data Presentation Designing Printed Output • • Headings Data and Details Summaries Guidelines
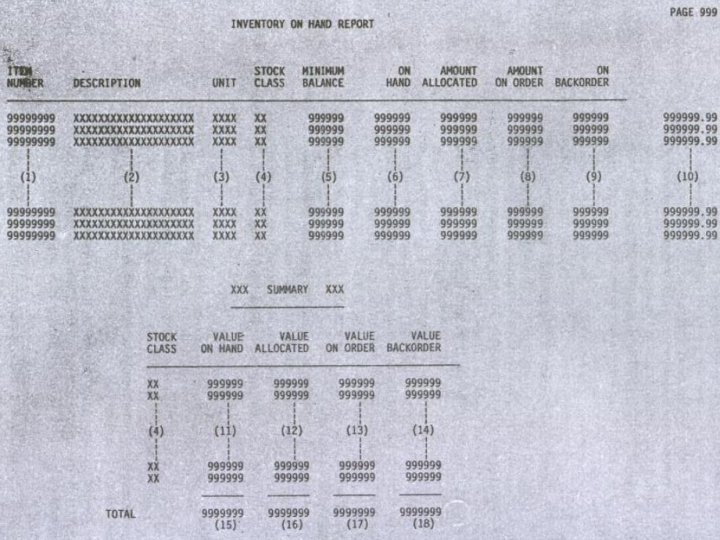
Developing a Printed Output Layout
Variable Preprinted Item Details Headings Summaries and Totals Doc Name and Titles Control Breaks Corporate Names and Addresses Separators Instructions, Notes and Comments
Guidelines Reports/Documents : Left to Right & Top to Bottom Most Important thing(s) : Easiest to Find Title + Page Number + Date Column should be Labeled No Abbreviations
Part II Managing Input
Objectives of Input Design
Co st Controlling Amount of Input in g an d Ti m Bo ttl Avoid Delay en e ec k 3% Avoiding Errors in Data Avoiding Extra Steps , l es s in pu Co Keeping the Process Simple nt ro l t
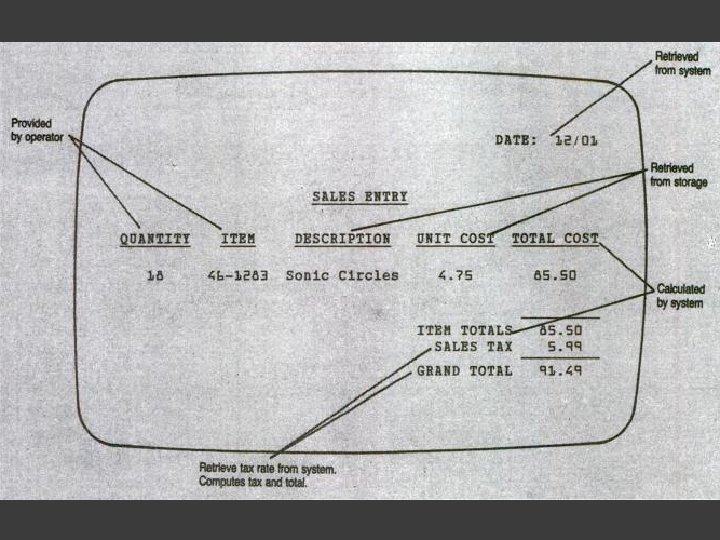
Data Capture Guidelines
Types of Data Variable Data Identification Data
What not to Enter! Constant Data Details that the system can Retrieve Details that the system can Calculate
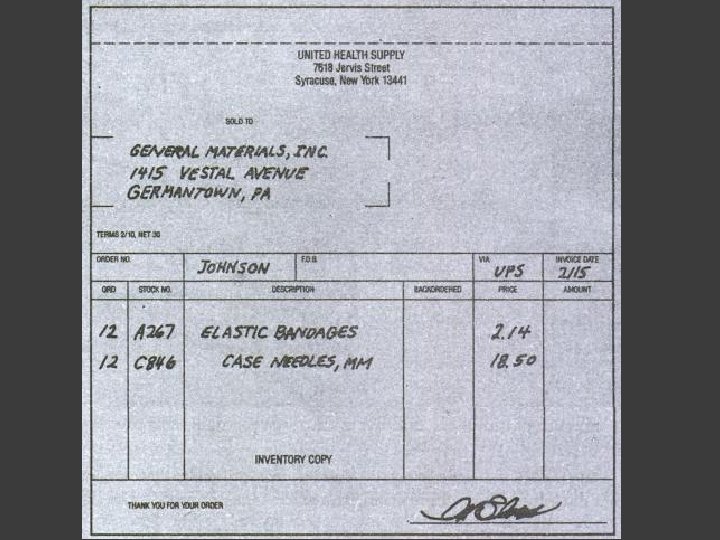
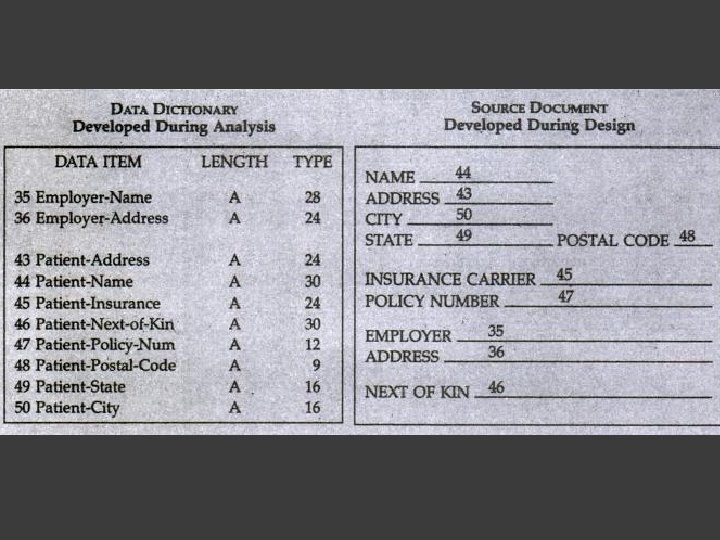
Design of Source Document
Analyst’s Questions Are the data in a form that is usable and readable by the system? What method is best for entering data while • still minimizing the amount of input • the number of errors in the data • and the time required to prepare and enter the data?
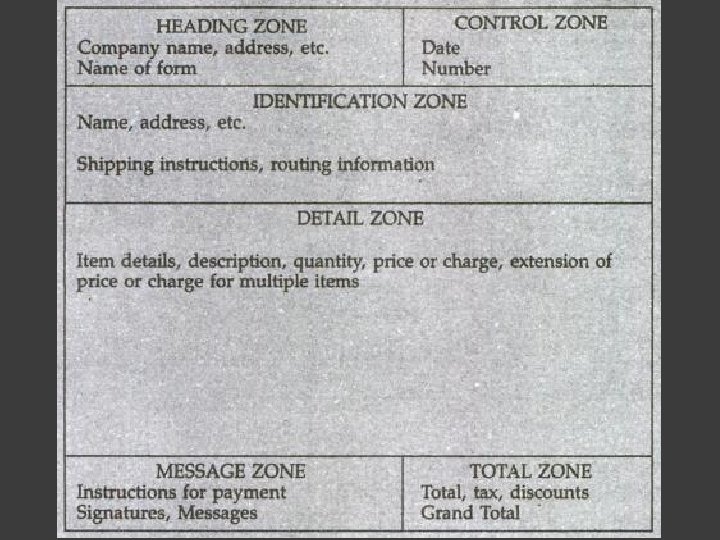
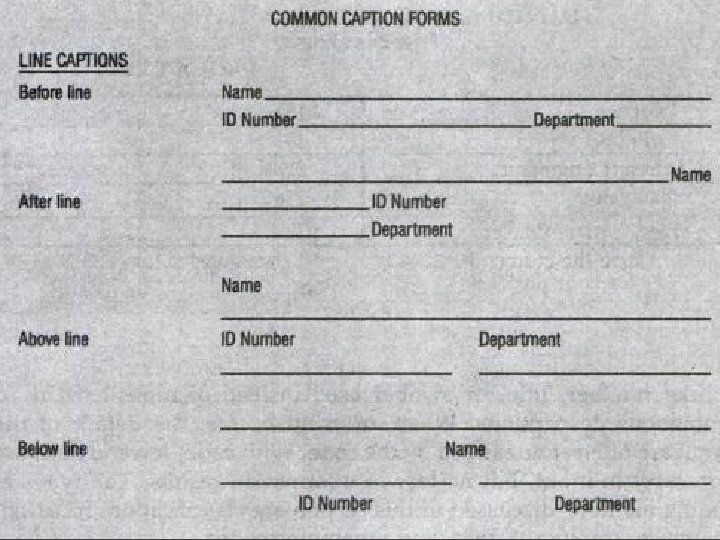
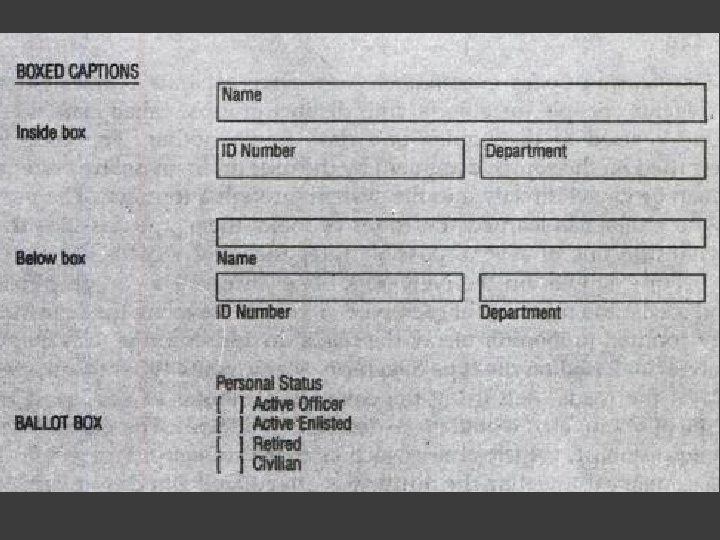
Layout
Caption and Data Capture
Coding Methods
Information System Projects De sig Sa ned f vin or g Space Time Cost
A Code Represents Coding Methods Conditions Words Ideas Relationships De ve to lop ed Reduce Input Control Errors Speed up the System
1 Classification Codes
2 Function Codes
3 Sequence Codes
4 Significant Digit Codes
5 Mnemonic Codes
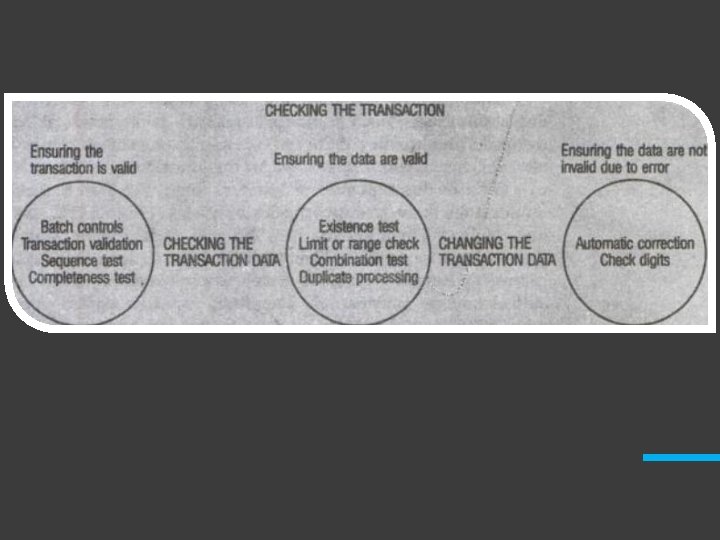
Input Validation and Tests
Checking the Transaction Validation Checking the Transaction Data 1 2 3 4 Modifying the Transaction Data
1 Checking the Transaction Batch Controls
Batch Size 1 Batch Count 2 Batch Total 3
2 Transaction Validation Sequence Test
3 Checking the Transaction Data Existence Test Limit and Range Test Combination Test Duplicate Processing
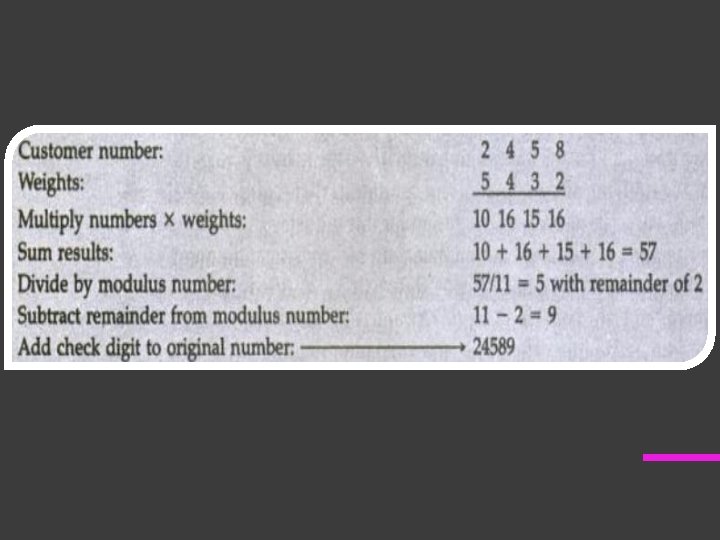
4 Modifying the Transaction Data Automatic Correction Check Digits
Reference Books: ü Analysis and Design of Information System – Jams A Senn (TMH)