Stochastic Hydrology Design Storm Hyetograph Professor Kesheng Cheng


")
 • Gather rainfall data of")


 • Because the design storm hyetograph represents the time")


 of the design storms")


- Slides: 73
Stochastic Hydrology Design Storm Hyetograph Professor Ke-sheng Cheng Department of Bioenvironmental Systems Engineering National Taiwan University
• The random sample often is an annual maximum series of total rainfall depth with respect to a pre-specified duration tr. • The annual maximum series is obtained by continuously moving a window of size tr along the time axis and selecting the maximum total values within the window in each year. • The pre-specified durations, also known as the design durations, are artificially designated durations which are used to determine the corresponding annual maximum depths. • By contrast, event durations are actual raining periods of time of real storm events. 1/26/2022 Dept. of Bioenvironmental Systems Engineering, National Taiwan University 2
Introduction • The design storm hyetograph, i. e. time distribution of the total storm depth, plays an essential role in water resources planning and stormwater management design. • Given a hyetograph model, design storm hyetographs can be developed for locations where sufficient rainfall data are available. For areas without sufficient rainfall data, or for major projects that involve large watershed area, regional hyetographs are necessitated.
• Hyetographs are storm-type specific. For examples, hyetographs of the convective and cyclonic storms are different. • Design storm hyetographs need to be established in accordance with the dominant storm types associated with design rainfall depths. • Hyetographs of real storm events vary from one storm event to another.
Hyetograph models • The alternating block model • The average rank model • The SSGM model
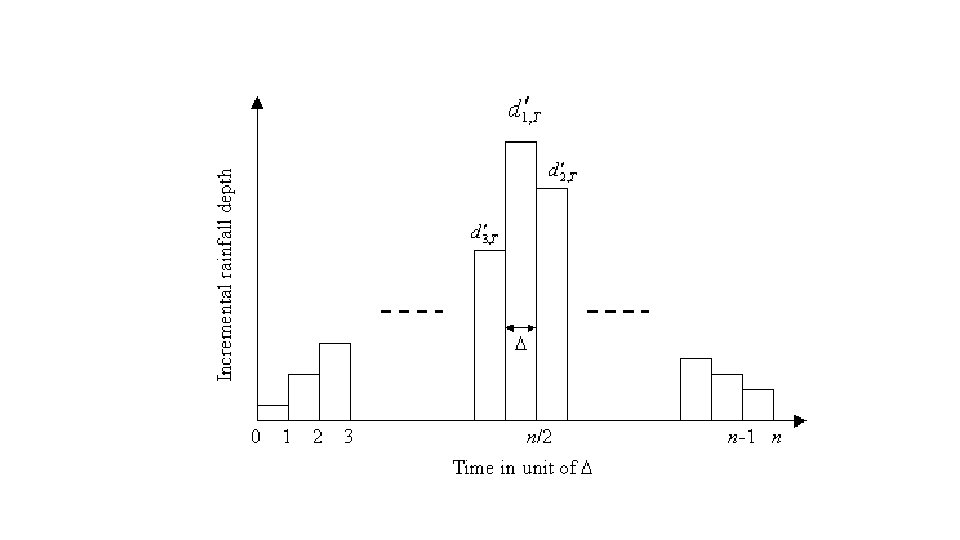
The Alternating Block Model • Calculate the total storm depth D from the IDF relationship • Determine the incremental time interval to be used for total rainfall apportionment. The total number of incremental rainfalls of the design storm is
• Calculate the average intensity and total depth of design storms with a fixed return period T but variable durations k=1, 2, …, n-1 • Calculate the total rainfall difference between design storms of consecutive durations.
• Form a ranked data series of incremental rainfall depth by ranking the incremental rainfall depth in descending order, i. e. ,
• Assign to the most central interval, and to its right (or left) and left (or right), respectively. Other remaining incremental rainfalls in the ranked series are sequentially allocated in a similar alternating manner. • The alternating block hyetograph is developed without considering the characteristics of real storm events. • This model does not use rainfall data of real storm events and is duration and return period specific.
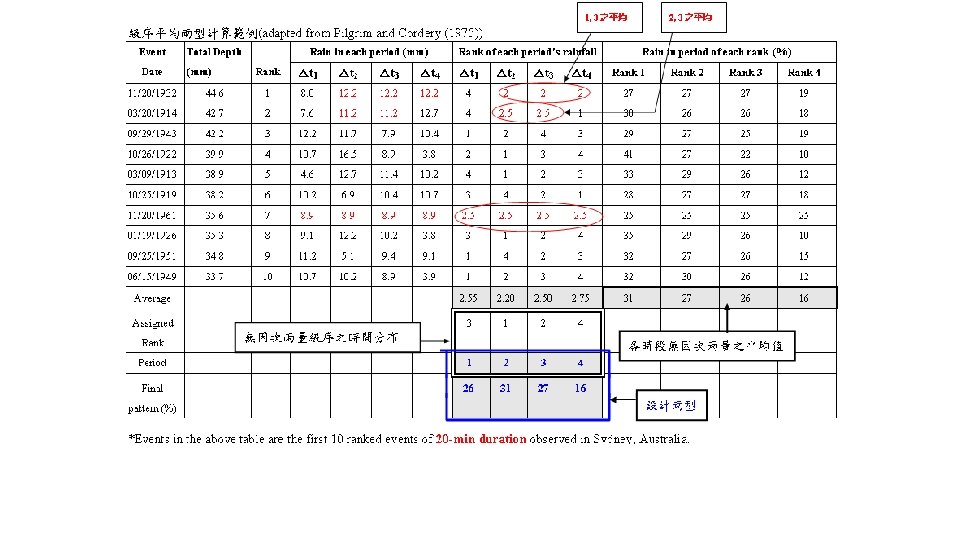
The Average Rank Model • Pilgrim and Cordery (1975) • Gather rainfall data of several largest storms of a prespecified duration. • The pre-specified duration is divided into a number of equal time intervals, which are usually determined by considering the minimum time period of the subsequent rainfall-runoff modeling.
• Rank time intervals for each event according to the rainfall depth in each interval. The average ranking for each time interval is calculated using all events. • Average rankings are likely to be non-integer and are used to give an assigned rank to each time interval.
• Determine the percentage of total rainfall for each event in each of the ranked time interval for that event. Average rainfall percentages for time intervals of rank 1, 2, 3, … for all events are calculated. • Assign the average rainfall percentage of each rank to time interval of the same assigned rank.
• The average rank model is duration-specific and requires rainfall data of storm events of the same prespecified duration. Since storm duration varies significantly, it may be difficult to gather enough number of storm events of the same duration.
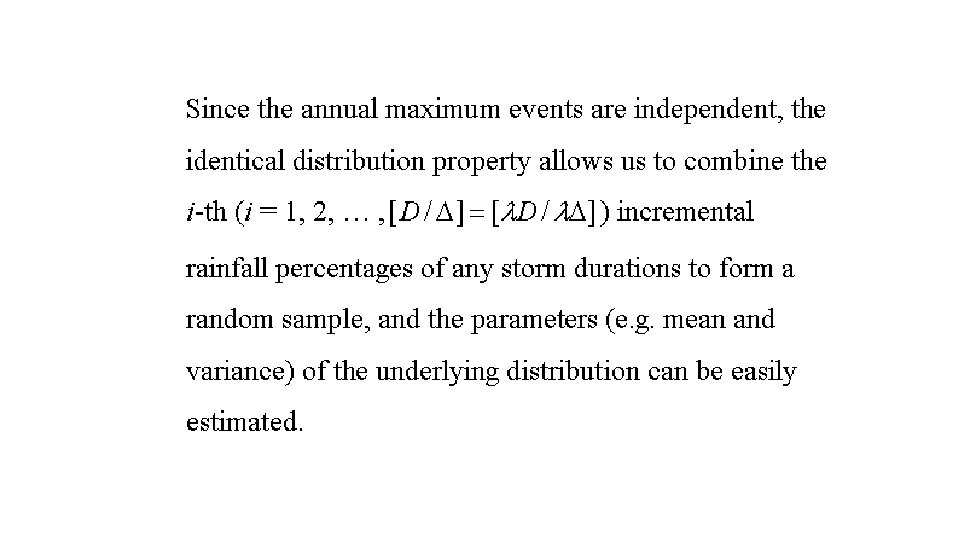
Simple-scaling Gauss-Markov Hyetograph Model (SSGM) • Because the design storm hyetograph represents the time distribution of the total storm depth determined by annual maximum rainfall data, the design storm hyetograph is optimally modeled when based on observed storm events that actually produced the annual maximum rainfall. • Therefore, it is desirable to select only observed storms that give rise to annual maximum rainfalls, the so-called annual maximum events, for development of design hyetographs.
Major storm types in Taiwan Storm Type Mei-Yu Convective Storm Period of Occurrence May - June July - October Typhoon (Cyclonic Storm) Frontal Rainfall July - October November April
Statistics for selected annual max events at two sites in Taiwan
• Using rainfall data of the annual maximum events enables us not only to focus on events of the same dominant storm type, it also has the advantage of relying on almost the same annual maximum events that are employed to construct IDF curves.
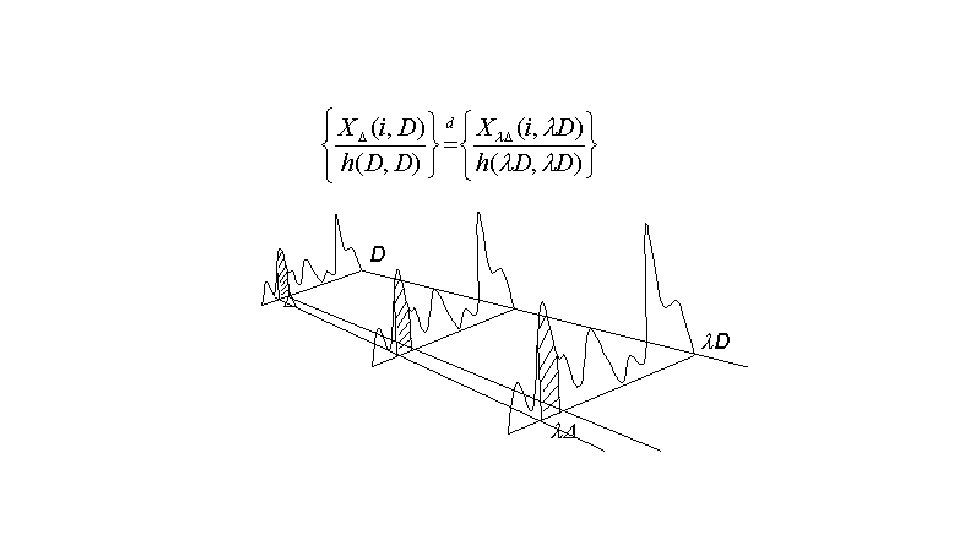
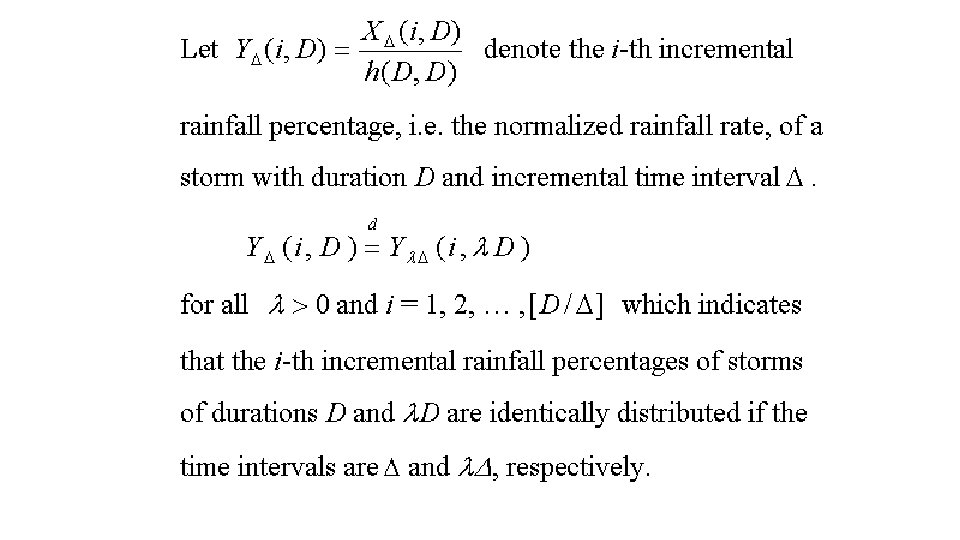
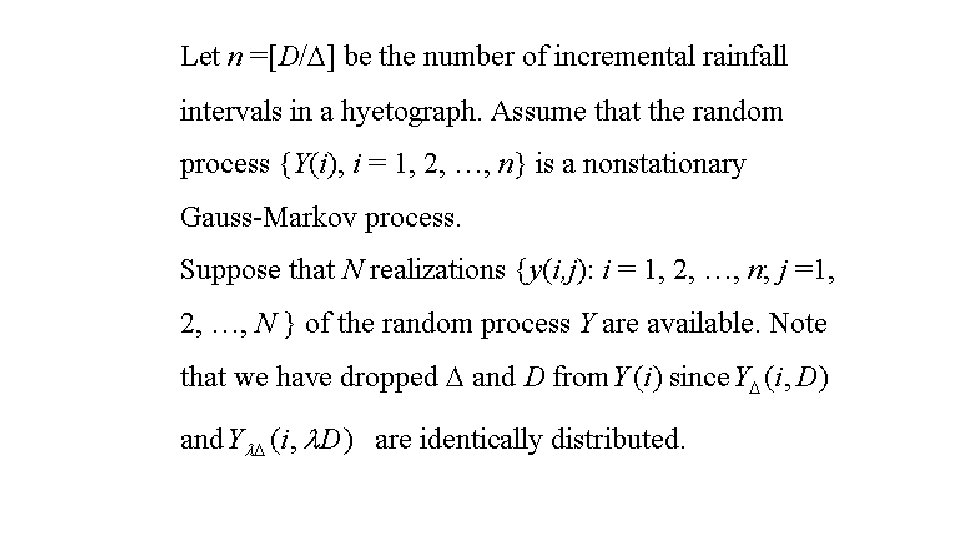
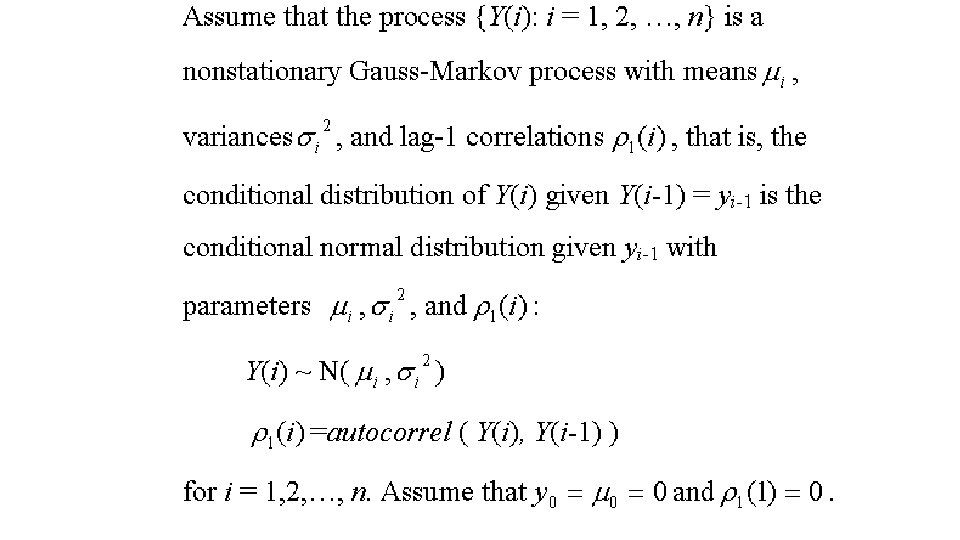
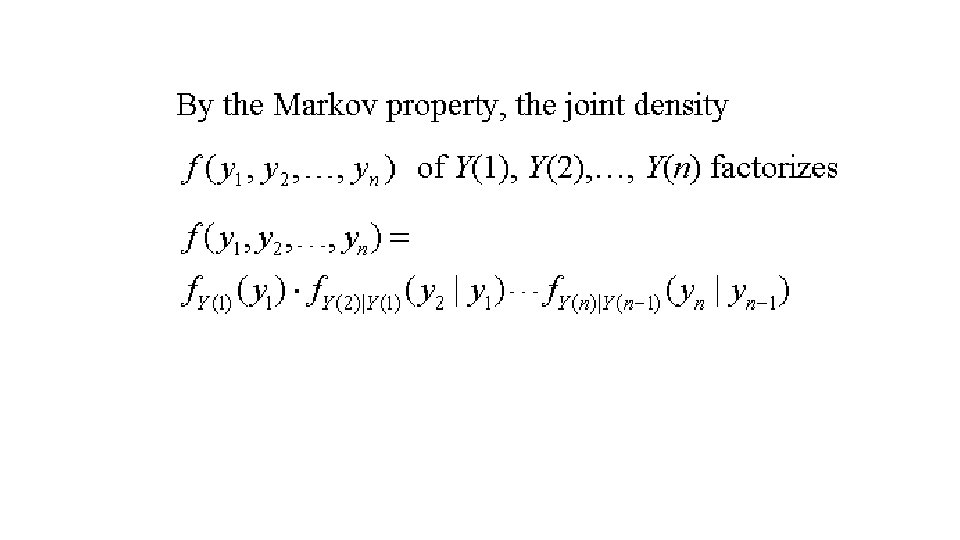
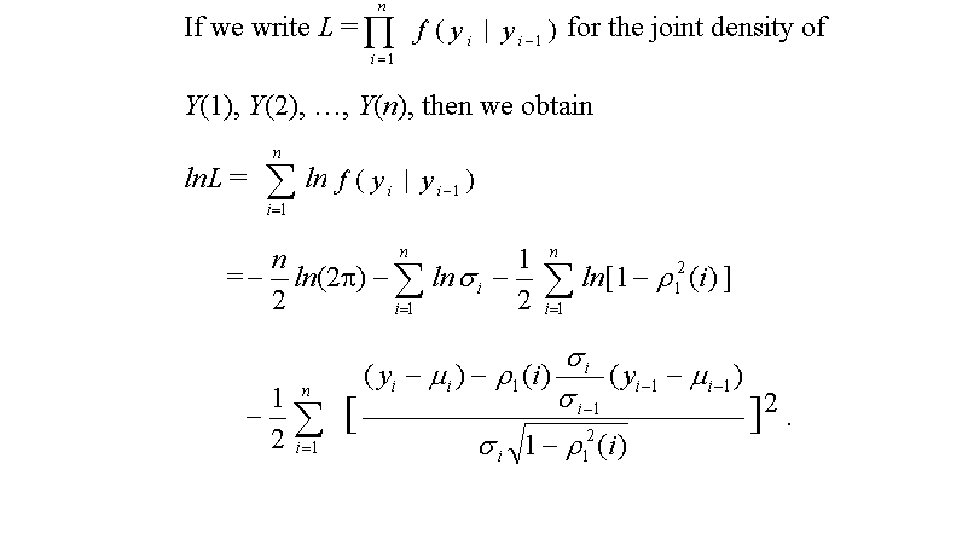
Gauss-Markov Model of Dimensionless Hyetographs
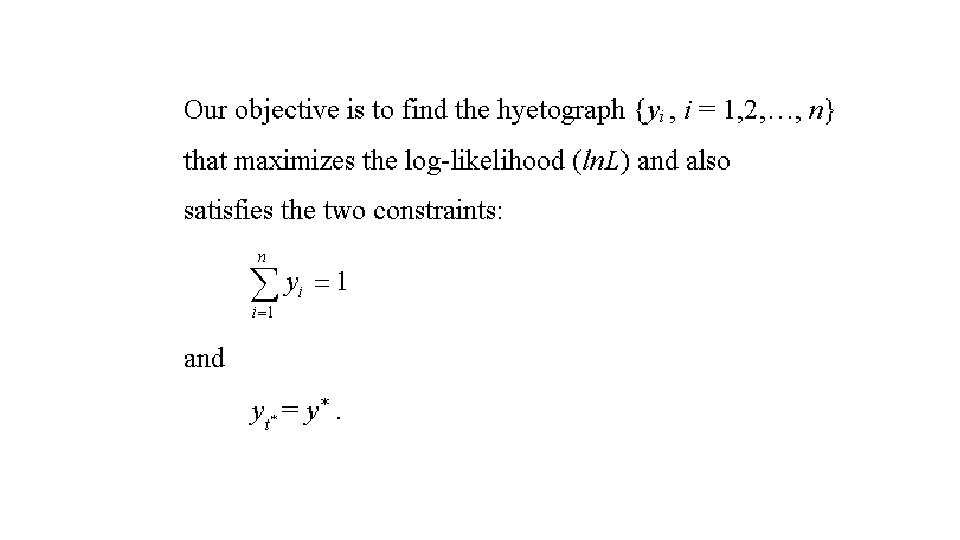
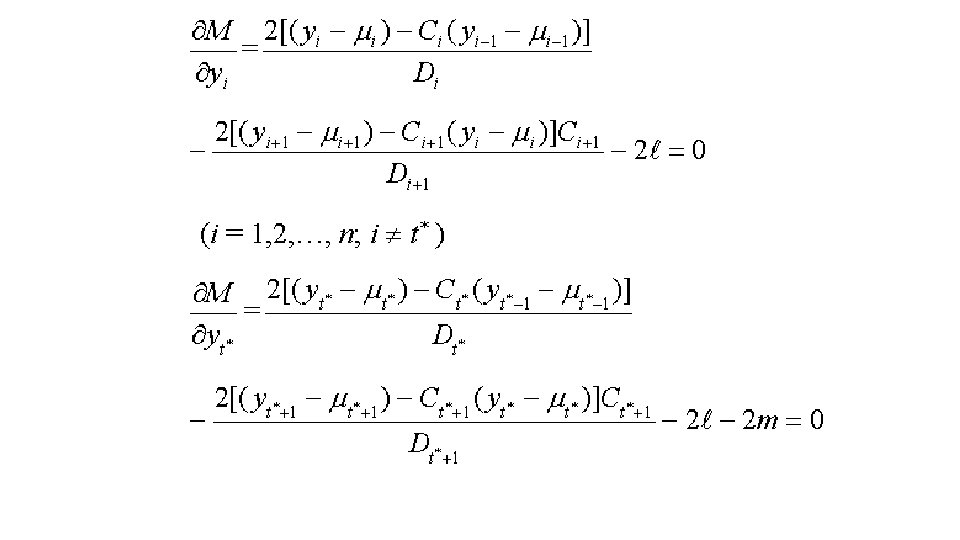
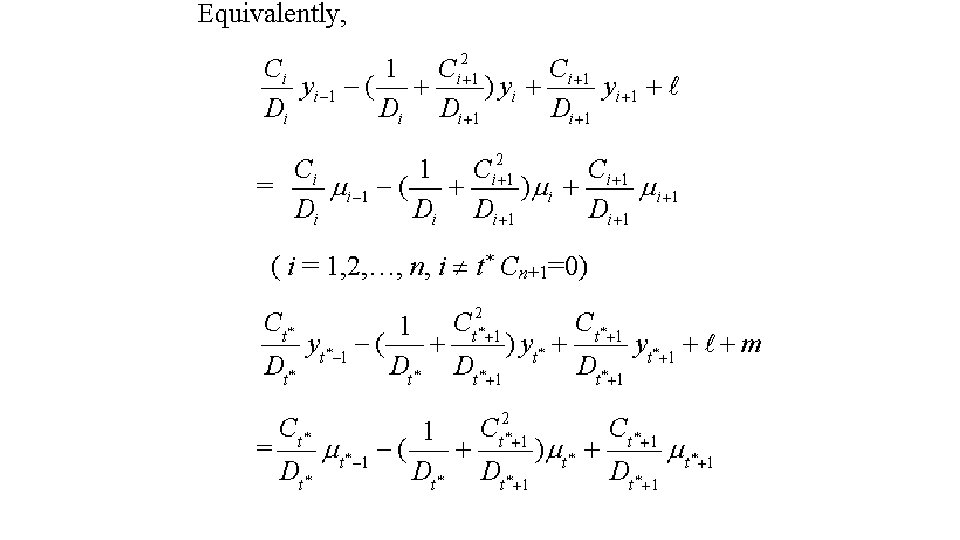
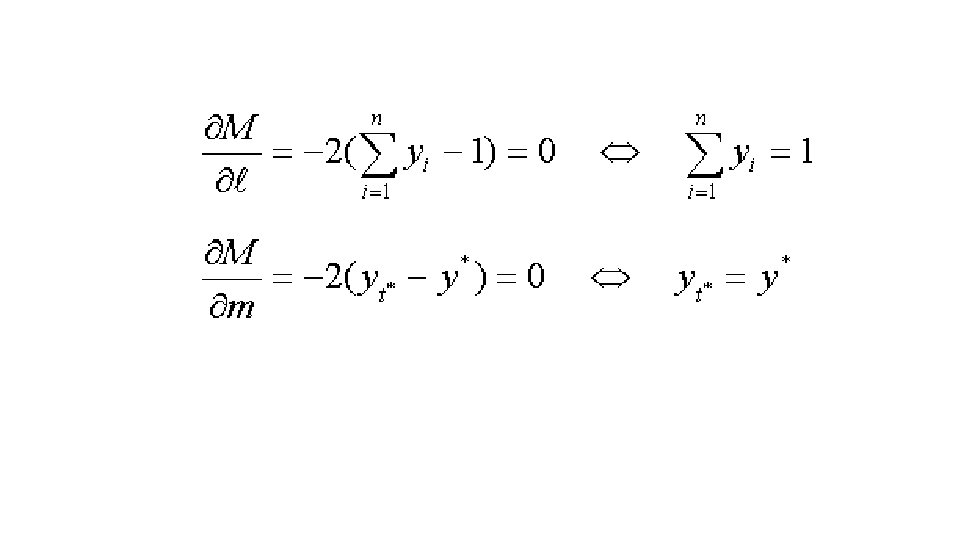
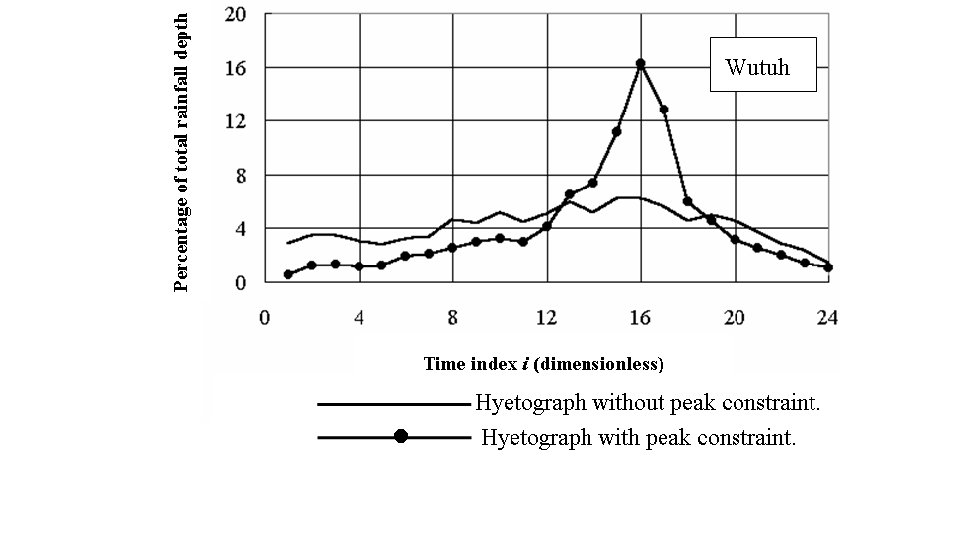
• Because the peak rainfall depth is a key element in hydrologic design, an ideal hyetograph should not only describe the random nature of the rainfall process but also the extreme characteristics of the peak rainfall. • Therefore, our objective is to find the incremental dimensionless hyetograph that not only represents the peak rainfall characteristics but also has the maximum likelihood of occurrence.
• Our approach to achieve this objective includes two steps: • determine the peak rainfall rate of the dimensionless hyetograph and its time of occurrence, and • find the most likely realization of the normalized rainfall process with the given peak characteristics.
The value of t* is likely to be non-integer and should be rounded to the nearest integer.
Conditional normal density
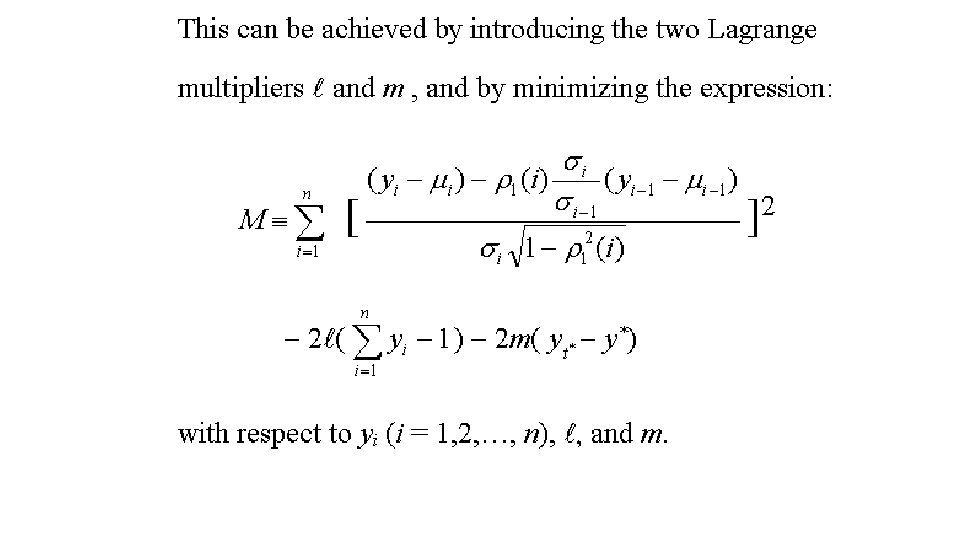
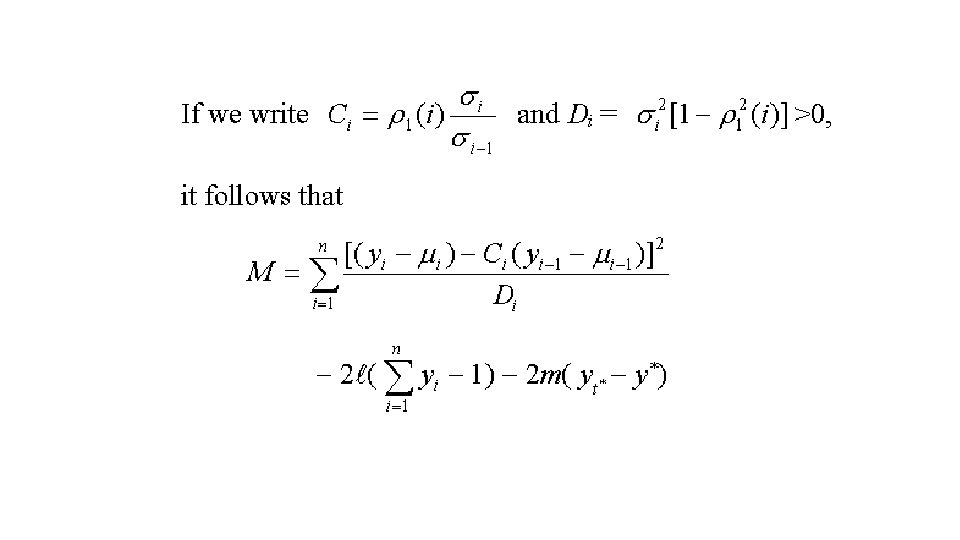
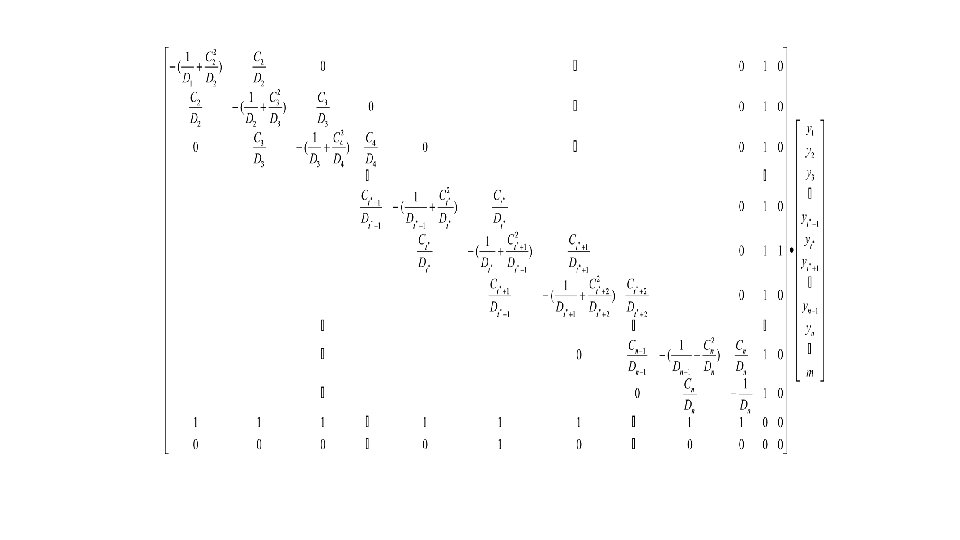
The dimensionless hyetograph {yi, i = 1, 2, …, n} is determined by solving the matrix equation.
Model Application • Scale-invariant Gauss-Markov model • Two raingauge stations Hosoliau and Wutuh, located in Northern Taiwan.
• Annual maximum events that produced annual maximum rainfall depths of 6, 12, 18, 24, 48, and 72 hour design durations were collected. • All event durations were first divided into twenty-four equal periods i (i=1, 2, …, 24, D = event duration, =D/24). • Rainfalls of each annual maximum event were normalized, with respect to the total rainfall depth and event duration.
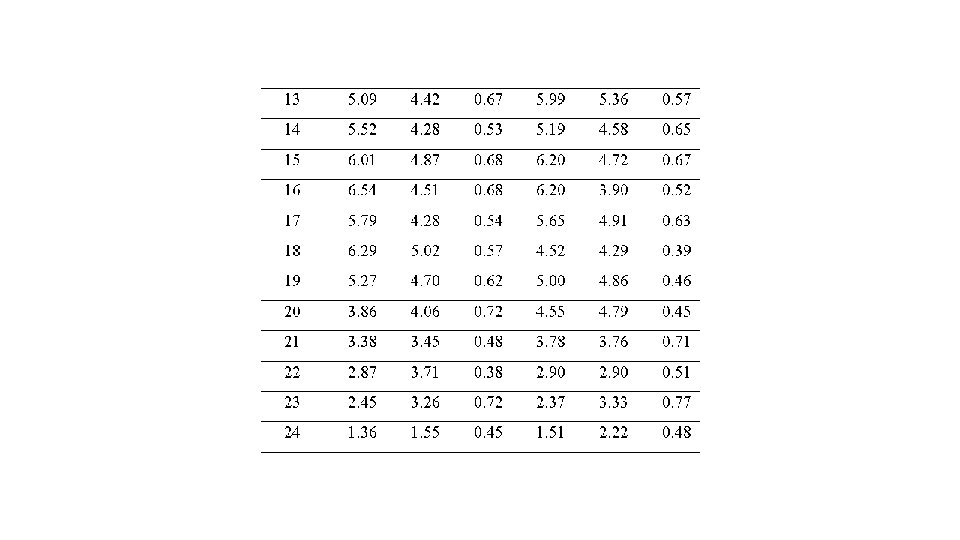
Parameters for the distributions of normalized rainfalls
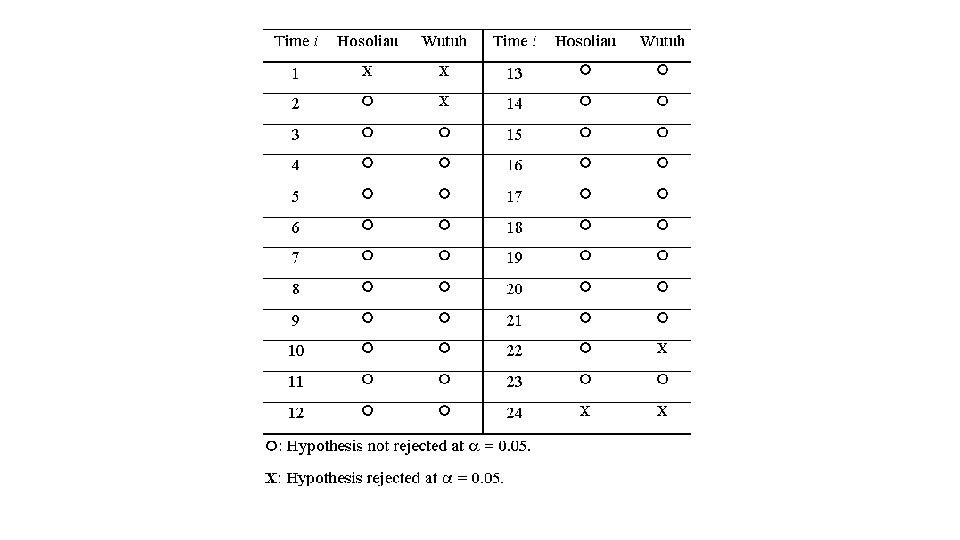
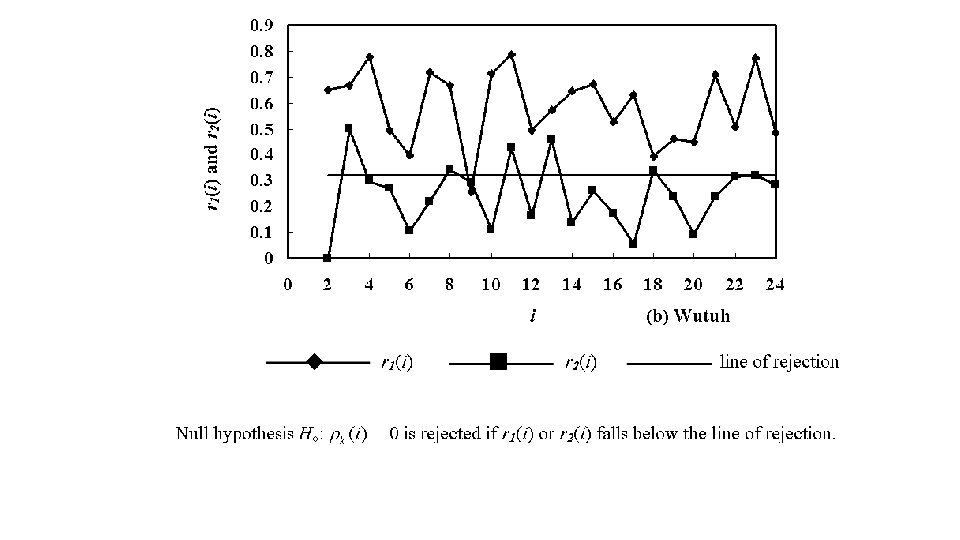
Normality check for normalized rainfalls • The Gauss-Markov model of dimensionless hyetographs considers the normalized rainfalls {Y(i), i=1, 2, …, n} as a multivariate normal distribution. • Results of the Kolmogorov-Smirnov test indicate that at = 0. 05 significance level, the null hypothesis was not rejected for most of Y(i)’s. • The few rejected normalized rainfalls occur in the beginning or near the end of an event, and have less rainfall rates.
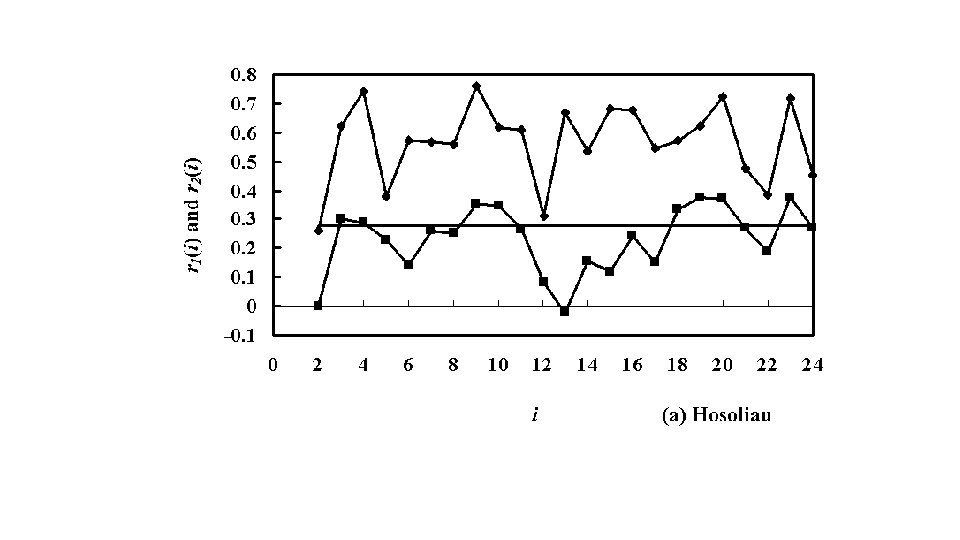
Calculation of Autocorrelation Coefficients of a Nonstationary Process
Design storm hyetographs
Translating hyetographs between storms of different durations • Some hyetograph models in the literature are durationspecific (the SCS 6 -hr and 24 -hr duration hyetographs) and return-period-specific (the alternating block method (Chow, et al. , 1988). • The simple scaling property enables us to translate the dimensionless hyetographs between design storms of different durations.
• Translating the dimensionless hyetographs between design storms of durations D and D is accomplished by changing the incremental time intervals by the duration ratio. Values of the normalized rainfalls Y(i) (i=1, 2, …, n) remain unchanged.
• For example, the incremental time intervals ( ) of the design storms of 2 -hr and 24 -hr durations are five (120/24) and sixty (1440/24) minutes, respectively. • The changes in the incremental time intervals are important since they require the subsequent rainfallrunoff modeling to be performed based on the “designated” incremental time intervals.
• A significant advantage of the simple scaling model is that developing two separate dimensionless hyetographs for design storms of 2 -hr and 24 -hr durations can be avoided. • The incremental rainfall depths of a design storm are calculated by multiplying the y-coordinates of the dimensionless hyetograph by the total depth from IDF or DDF curves.
Event Validation: 54 -08 -18
Event Validation: 63 -09 -15
Event Validation: 69 -08 -27
Event Validation: 77 -09 -16
Hyetographs of TPC’s Clustering Approach
Hyetographs of TPC’s Clustering Approach • Average hyetograph of the three major clusters (94% of total events).
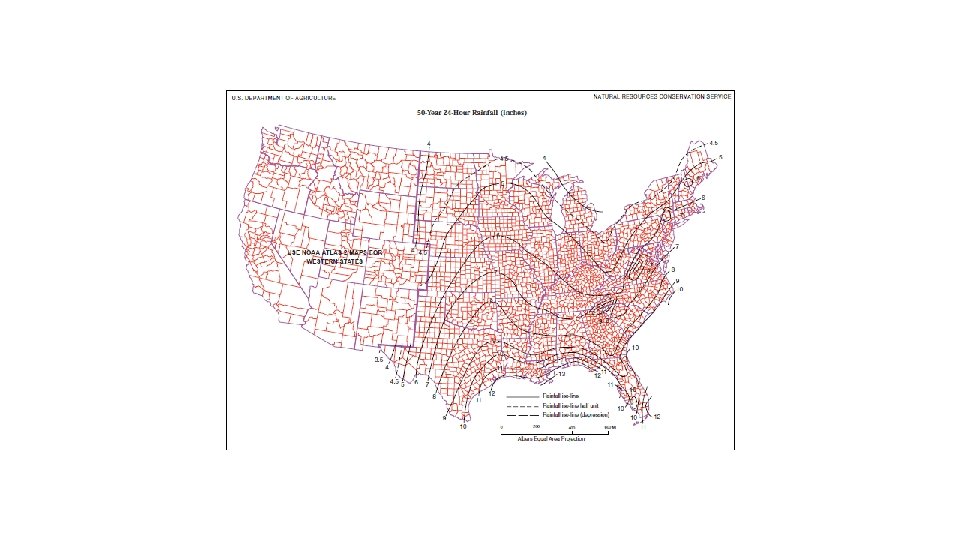
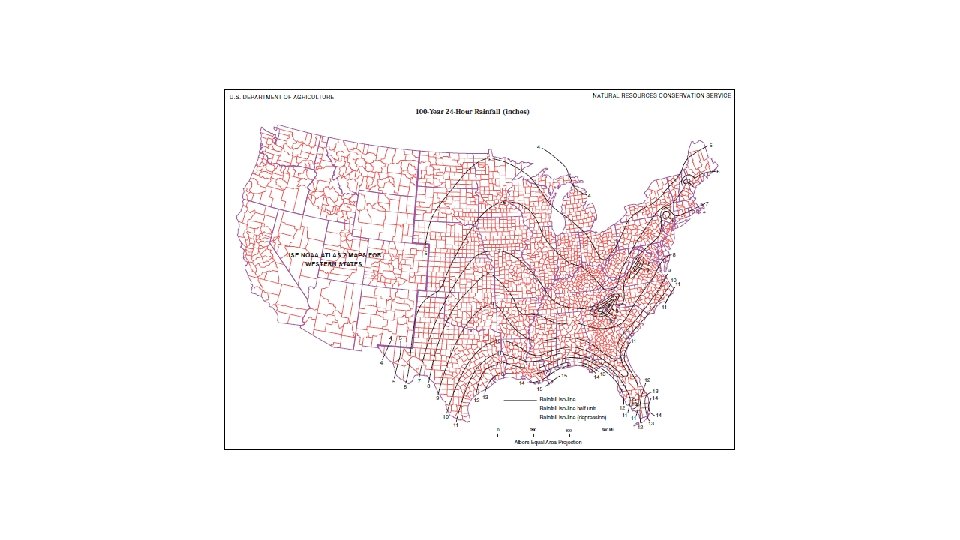
SCS Synthetic Rainfall Distributions • For the size of the drainage areas for which NRCS usually provides assistance, a storm period of 24 hours was chosen the synthetic rainfall distributions. The 24 -hour storm, while longer than that needed to determine peaks for these drainage areas, is appropriate for determining runoff volumes. Therefore, a single storm duration and associated synthetic rainfall distribution can be used to represent not only the peak discharges but also the runoff volumes for a range of drainage area sizes.
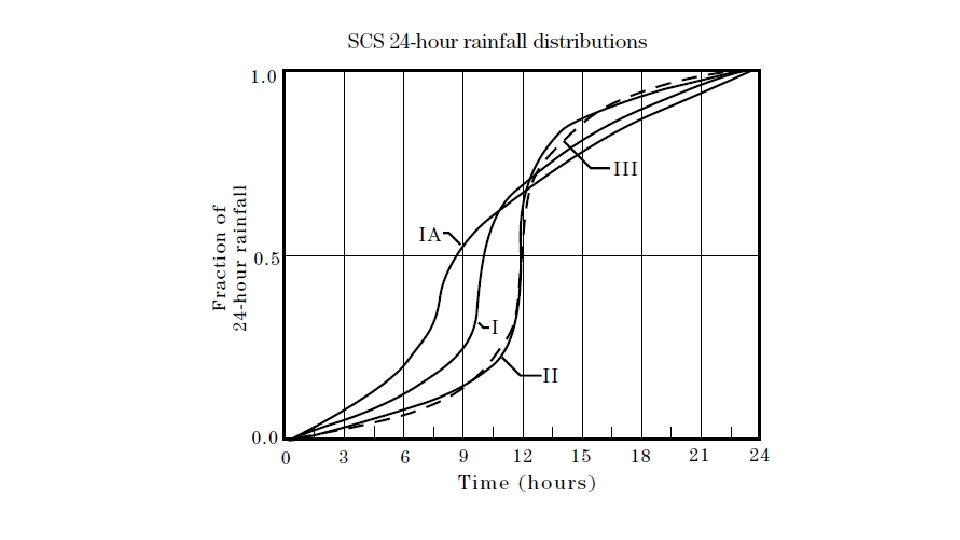
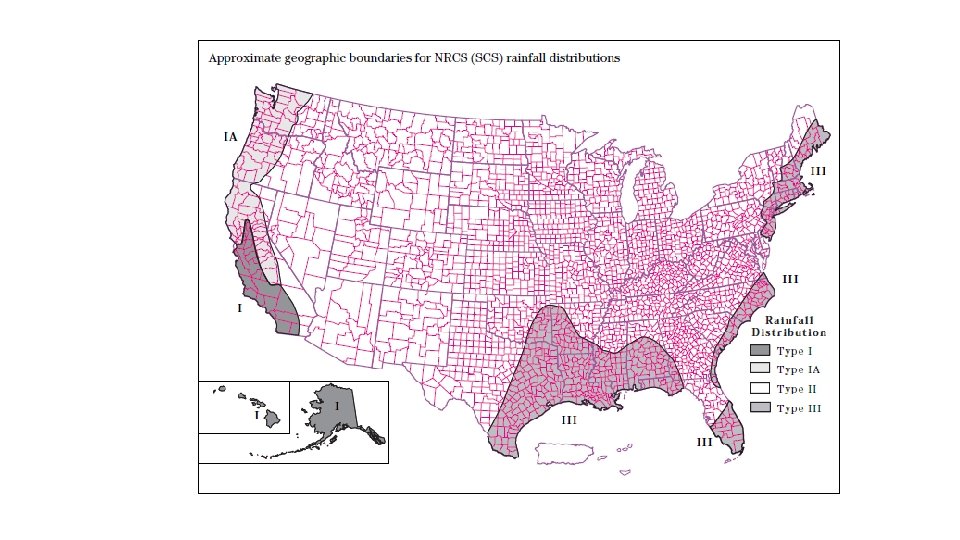
• The intensity of rainfall varies considerably during a storm as well as geographic regions. To represent various regions of the United States, NRCS developed four synthetic 24 -hour rainfall distributions (I, IA, II, and III) from available National Weather Service (NWS) duration-frequency data or local storm data. • Type IA is the least intense and type II the most intense short duration rainfall.
• Types I and IA represent the Pacific maritime climate with wet winters and dry summers. Type III represents Gulf of Mexico and Atlantic coastal areas where tropical storms bring large 24 -hour rainfall amounts. Type II represents the rest of the country. • Individual states may also have more detailed distributions.
• Executable code and data for SSGM