
Stochastic Process for MS CSE 5403 Stochastic Process
- Slides: 7
Stochastic Process for MS CSE 5403: Stochastic Process Course Teacher: Dr. A H M Kamal Course Leaner: 2 nd semester of MS 2015 -16 Cr. 3. 00
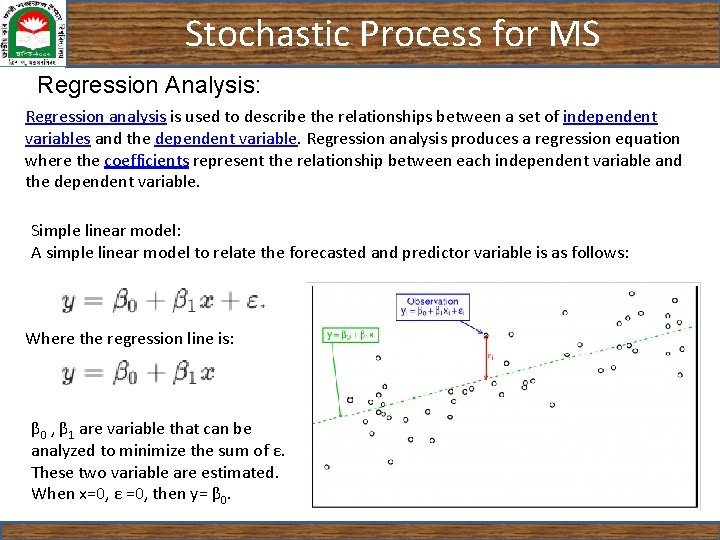
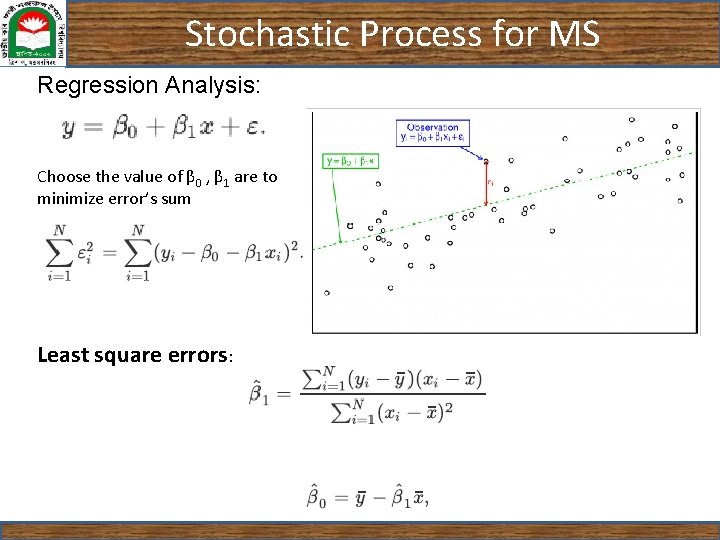
Stochastic Process for MS Regression Analysis: Regression analysis is used to describe the relationships between a set of independent variables and the dependent variable. Regression analysis produces a regression equation where the coefficients represent the relationship between each independent variable and the dependent variable. Simple linear model: A simple linear model to relate the forecasted and predictor variable is as follows: Where the regression line is: β 0 , β 1 are variable that can be analyzed to minimize the sum of ε. These two variable are estimated. When x=0, ε =0, then y= β 0.
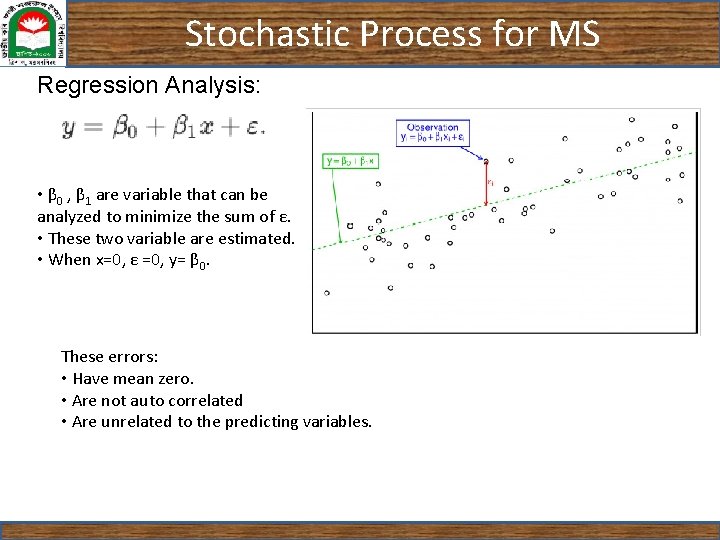
Stochastic Process for MS Regression Analysis: • β 0 , β 1 are variable that can be analyzed to minimize the sum of ε. • These two variable are estimated. • When x=0, ε =0, y= β 0. These errors: • Have mean zero. • Are not auto correlated • Are unrelated to the predicting variables.
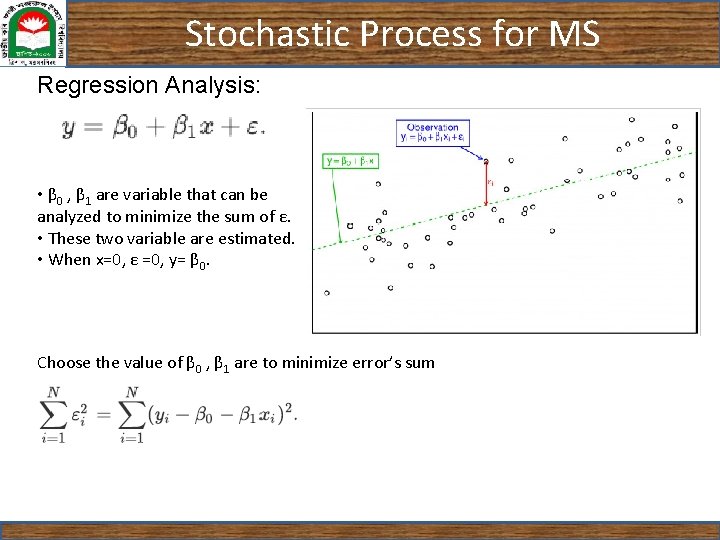
Stochastic Process for MS Regression Analysis: • β 0 , β 1 are variable that can be analyzed to minimize the sum of ε. • These two variable are estimated. • When x=0, ε =0, y= β 0. Choose the value of β 0 , β 1 are to minimize error’s sum
Stochastic Process for MS Regression Analysis: Choose the value of β 0 , β 1 are to minimize error’s sum Least square errors:
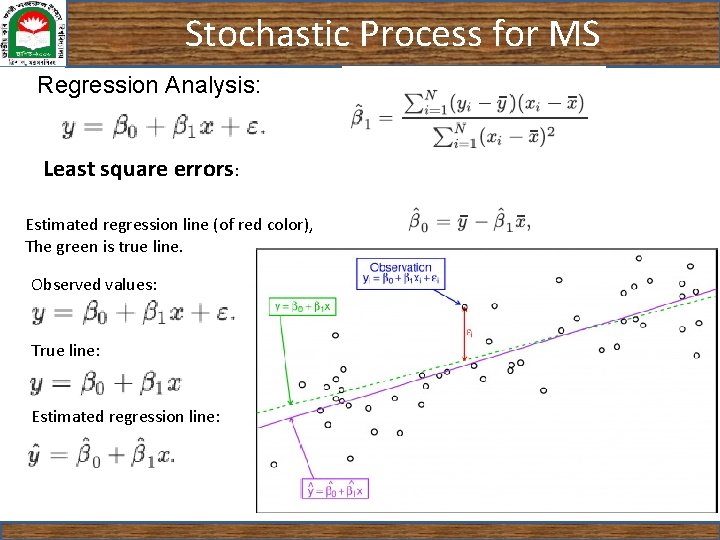
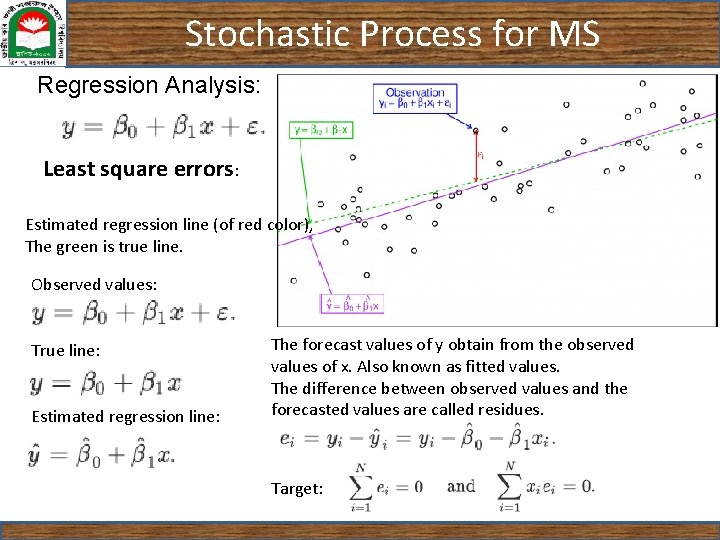
Stochastic Process for MS Regression Analysis: Least square errors: Estimated regression line (of red color), The green is true line. Observed values: True line: Estimated regression line:
Stochastic Process for MS Regression Analysis: Least square errors: Estimated regression line (of red color), The green is true line. Observed values: True line: Estimated regression line: The forecast values of y obtain from the observed values of x. Also known as fitted values. The difference between observed values and the forecasted values are called residues. Target: