
HYDROLOGY Lecture 10 Unit Hydrograph ASSOC PROF DR



- Slides: 48
HYDROLOGY Lecture 10 Unit Hydrograph ASSOC. PROF. DR. TARK AN ERDIK
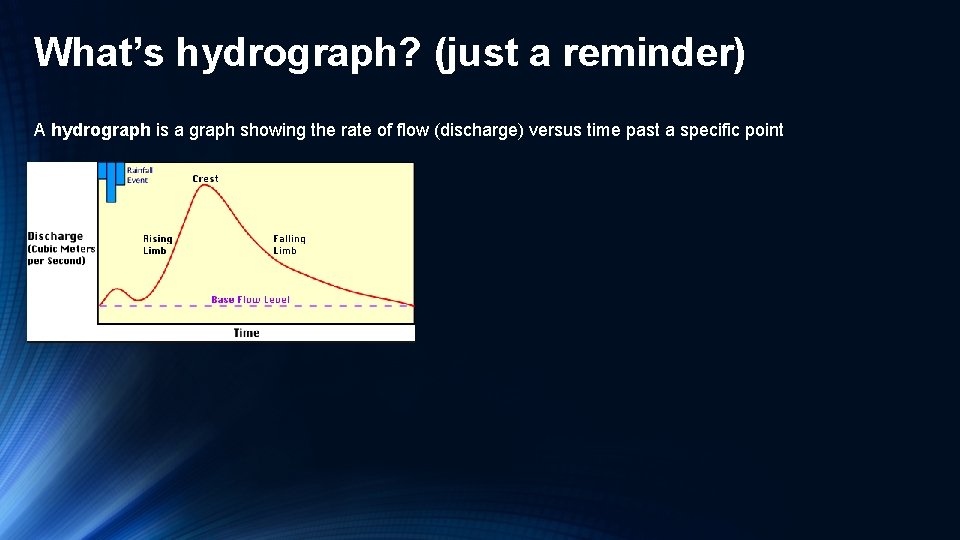
What’s hydrograph? (just a reminder) A hydrograph is a graph showing the rate of flow (discharge) versus time past a specific point
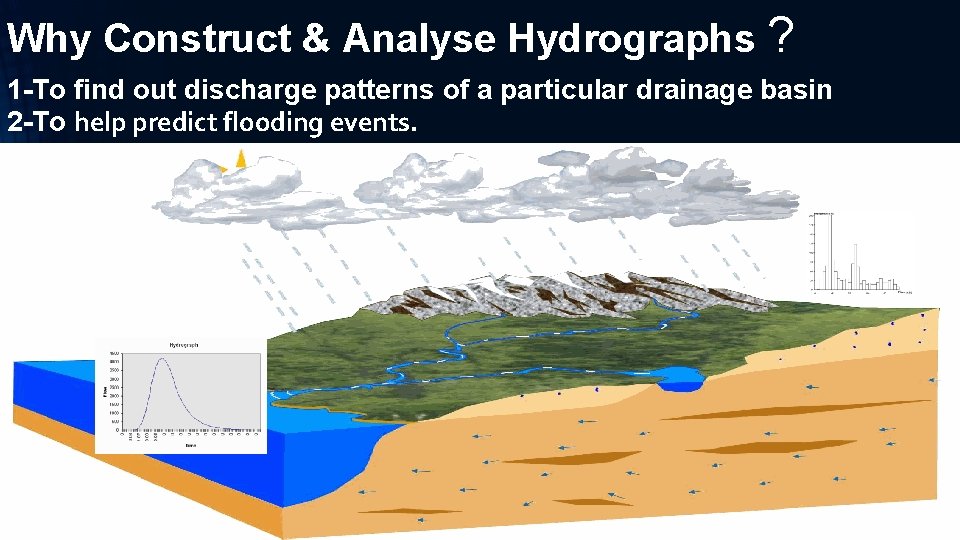
Why Construct & Analyse Hydrographs ? 1 -To find out discharge patterns of a particular drainage basin 2 -To help predict flooding events.
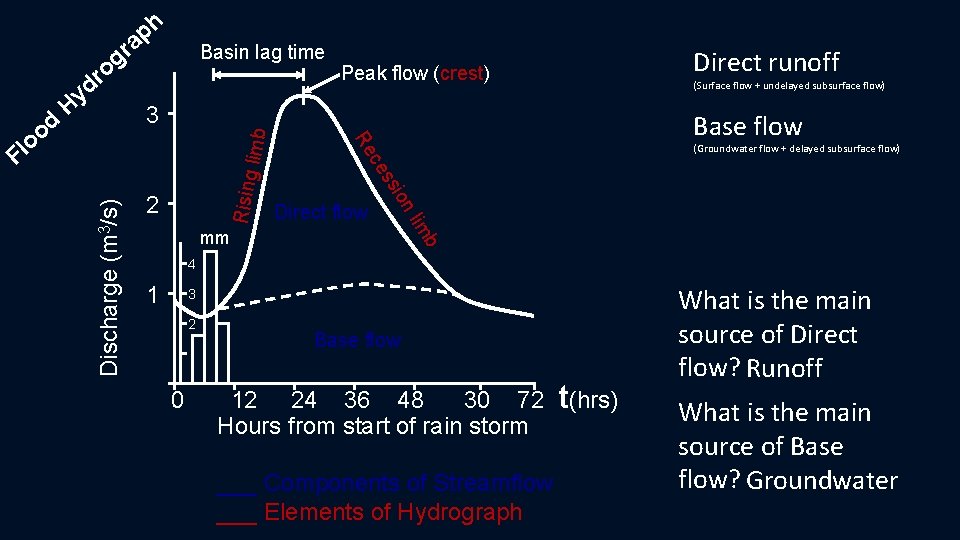
Basin lag time limb 3 (Surface flow + undelayed subsurface flow) Base flow (Groundwater flow + delayed subsurface flow) b mm lim Direct flow ion 2 Direct runoff ss Rising o l F Discharge (m 3/s) Peak flow (crest) ce Re od yd H h p a r g o r 4 1 3 2 Base flow 0 12 24 36 48 30 72 t(hrs) Hours from start of rain storm ___ Components of Streamflow ___ Elements of Hydrograph What is the main source of Direct flow? Runoff What is the main source of Base flow? Groundwater
Discharge (m 3/s) 3 2 1 0 12 24 36 48 30 72 Hours from start of rain storm
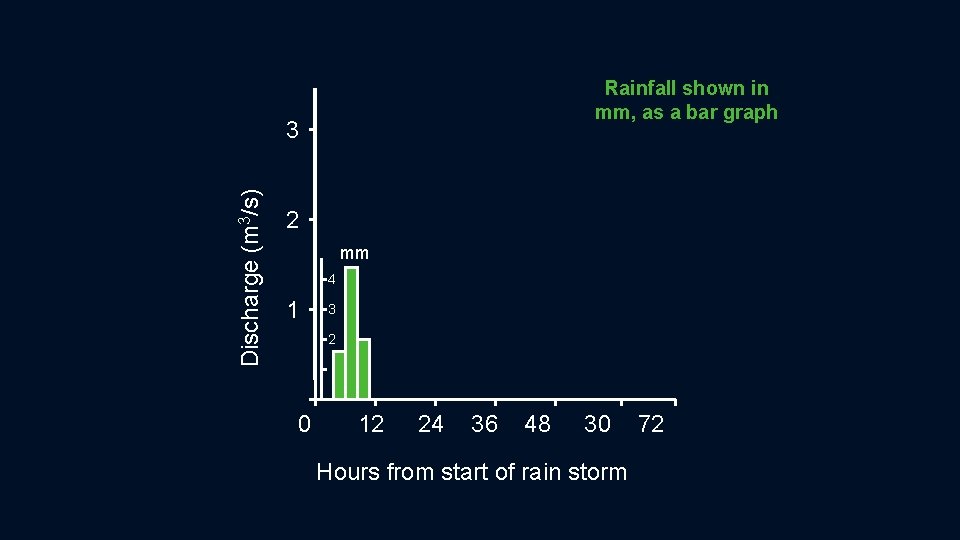
Rainfall shown in mm, as a bar graph Discharge (m 3/s) 3 2 mm 4 1 3 2 0 12 24 36 48 30 72 Hours from start of rain storm
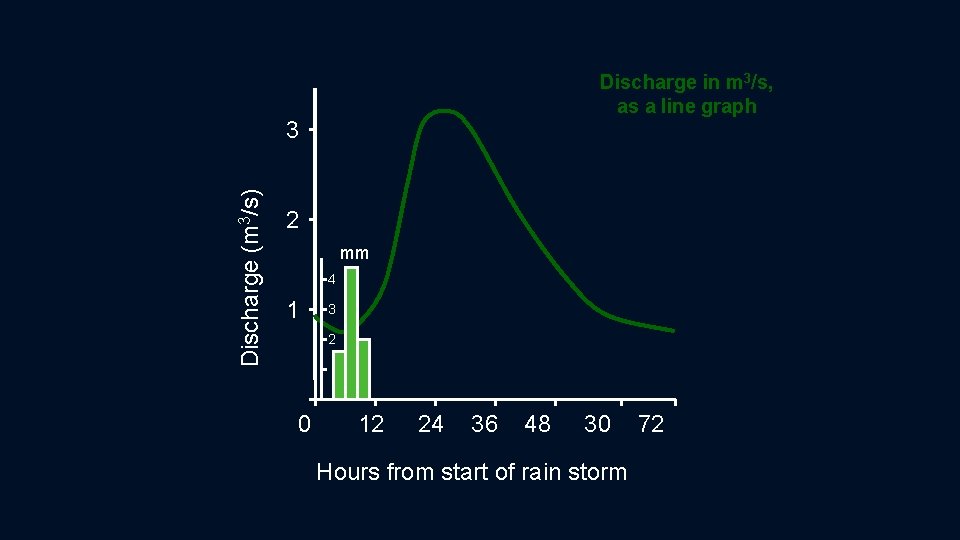
Discharge in m 3/s, as a line graph Discharge (m 3/s) 3 2 mm 4 1 3 2 0 12 24 36 48 30 72 Hours from start of rain storm
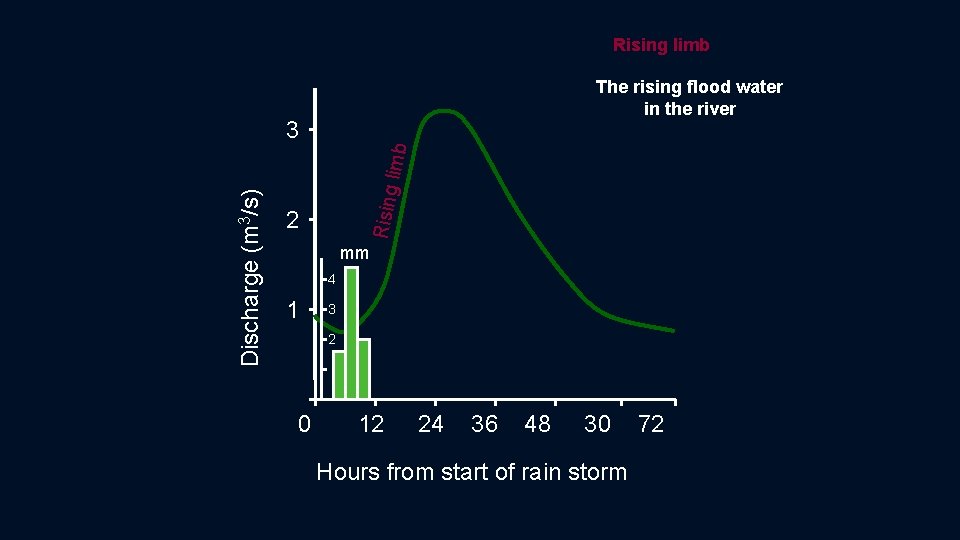
Rising limb The rising flood water in the river Rising Discharge (m 3/s) limb 3 2 mm 4 1 3 2 0 12 24 36 48 30 72 Hours from start of rain storm
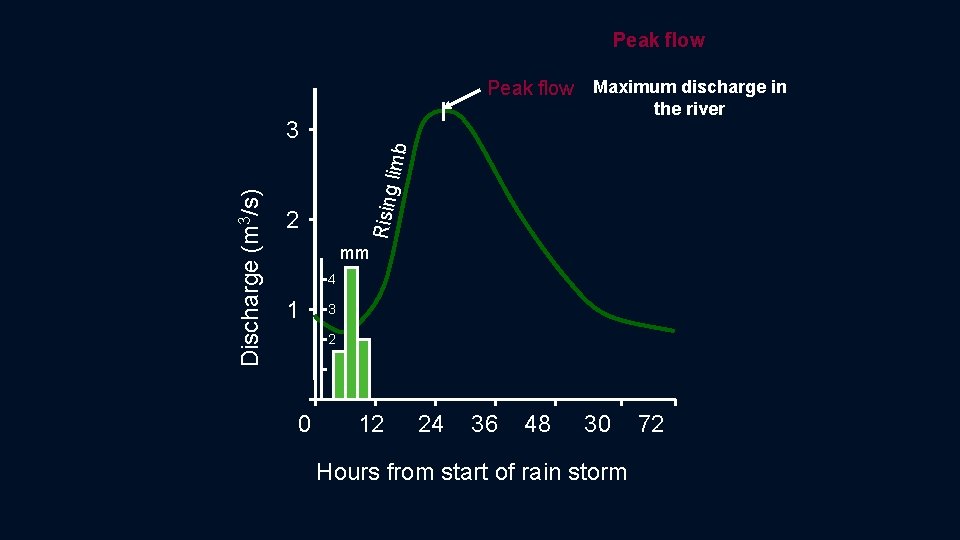
Peak flow Maximum discharge in the river Rising Discharge (m 3/s) limb 3 2 mm 4 1 3 2 0 12 24 36 48 30 72 Hours from start of rain storm
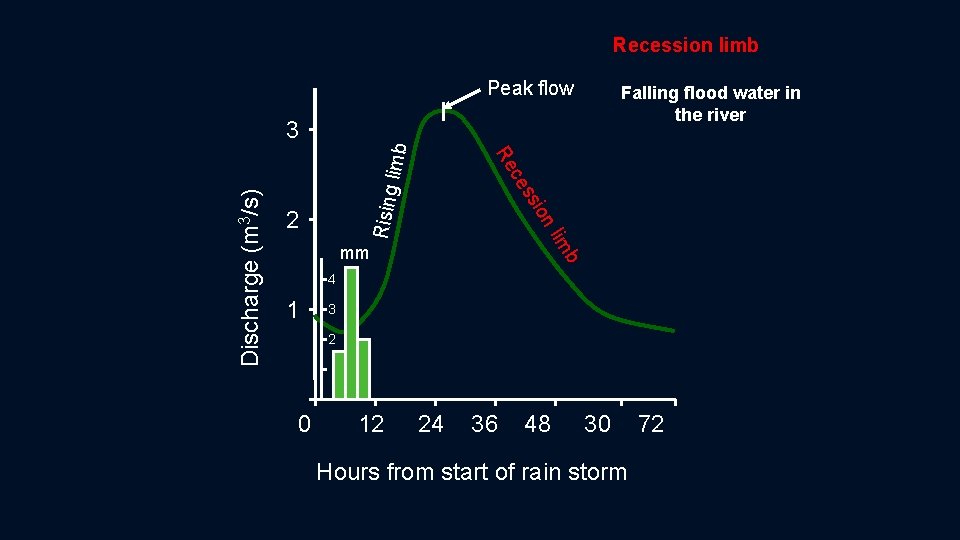
Recession limb Peak flow Rising Discharge (m 3/s) b lim ion mm ss 2 ce Re limb 3 Falling flood water in the river 4 1 3 2 0 12 24 36 48 30 72 Hours from start of rain storm
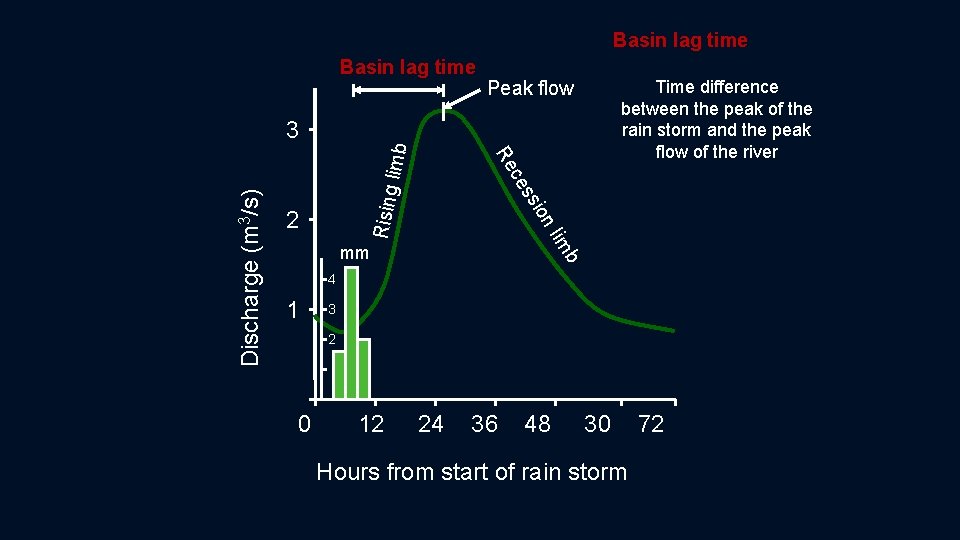
Basin lag time Peak flow Rising Discharge (m 3/s) b im n l sio mm s ce 2 Re limb 3 Time difference between the peak of the rain storm and the peak flow of the river 4 1 3 2 0 12 24 36 48 30 72 Hours from start of rain storm
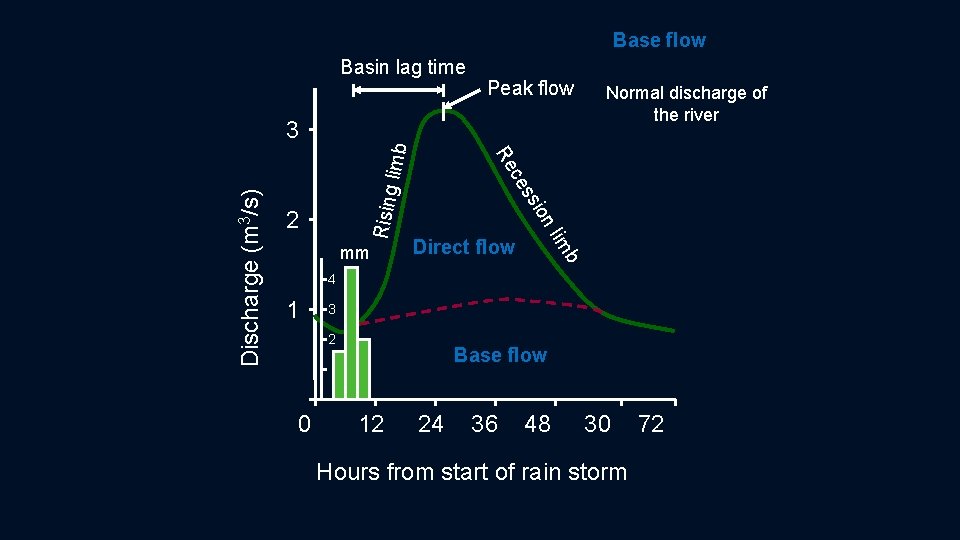
Base flow Basin lag time Peak flow Rising Discharge (m 3/s) b im Direct flow n l sio mm s ce 2 Re limb 3 Normal discharge of the river 4 1 3 2 Base flow 0 12 24 36 48 30 72 Hours from start of rain storm
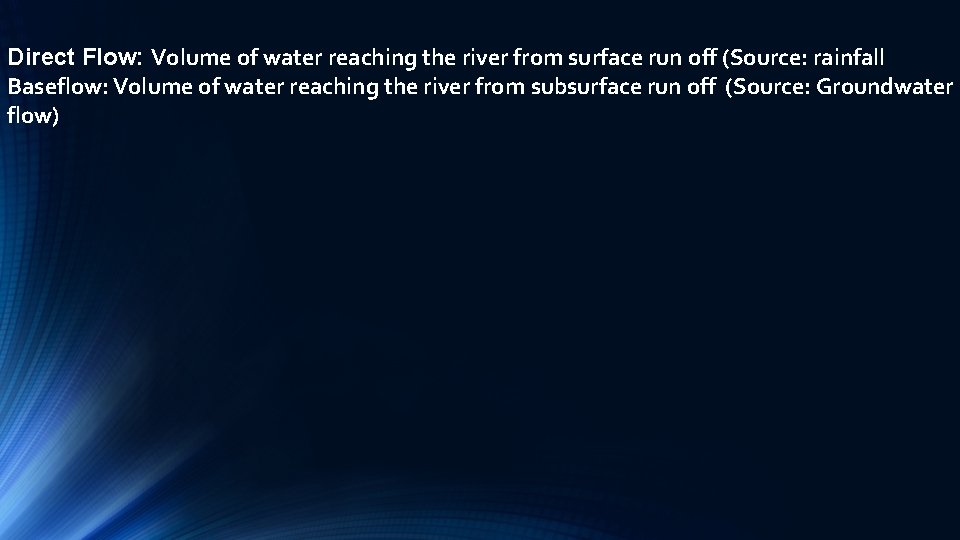
Direct Flow: Volume of water reaching the river from surface run off (Source: rainfall Baseflow: Volume of water reaching the river from subsurface run off (Source: Groundwater flow)
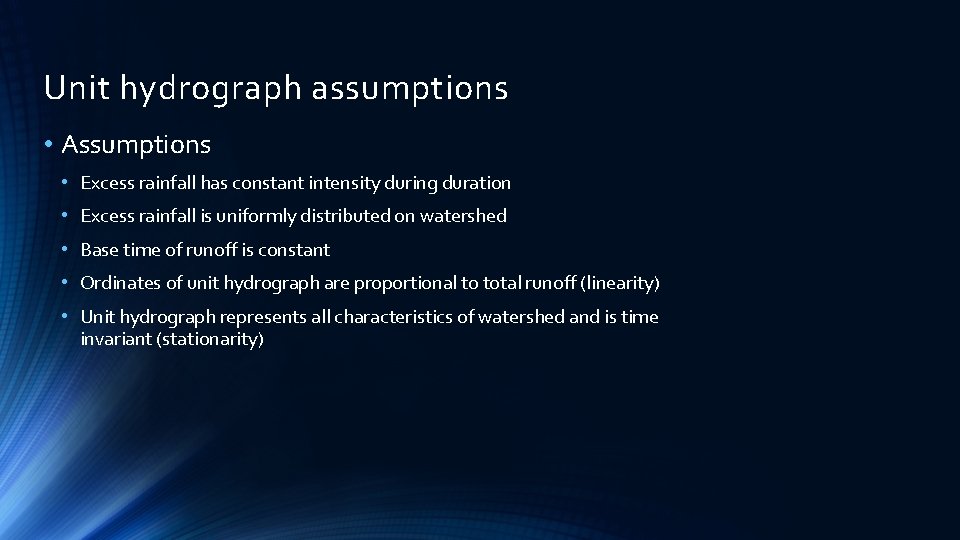
Unit hydrograph assumptions • Assumptions • Excess rainfall has constant intensity during duration • Excess rainfall is uniformly distributed on watershed • Base time of runoff is constant • Ordinates of unit hydrograph are proportional to total runoff (linearity) • Unit hydrograph represents all characteristics of watershed and is time invariant (stationarity)
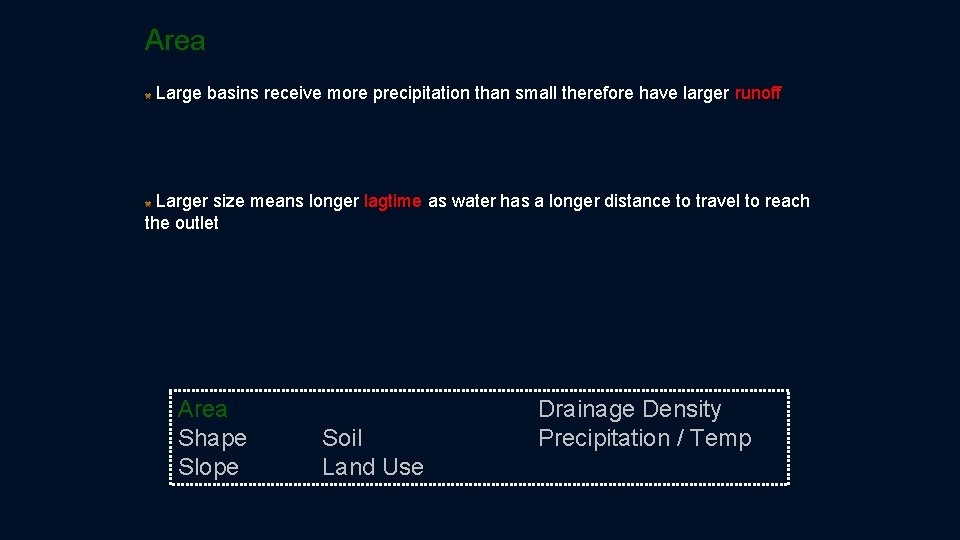
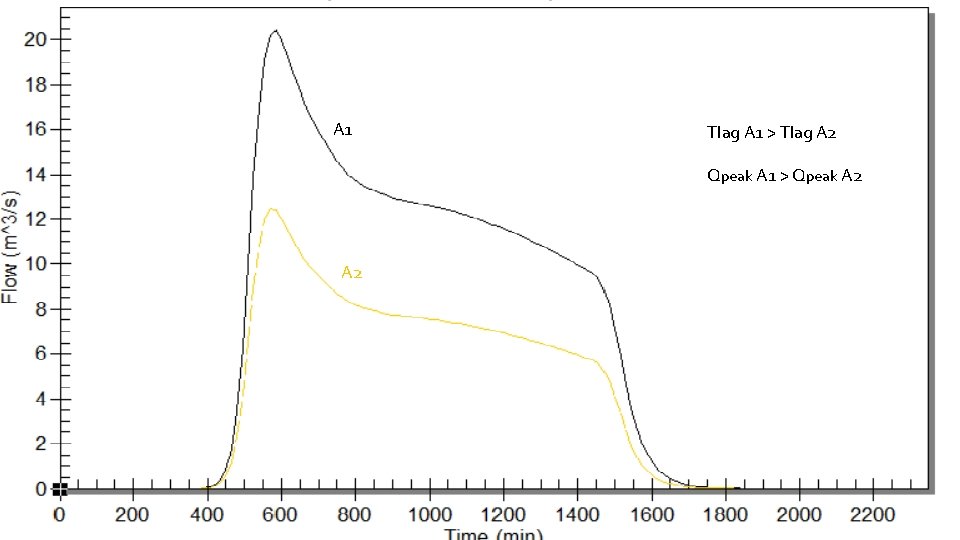
Area Large basins receive more precipitation than small therefore have larger runoff Larger size means longer lagtime as water has a longer distance to travel to reach the outlet Area Shape Slope Soil Land Use Drainage Density Precipitation / Temp
A 1 Tlag A 1 > Tlag A 2 Qpeak A 1 > Qpeak A 2
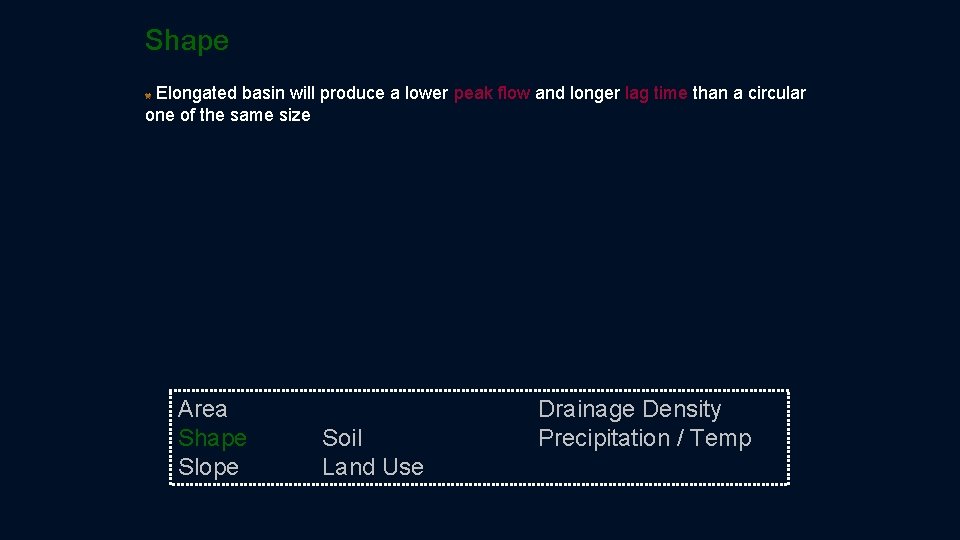
Shape Elongated basin will produce a lower peak flow and longer lag time than a circular one of the same size Area Shape Slope Soil Land Use Drainage Density Precipitation / Temp
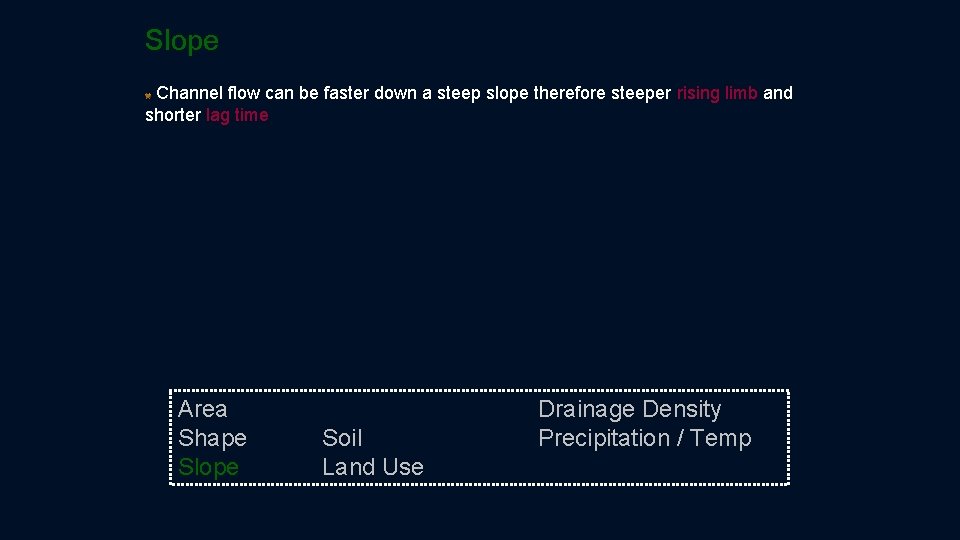
Slope Channel flow can be faster down a steep slope therefore steeper rising limb and shorter lag time Area Shape Slope Soil Land Use Drainage Density Precipitation / Temp
Soil The more infiltration occurs the longer the lag time and shallower the rising limb Area Shape Slope Soil Land Use Drainage Density Precipitation / Temp
Land Use Urbanisation - concrete and tarmac form impermeable surfaces, creating a steep rising limb and shortening the time lag Afforestation - intercepts the precipitation, creating a shallow rising limb and lengthening the time lag Area Shape Slope Soil Land Use Drainage Density Precipitation / Temp
Drainage Density A higher density will allow rapid overland flow Area Shape Slope Soil Land Use Drainage Density Precipitation / Temp
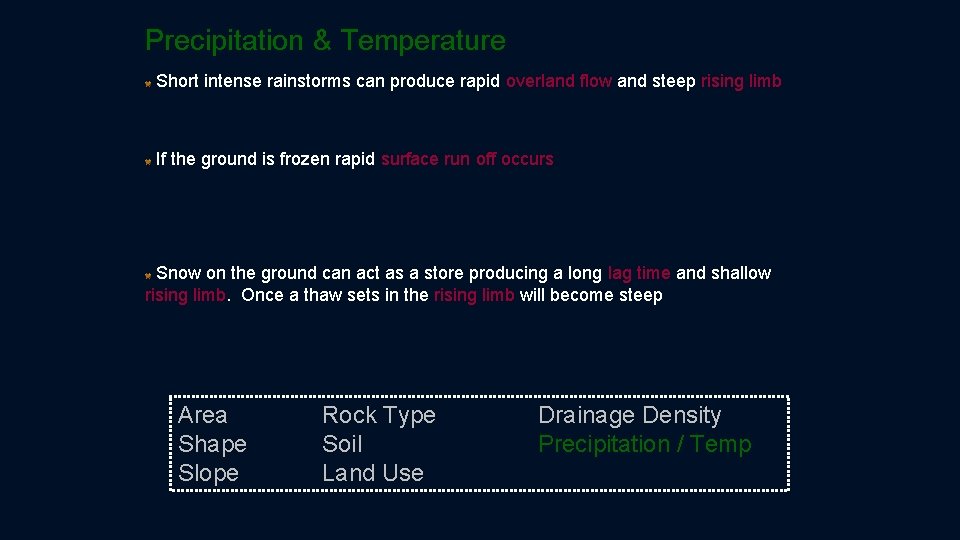
Precipitation & Temperature Short intense rainstorms can produce rapid overland flow and steep rising limb If the ground is frozen rapid surface run off occurs Snow on the ground can act as a store producing a long lag time and shallow rising limb. Once a thaw sets in the rising limb will become steep Area Shape Slope Rock Type Soil Land Use Drainage Density Precipitation / Temp
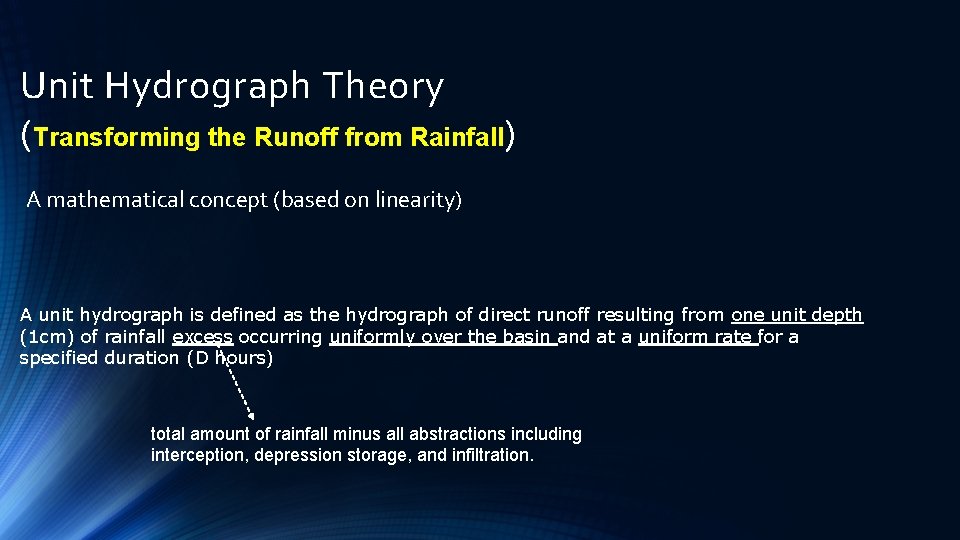
Unit Hydrograph Theory (Transforming the Runoff from Rainfall) A mathematical concept (based on linearity) A unit hydrograph is defined as the hydrograph of direct runoff resulting from one unit depth (1 cm) of rainfall excess occurring uniformly over the basin and at a uniform rate for a specified duration (D hours) total amount of rainfall minus all abstractions including interception, depression storage, and infiltration.
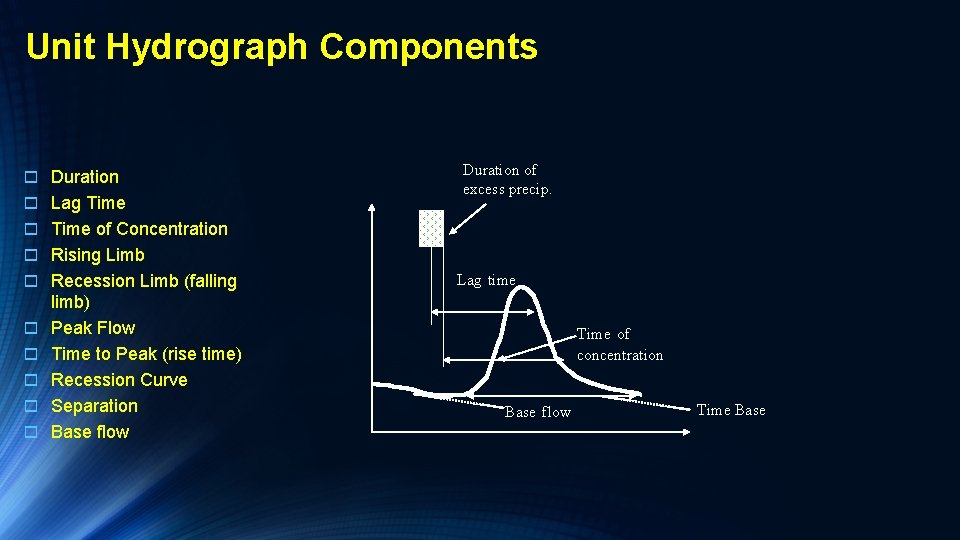
Unit Hydrograph Components o Duration o Lag Time Duration of excess precip. o Time of Concentration o Rising Limb o Recession Limb (falling o o o limb) Peak Flow Time to Peak (rise time) Recession Curve Separation Base flow Lag time Time of concentration Base flow Time Base
Derived Unit Hydrograph
Derived Unit Hydrograph
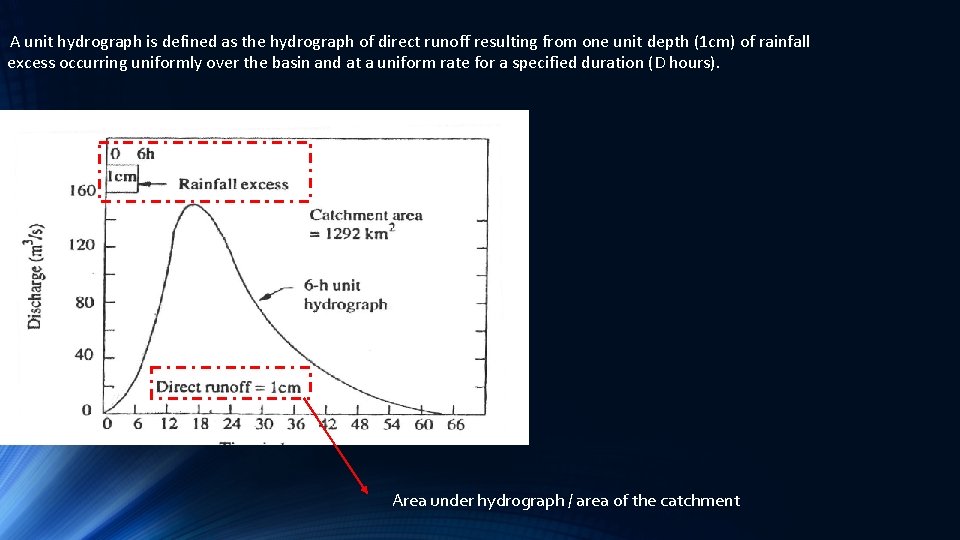
A unit hydrograph is defined as the hydrograph of direct runoff resulting from one unit depth (1 cm) of rainfall excess occurring uniformly over the basin and at a uniform rate for a specified duration (D hours). Area under hydrograph / area of the catchment
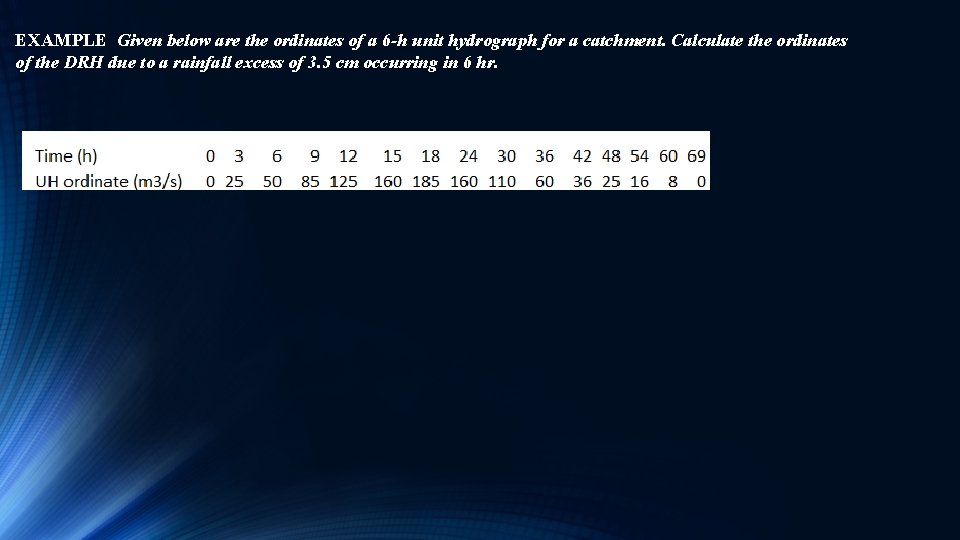
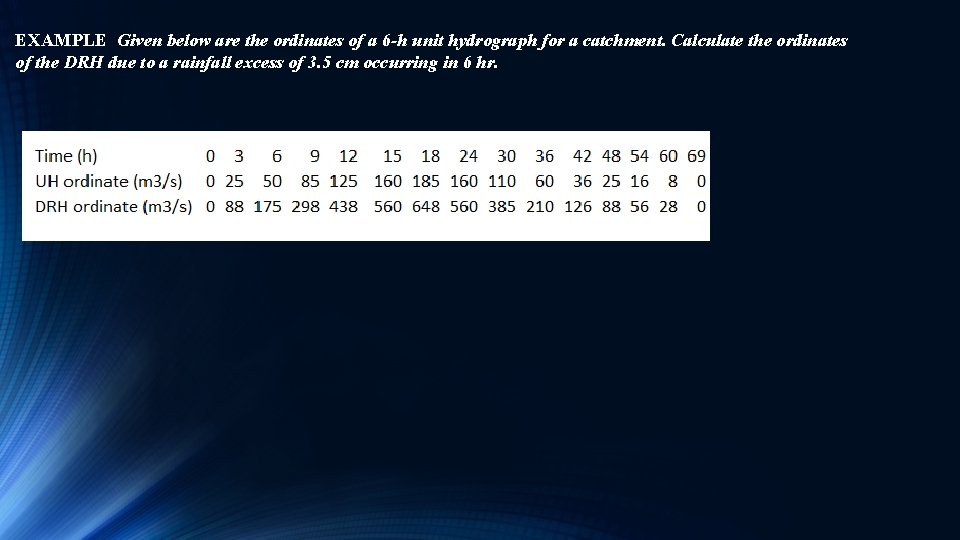
EXAMPLE Given below are the ordinates of a 6 -h unit hydrograph for a catchment. Calculate the ordinates of the DRH due to a rainfall excess of 3. 5 cm occurring in 6 hr.
EXAMPLE Given below are the ordinates of a 6 -h unit hydrograph for a catchment. Calculate the ordinates of the DRH due to a rainfall excess of 3. 5 cm occurring in 6 hr.
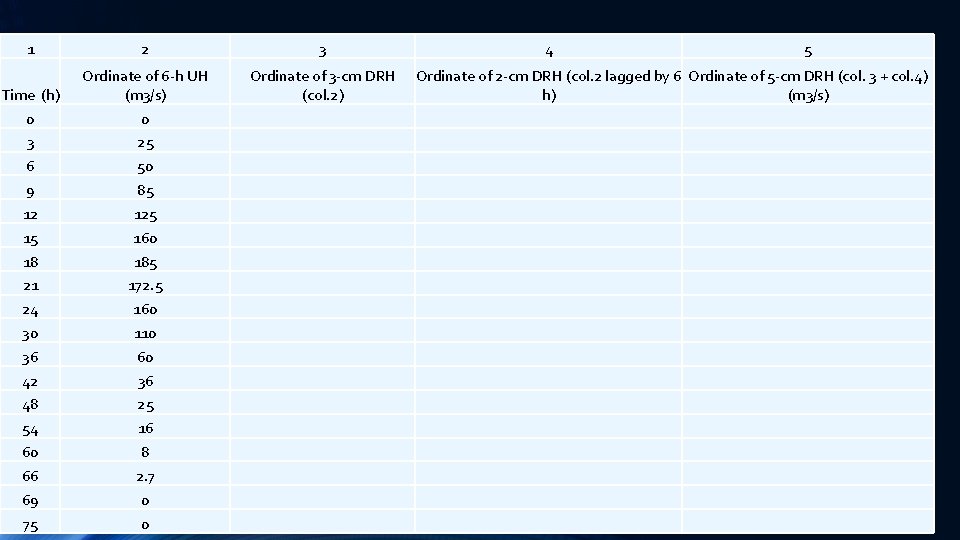
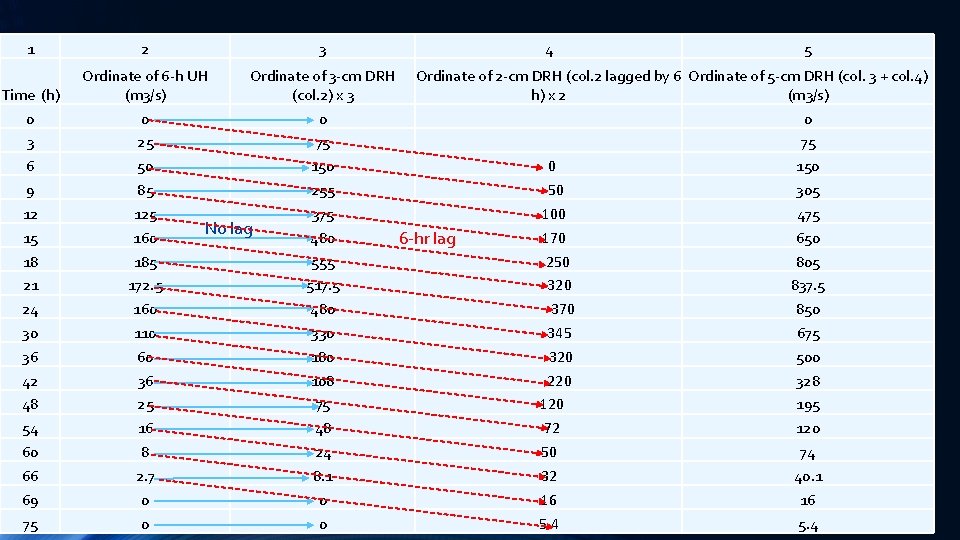
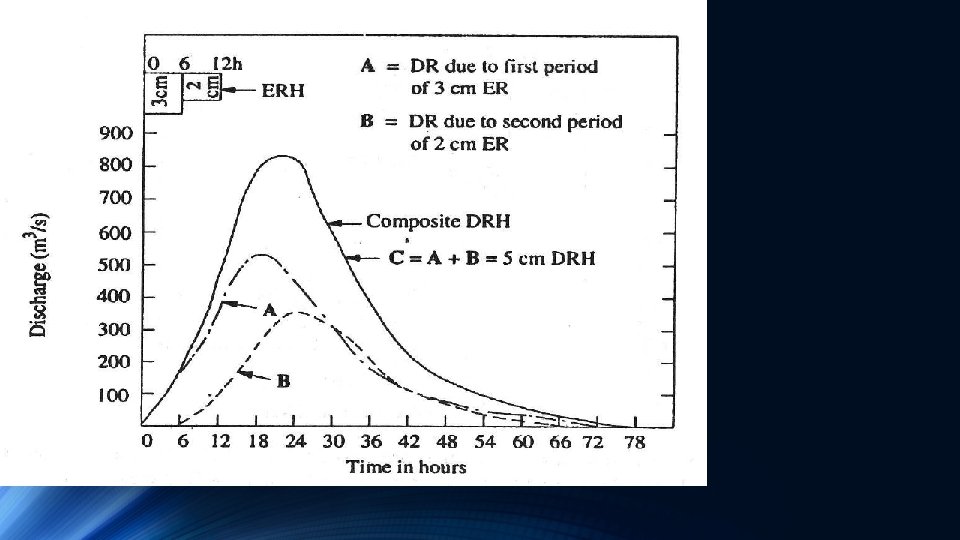
Exercise 2: Two storms each of 6 -h duration and having rainfall excess values of 3. 0 and 2. 0 cm, respectively occur successively. The 6 -h unit hydrograph for the catchment is the same as given in the table below. Please calculate the resulting DRH
1 2 Time (h) 0 3 6 9 12 15 18 21 24 30 36 42 48 54 60 66 69 75 Ordinate of 6 -h UH (m 3/s) 0 25 50 85 125 160 185 172. 5 160 110 60 36 25 16 8 2. 7 0 0 3 4 5 Ordinate of 3 -cm DRH Ordinate of 2 -cm DRH (col. 2 lagged by 6 Ordinate of 5 -cm DRH (col. 3 + col. 4) (col. 2) h) (m 3/s)
1 Time (h) 0 3 6 9 12 15 18 21 24 30 36 42 48 54 60 66 69 75 2 3 4 5 Ordinate of 6 -h UH Ordinate of 3 -cm DRH Ordinate of 2 -cm DRH (col. 2 lagged by 6 Ordinate of 5 -cm DRH (col. 3 + col. 4) (m 3/s) (col. 2) x 3 h) x 2 (m 3/s) 0 0 0 25 75 75 50 150 85 255 50 305 125 375 100 475 No lag 160 480 170 650 6 -hr lag 185 555 250 805 172. 5 517. 5 320 837. 5 160 480 370 850 110 330 345 675 60 180 320 500 36 108 220 328 25 75 120 195 16 48 72 120 8 24 50 74 2. 7 8. 1 32 40. 1 0 0 16 16 0 0 5. 4
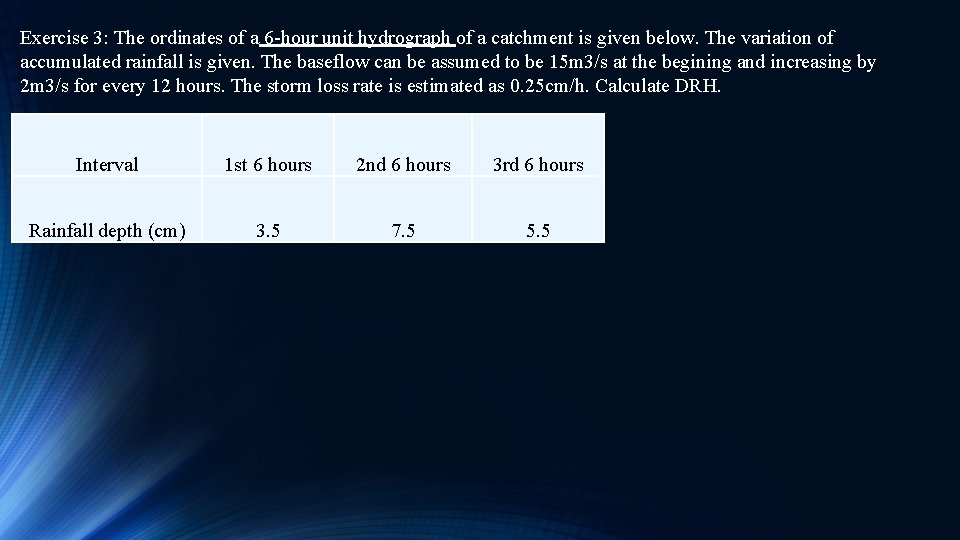
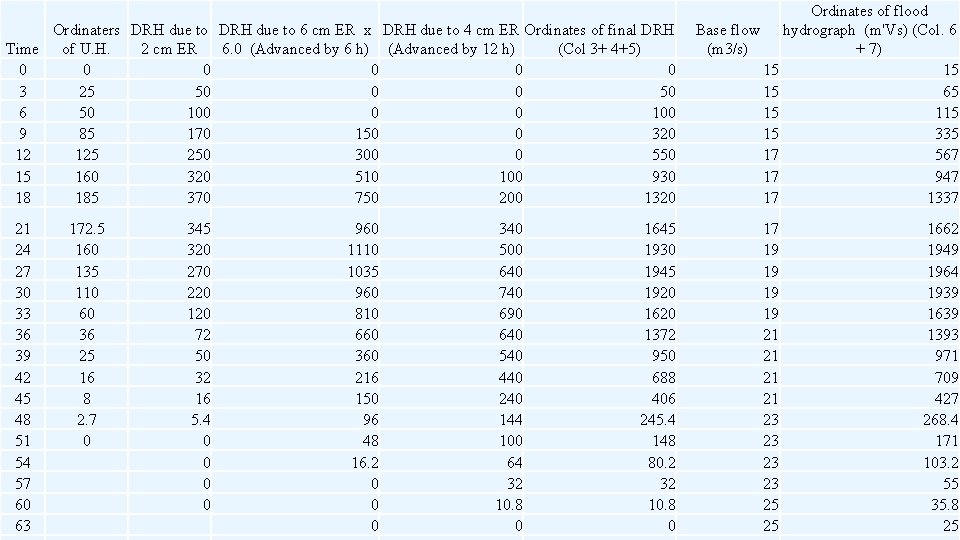
Exercise 3: The ordinates of a 6 -hour unit hydrograph of a catchment is given below. The variation of accumulated rainfall is given. The baseflow can be assumed to be 15 m 3/s at the begining and increasing by 2 m 3/s for every 12 hours. The storm loss rate is estimated as 0. 25 cm/h. Calculate DRH. Interval 1 st 6 hours 2 nd 6 hours 3 rd 6 hours Rainfall depth (cm) 3. 5 7. 5 5. 5
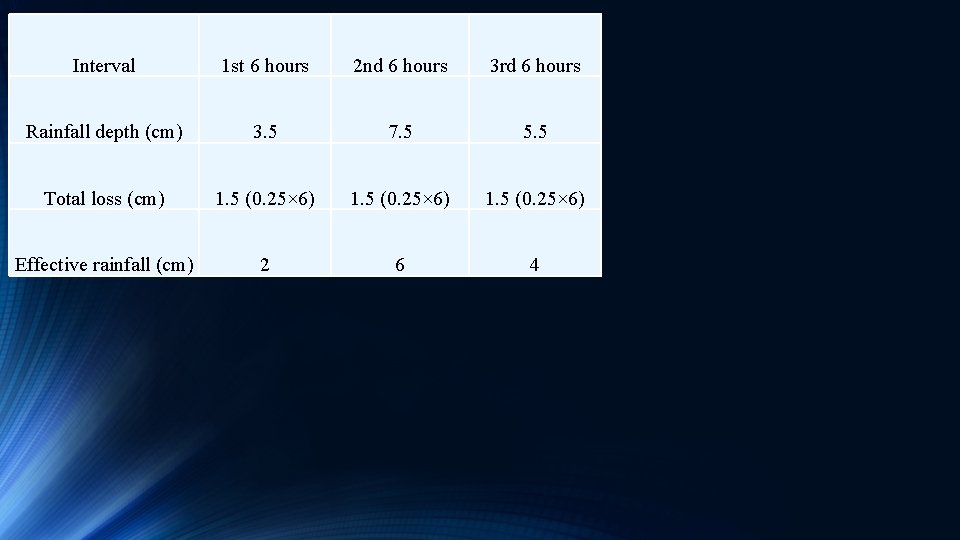
Interval 1 st 6 hours 2 nd 6 hours 3 rd 6 hours Rainfall depth (cm) 3. 5 7. 5 5. 5 Total loss (cm) 1. 5 (0. 25× 6) Effective rainfall (cm) 2 6 4
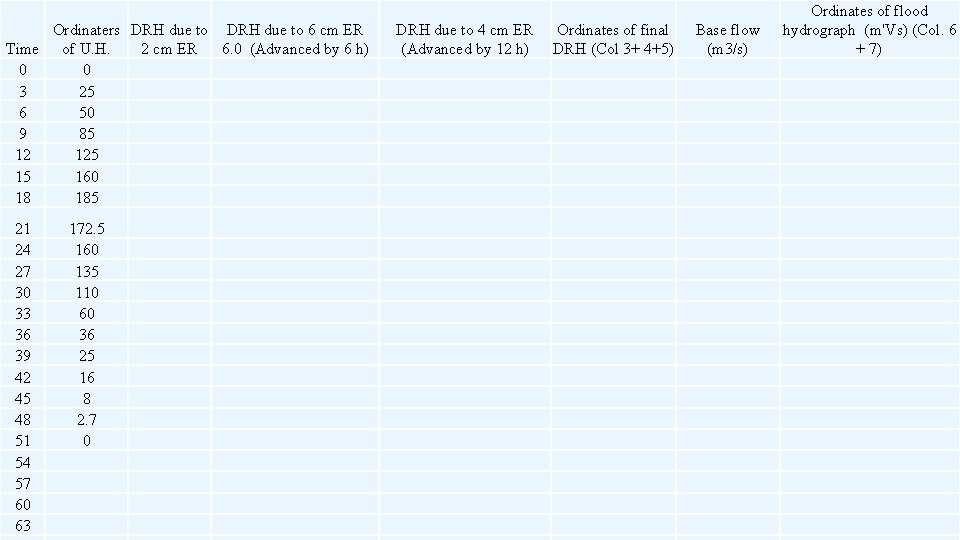
Ordinaters DRH due to 6 cm ER Time of U. H. 2 cm ER 6. 0 (Advanced by 6 h) 0 0 3 25 6 50 9 85 12 125 15 160 18 185 21 24 27 30 33 36 39 42 45 48 51 54 57 60 63 172. 5 160 135 110 60 36 25 16 8 2. 7 0 DRH due to 4 cm ER (Advanced by 12 h) Ordinates of final DRH (Col 3+ 4+5) Base flow (m 3/s) Ordinates of flood hydrograph (m'Vs) (Col. 6 + 7)
Ordinaters DRH due to 6 cm ER x DRH due to 4 cm ER Ordinates of final DRH Time of U. H. 2 cm ER 6. 0 (Advanced by 6 h) (Advanced by 12 h) (Col 3+ 4+5) 0 0 0 3 25 50 0 0 50 6 50 100 0 0 100 9 85 170 150 0 320 12 125 250 300 0 550 15 160 320 510 100 930 18 185 370 750 200 1320 21 24 27 30 33 36 39 42 45 48 51 54 57 60 63 172. 5 160 135 110 60 36 25 16 8 2. 7 0 345 320 270 220 120 72 50 32 16 5. 4 0 0 960 1110 1035 960 810 660 360 216 150 96 48 16. 2 0 0 0 340 500 640 740 690 640 540 440 240 144 100 64 32 10. 8 0 1645 1930 1945 1920 1620 1372 950 688 406 245. 4 148 80. 2 32 10. 8 0 Ordinates of flood Base flow hydrograph (m'Vs) (Col. 6 (m 3/s) + 7) 15 15 15 65 15 15 335 17 567 17 947 17 1337 17 19 19 21 21 23 23 25 25 1662 1949 1964 1939 1639 1393 971 709 427 268. 4 171 103. 2 55 35. 8 25
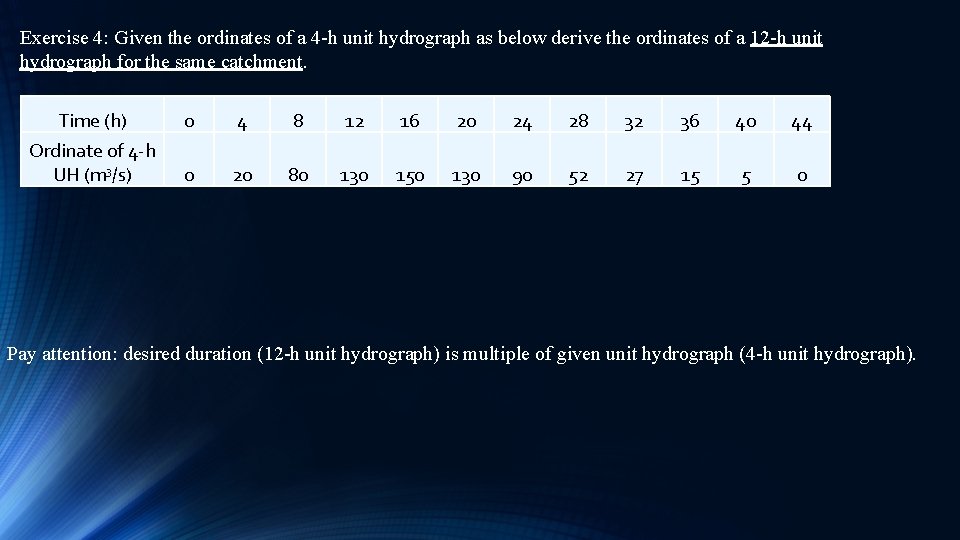
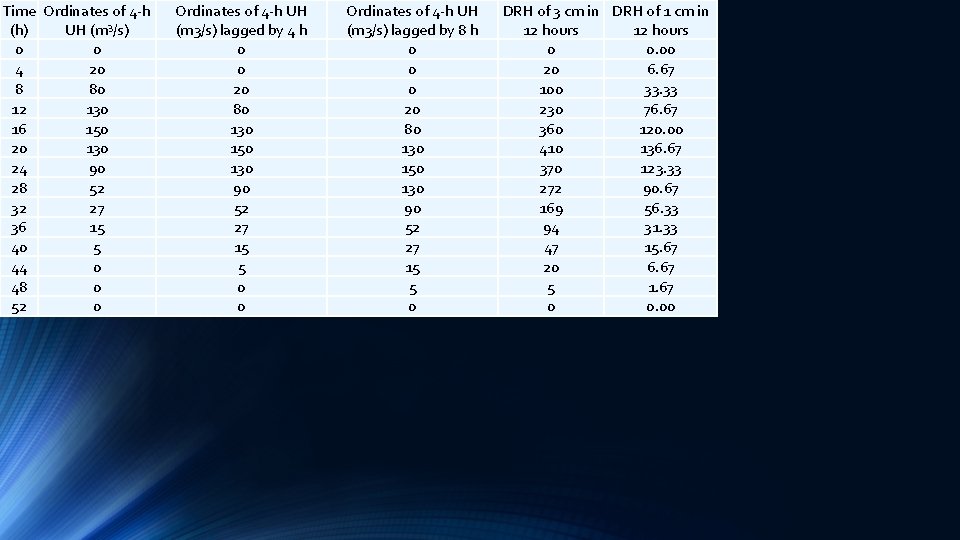
Exercise 4: Given the ordinates of a 4 -h unit hydrograph as below derive the ordinates of a 12 -h unit hydrograph for the same catchment. Time (h) 0 4 8 12 16 20 24 28 32 36 40 44 Ordinate of 4 -h UH (m 3/s) 0 20 80 130 150 130 90 52 27 15 5 0 Pay attention: desired duration (12 -h unit hydrograph) is multiple of given unit hydrograph (4 -h unit hydrograph).
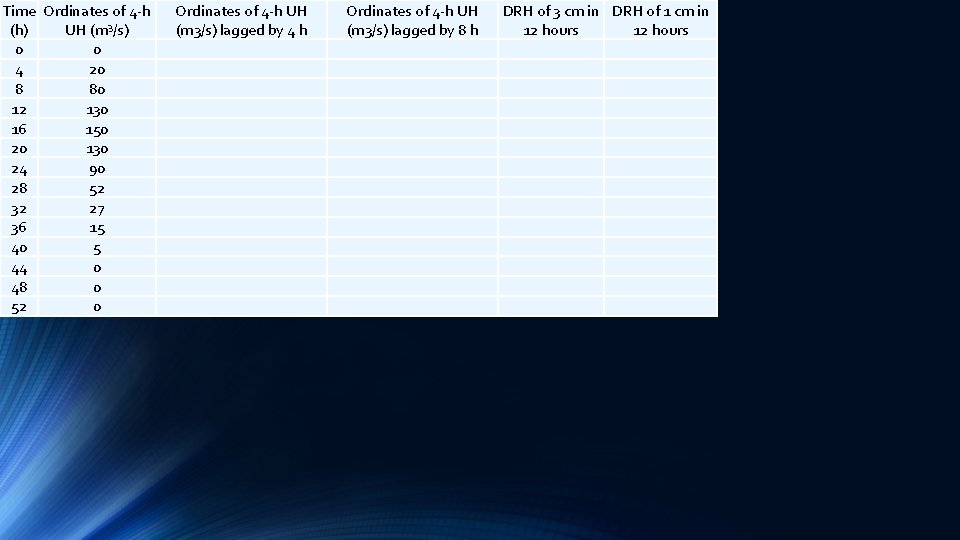
Time Ordinates of 4 -h (h) UH (m 3/s) 0 0 4 20 8 80 12 130 16 150 20 130 24 90 28 52 32 27 36 15 40 5 44 0 48 0 52 0 Ordinates of 4 -h UH (m 3/s) lagged by 4 h Ordinates of 4 -h UH (m 3/s) lagged by 8 h DRH of 3 cm in DRH of 1 cm in 12 hours
Time Ordinates of 4 -h (h) UH (m 3/s) 0 0 4 20 8 80 12 130 16 150 20 130 24 90 28 52 32 27 36 15 40 5 44 0 48 0 52 0 Ordinates of 4 -h UH (m 3/s) lagged by 4 h 0 0 20 80 130 150 130 90 52 27 15 5 0 0 Ordinates of 4 -h UH (m 3/s) lagged by 8 h 0 0 0 20 80 130 150 130 90 52 27 15 5 0 DRH of 3 cm in DRH of 1 cm in 12 hours 0 0. 00 20 6. 67 100 33. 33 230 76. 67 360 120. 00 410 136. 67 370 123. 33 272 90. 67 169 56. 33 94 31. 33 47 15. 67 20 6. 67 5 1. 67 0 0. 00
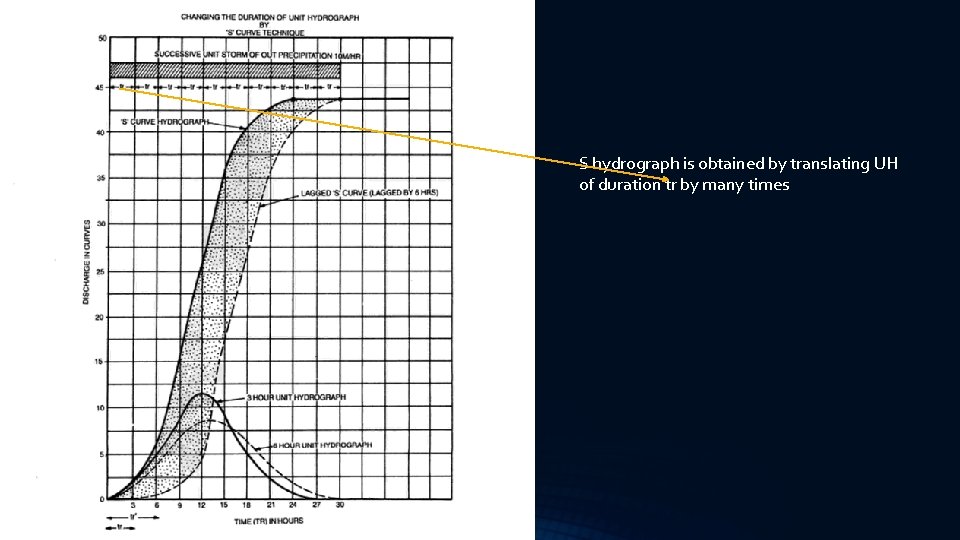
S hydrograph An S-hydrograph (summation) is the hydrograph that results from continuous rainfall excess at a constant rate for an indefinite (long) time
S hydrograph is obtained by translating UH of duration tr by many times
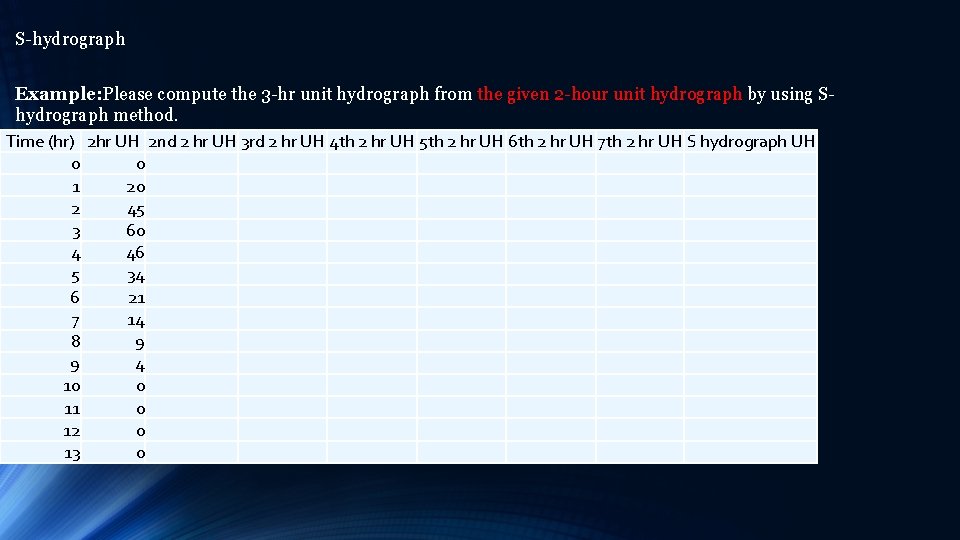
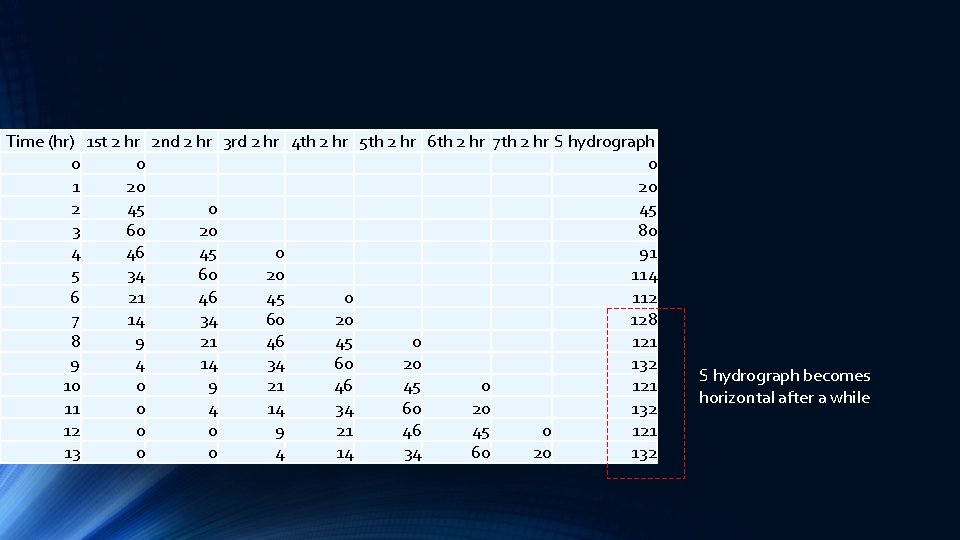
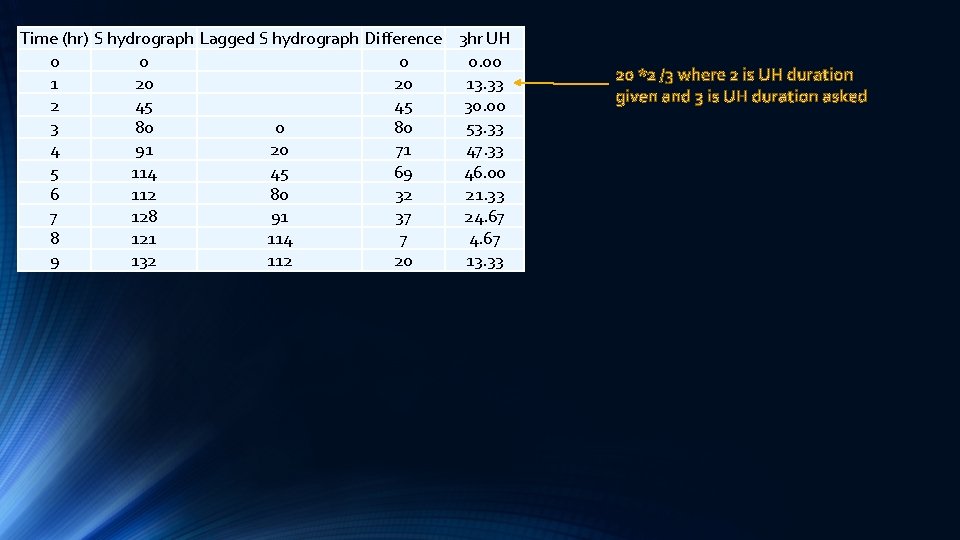
S-hydrograph Example: Please compute the 3 -hr unit hydrograph from the given 2 -hour unit hydrograph by using Shydrograph method. Time (hr) 2 hr UH 2 nd 2 hr UH 3 rd 2 hr UH 4 th 2 hr UH 5 th 2 hr UH 6 th 2 hr UH 7 th 2 hr UH S hydrograph UH 0 0 1 20 2 45 3 60 4 46 5 34 6 21 7 14 8 9 9 4 10 0 11 0 12 0 13 0
Time (hr) 1 st 2 hr 2 nd 2 hr 3 rd 2 hr 4 th 2 hr 5 th 2 hr 6 th 2 hr 7 th 2 hr S hydrograph 0 0 0 1 20 20 2 45 0 45 3 60 20 80 4 46 45 0 91 5 34 60 20 114 6 21 46 45 0 112 7 14 34 60 20 128 8 9 21 46 45 0 121 9 4 14 34 60 20 132 10 0 9 21 46 45 0 121 11 0 4 14 34 60 20 132 12 0 0 9 21 46 45 0 121 13 0 0 4 14 34 60 20 132 S hydrograph becomes horizontal after a while
Time (hr) S hydrograph Lagged S hydrograph Difference 3 hr UH 0 0. 00 1 20 20 13. 33 2 45 45 30. 00 3 80 0 80 53. 33 4 91 20 71 47. 33 5 114 45 69 46. 00 6 112 80 32 21. 33 7 128 91 37 24. 67 8 121 114 7 4. 67 9 132 112 20 13. 33
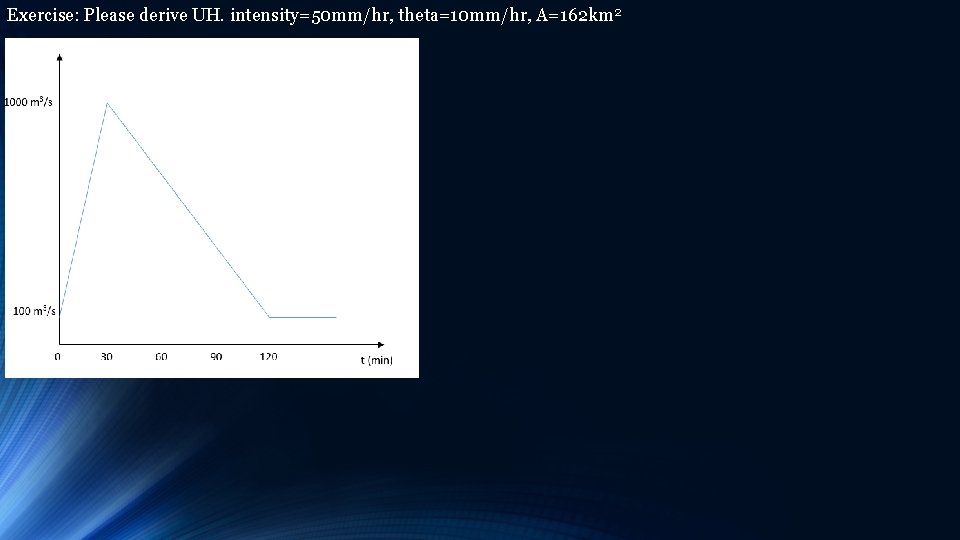
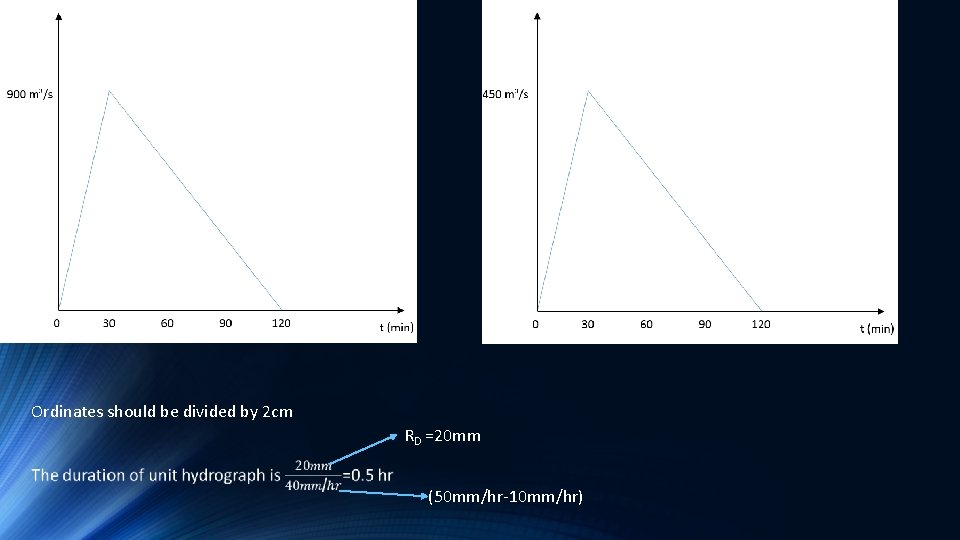
Exercise: Please derive UH. intensity=50 mm/hr, theta=10 mm/hr, A=162 km 2
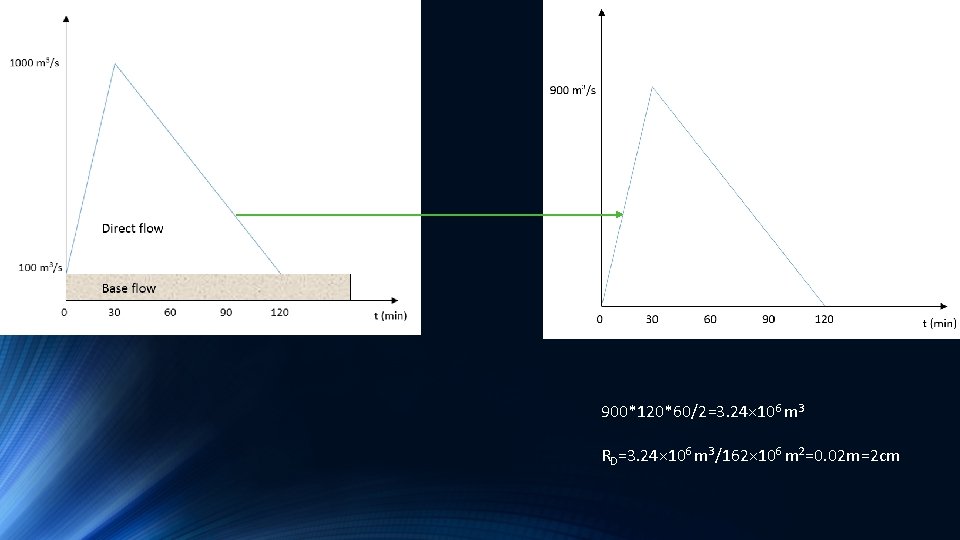
900*120*60/2=3. 24× 106 m 3 RD=3. 24× 106 m 3/162× 106 m 2=0. 02 m=2 cm
UH Ordinates should be divided by 2 cm RD =20 mm (50 mm/hr-10 mm/hr)