Unearthing the Unit Hydrograph Rami Harfouch Surface Water

- Slides: 20
Unearthing the Unit Hydrograph Rami Harfouch Surface Water Hydrology University of Texas at Austin, April 2010
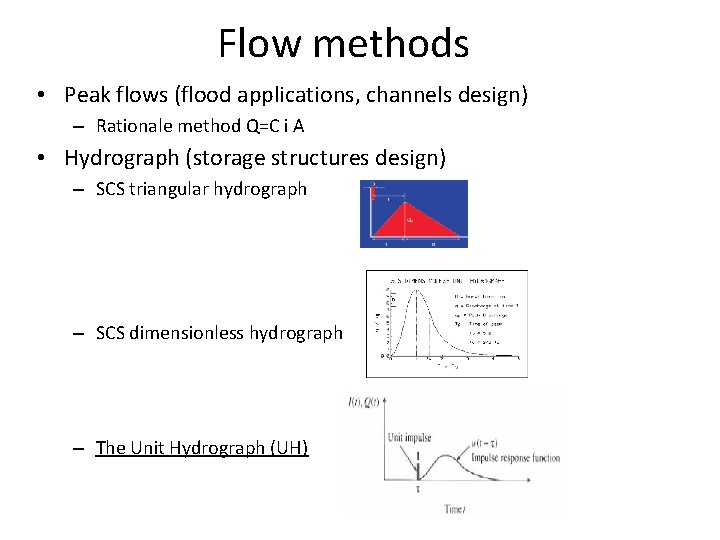
Flow methods • Peak flows (flood applications, channels design) – Rationale method Q=C i A • Hydrograph (storage structures design) – SCS triangular hydrograph – SCS dimensionless hydrograph – The Unit Hydrograph (UH)
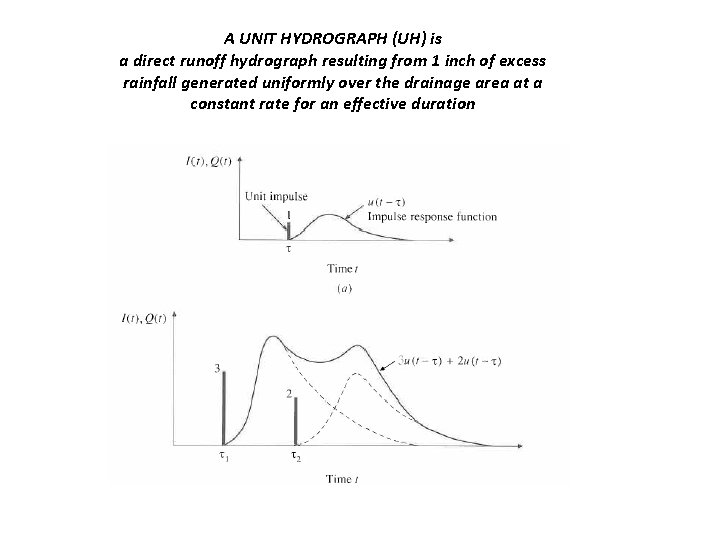
A UNIT HYDROGRAPH (UH) is a direct runoff hydrograph resulting from 1 inch of excess rainfall generated uniformly over the drainage area at a constant rate for an effective duration
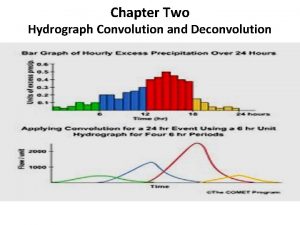
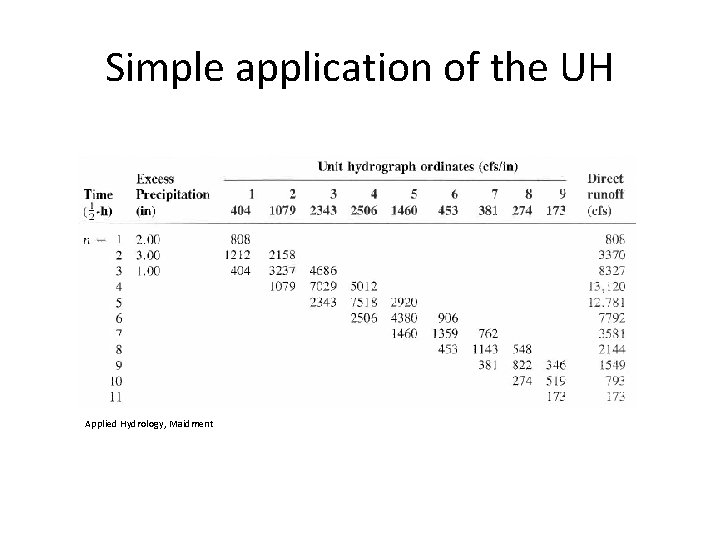
Simple application of the UH Applied Hydrology, Maidment
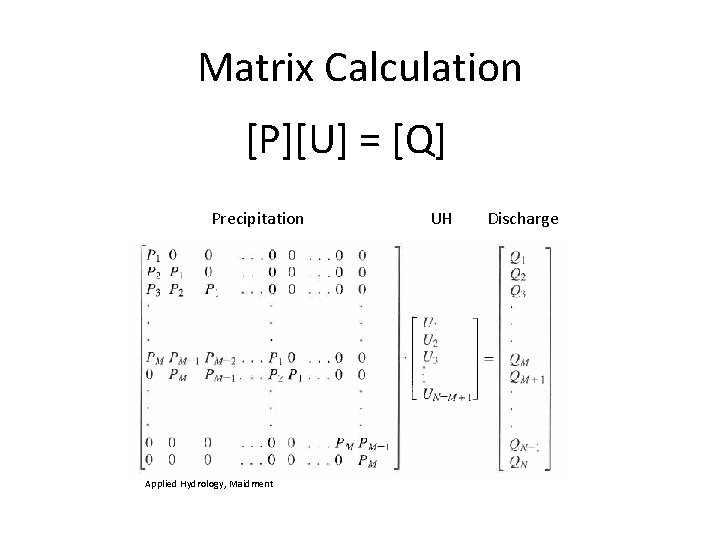
Matrix Calculation [P][U] = [Q] Precipitation Applied Hydrology, Maidment UH Discharge
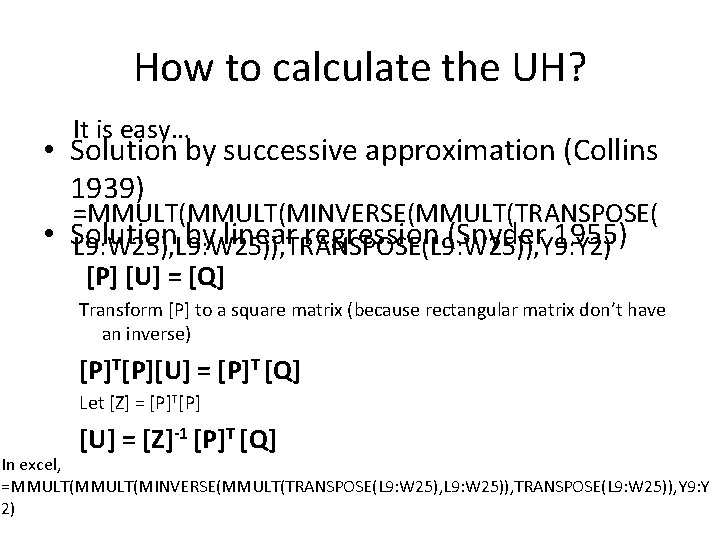
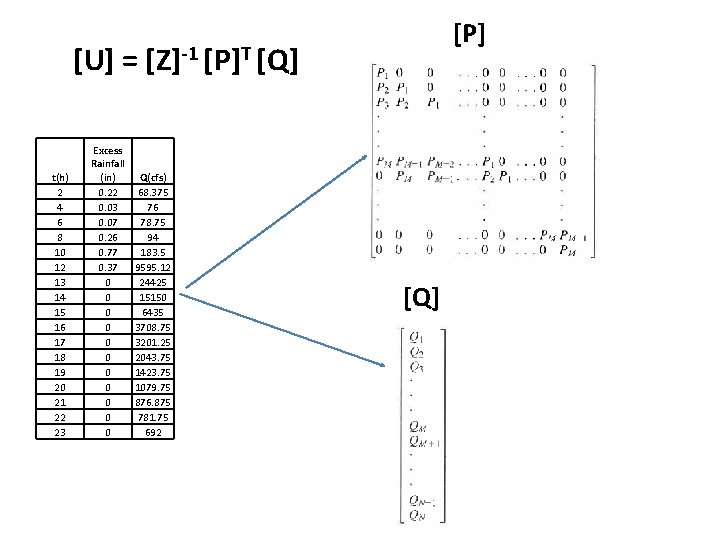
How to calculate the UH? It is easy… • Solution by successive approximation (Collins 1939) =MMULT(MINVERSE(MMULT(TRANSPOSE( • Solution by linear regression (Snyder 1955) L 9: W 25), L 9: W 25)), TRANSPOSE(L 9: W 25)), Y 9: Y 2) [P] [U] = [Q] Transform [P] to a square matrix (because rectangular matrix don’t have an inverse) [P]T[P][U] = [P]T [Q] Let [Z] = [P]T[P] [U] = [Z]-1 [P]T [Q] In excel, =MMULT(MINVERSE(MMULT(TRANSPOSE(L 9: W 25), L 9: W 25)), TRANSPOSE(L 9: W 25)), Y 9: Y 2)
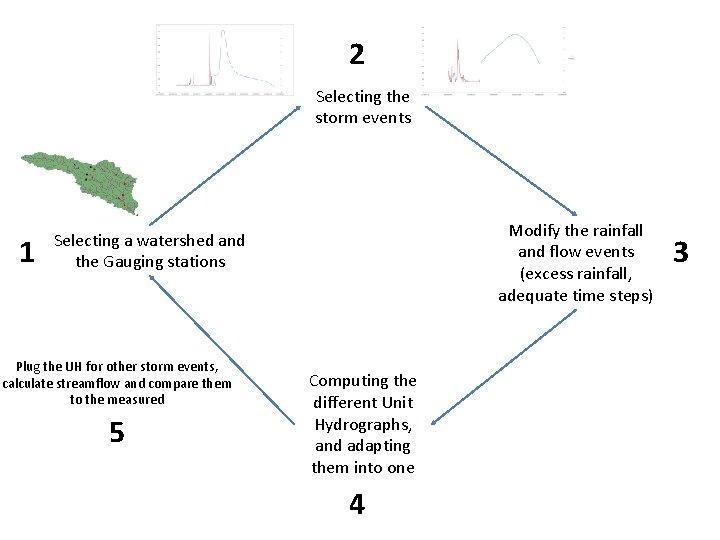
2 Selecting the storm events 1 Modify the rainfall and flow events (excess rainfall, adequate time steps) Selecting a watershed and the Gauging stations Plug the UH for other storm events, calculate streamflow and compare them to the measured 5 Computing the different Unit Hydrographs, and adapting them into one 4 3
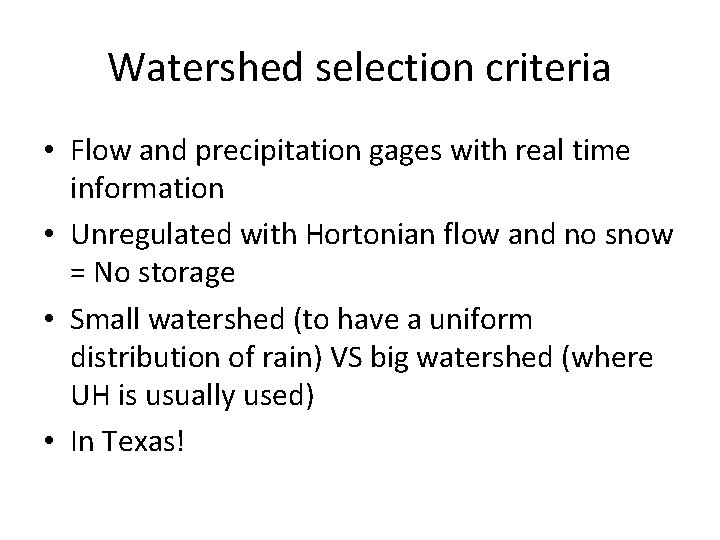
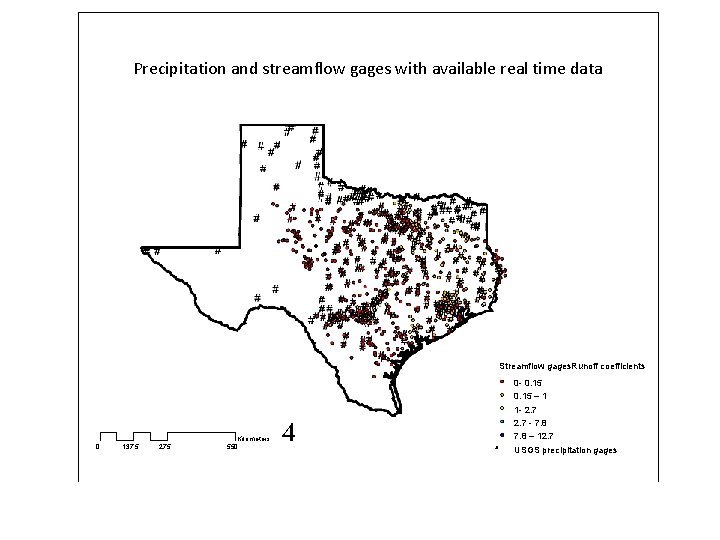
Watershed selection criteria • Flow and precipitation gages with real time information • Unregulated with Hortonian flow and no snow = No storage • Small watershed (to have a uniform distribution of rain) VS big watershed (where UH is usually used) • In Texas!
Precipitation and streamflow gages with available real time data Streamflow gages. Runoff coefficients 0 137. 5 275 Kilometers 550 4 # 0 - 0. 15 – 1 1 - 2. 7 - 7. 8 – 12. 7 USGS precipitation gages
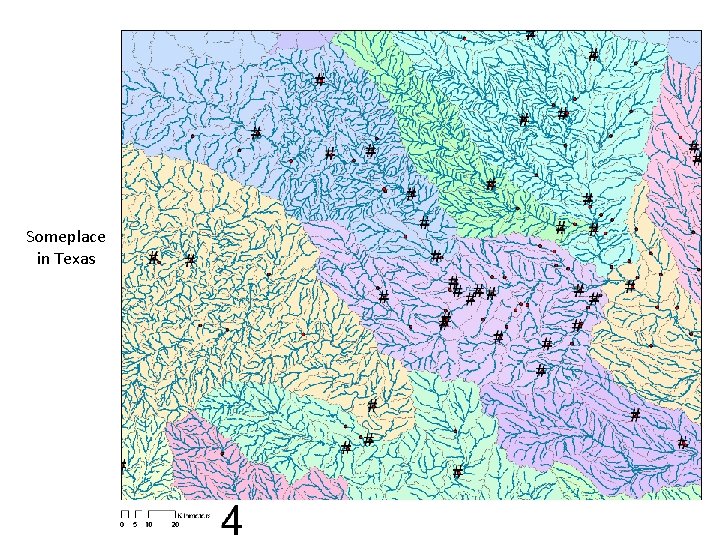
Someplace in Texas
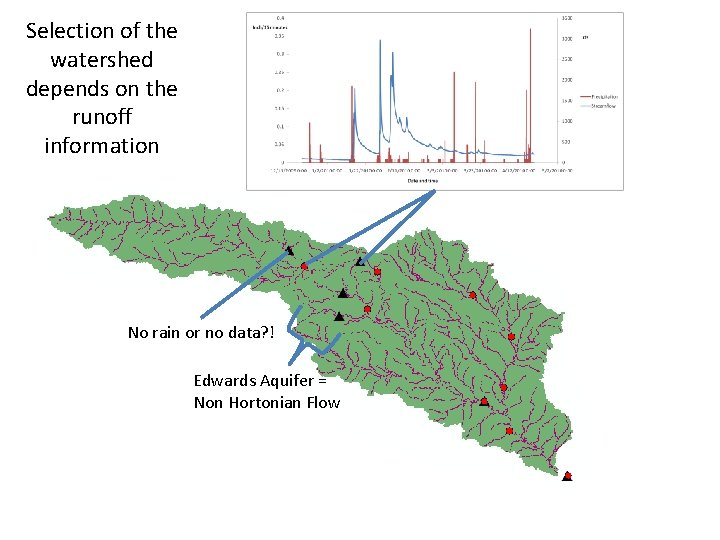
Selection of the watershed depends on the runoff information No rain or no data? ! Edwards Aquifer = Non Hortonian Flow
Selection of the storms • Short and strong storms • Single-peaked hydrograph of short time base
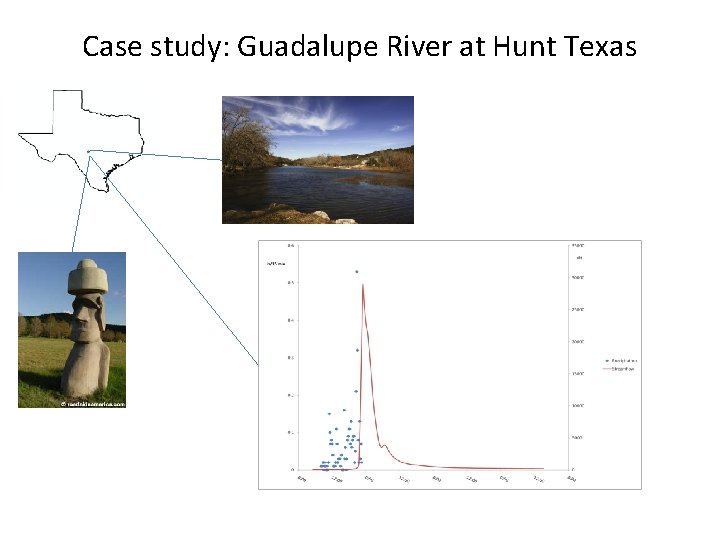
Case study: Guadalupe River at Hunt Texas
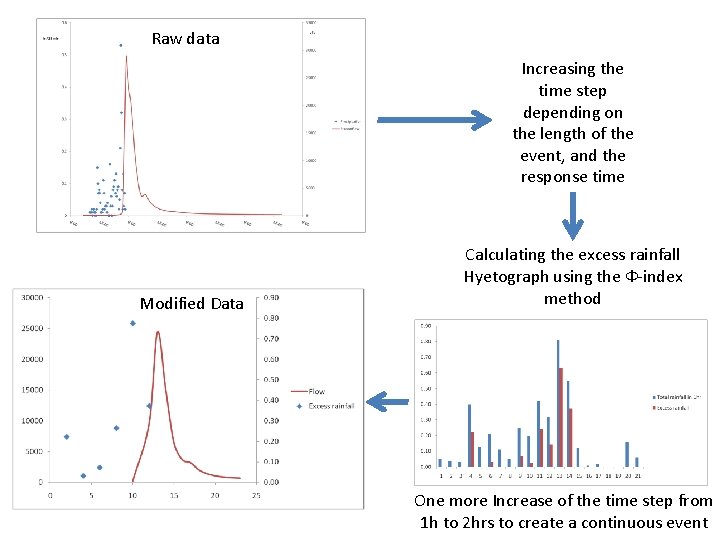
Raw data Increasing the time step depending on the length of the event, and the response time Modified Data Calculating the excess rainfall Hyetograph using the Ф-index method One more Increase of the time step from 1 h to 2 hrs to create a continuous event
[P] [U] = [Z]-1 [P]T [Q] t(h) 2 4 6 8 10 12 13 14 15 16 17 18 19 20 21 22 23 Excess Rainfall (in) 0. 22 0. 03 0. 07 0. 26 0. 77 0. 37 0 0 0 Q(cfs) 68. 375 76 78. 75 94 183. 5 9595. 12 24425 15150 6435 3708. 75 3201. 25 2043. 75 1423. 75 1079. 75 876. 875 781. 75 692 [Q]
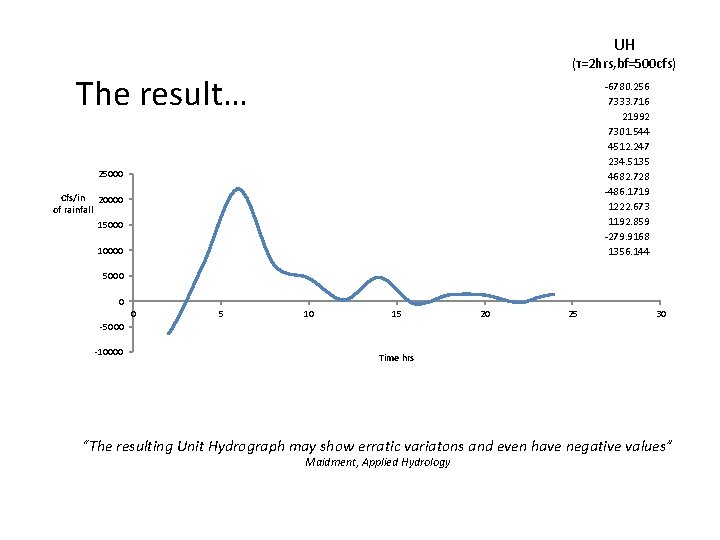
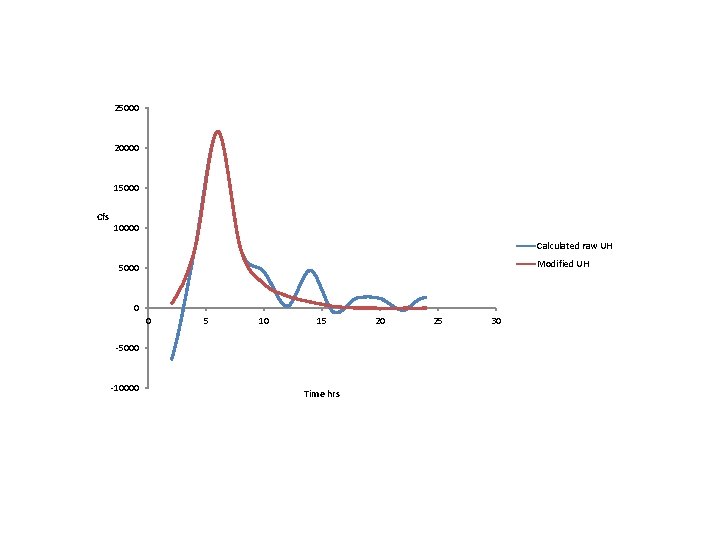
UH (τ=2 hrs, bf=500 cfs) The result… -6780. 256 7333. 716 21992 7301. 544 4512. 247 234. 5135 4682. 728 -486. 1719 1222. 673 1192. 859 -279. 9168 1356. 144 25000 Cfs/in 20000 of rainfall 15000 10000 5000 0 0 5 10 15 20 25 30 -5000 -10000 Time hrs “The resulting Unit Hydrograph may show erratic variatons and even have negative values” Maidment, Applied Hydrology
25000 20000 15000 Cfs 10000 Calculated raw UH Modified UH 5000 0 0 5 10 15 -5000 -10000 Time hrs 20 25 30
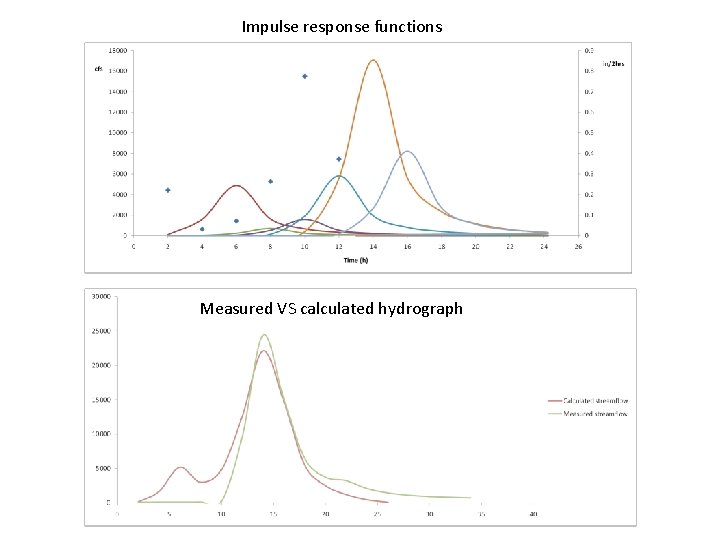
Impulse response functions Measured VS calculated hydrograph
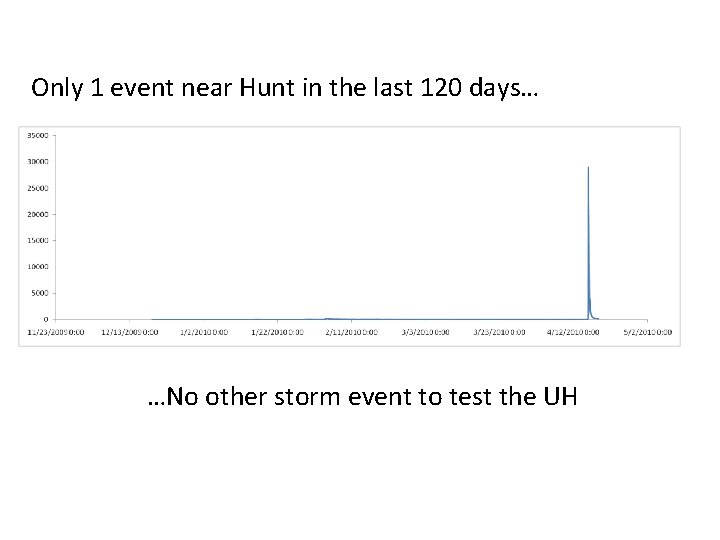
Only 1 event near Hunt in the last 120 days… …No other storm event to test the UH
• The UH is better calculated from strong and isolated storm events… Not many of them happened in the last 120 days • Next: – Find THE watershed with the perfect storms and storm information – Create a synthetic Hydrograph from the UH and test it for other stream gages in the watershed – Compare the peak flows from the UH and the rationale method (C i A)