River 3 Storm Hydrographs Starter Key Words Match


 limb Peak Rainfall Stormflow Lag Time Storm event")


- Slides: 20
River 3 - Storm Hydrographs
Starter �Key Words Match Up
Recap �Water Balance Task : 1. Explain the water budget graph for Athens, Greece. 2. What implications would there be for water management in the Athens region? 3. How will infiltration rates differ between an area of dense grassland an urban area?
Learning Objectives �To create a storm hydrograph �To interpret a storm hydrograph-linking ideas to the drainage basin
Do you know how much water we need? � Cooking, washing and flushing Answer: 150 litres � To grow wheat needed for ½ loaf of bread Answer: 500 litres � To grow a kilogram of rice Answer: 2000 litres � To raise a chicken for Sunday roast Answer: 6000 litres � To provide enough feed for a cow to make a quarter pound hamburger Answer: 11000 litres
The fact is. . . �The natural water cycle is struggling to meet our demands. �½ Billion people are eating rice and wheat irrigated using water from reserves that are not being replenished. �By 2025 three billion people will face chronic water shortages.
Key Definition �River discharge is the volume of water flowing through a river channel. This is the total volume of water flowing through a channel at any given point and is measured in cubic metres per second (cumecs). �In other words, the amount of water passing through a river in a second
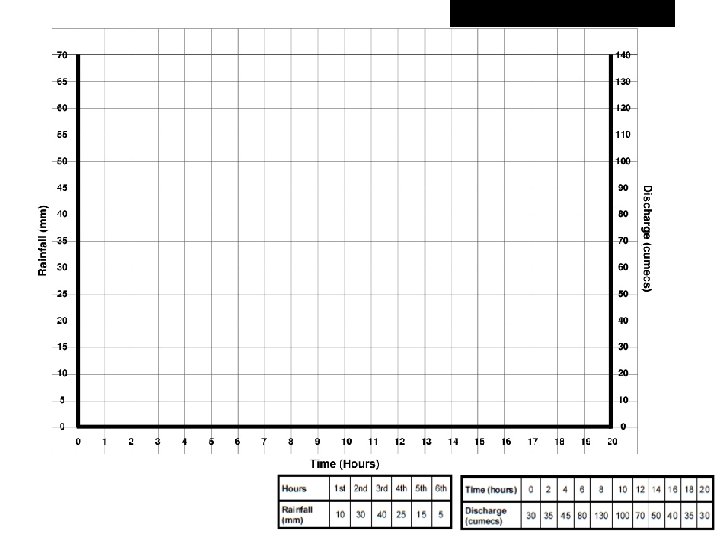
Peak Discharge Rising limb Falling (Recessional) limb Peak Rainfall Stormflow Lag Time Storm event Baseflow
Draw a Storm Hydrograph �Draw on the graph: � � Rainfall- bar chart Discharge- line graph �Draw on the Base flow line (what was it like at the start and had it returned to that at the end? A straight line will do nicely!) �Now add the labels from the sheet to your graph- write them around the actual graph and draw lines to the correct part.
Rivers & people A living graph makes you look further at a graph and link it to people and events that lie behind it. Look at the living graph and read through the statements § Decide where the statements will fit on to the living graph. § Discuss results and highlight the variety of positions which statements may fit into. § Explain why the statements were put into certain places.
Physical Factors
Physical Factors Basin size If a basin is small it is likely that rainfall will reach the main channel more rapidly than in a larger basin where the water has much further to travel. Types of precipitation Flooding most frequently occurs after a long period of heavy rainfall, when the ground has become saturated and infiltration has been replaced by runoff. When heavy rain occurs, the rainfall intensity may be greater than the infiltration capacity of the soil, resulting in surface runoff. Heavy snowfall means that water is held in storage and river levels drop. When temperatures rise rapidly, meltwater soon reaches the main river.
Physical Factors Relief – in steep upland valleys, water is likely to reach the river more quickly than in gently sloping lowland areas. Rock type – if a basin has permeable rocks (ie limestone) there will be rapid infiltration and little surface runoff. If a basin has impermeable rocks (ie granite) water will not be able to pass through them and so there will be greater surface runoff. Soil type – sandy soils, with large pore spaces, allow rapid infiltration and do not encourage flooding. Clays have much smaller pore spaces; this reduces infiltration and throughflow, but encourages surface runoff and increases the flood risk.
Human Factors FLASHY!!!!
Geology • Which rock will cause the most overland flow and why? • Which rock might slow down the passage of water the most? A or B hydrograph shape?
Geology Which one might be pervious? Which one would slow down the passage of water the most? A or B hydrograph shape? Which one would be most likely to flood?
Urban Flooding. Effect of urbanization on a typical stream hydrograph. Normal base flow is indicated with a dark blue line. The purple line indicates discharge after a storm, before urbanization. Following urbanization, stream discharge dramatically increases, as shown by the light blue line.
Most Likely To Worksheet…