HYDROLOGY HYDROLOGIC PROCESSES Hydrology Study of the hydrologic


 Volume (km 3) Percent")

 458000 119000 (mm/yr) 1270")


 Area")


 at a high frequency. This signal")


 This is usually done for one")
 when surrounding gauges differ by greater than 10% in")
 Surrounding gauges are weighted based on")


 is usually calculated by multiplying the")

 storing water in covered reservoirs")


")


")


 Rainfall simulators b) Flooding infiltrometers Hydrograph analysis")


 Hence, a")

")


 Price current meter Meter is suspended from a cable This consists of six")
 Propeller current meter Rotating element is a propeller turning about a horizontal axis")
 is constructed by plotting measured")


 a small stream")


- Slides: 74
HYDROLOGY HYDROLOGIC PROCESSES
Hydrology: Study of the hydrologic cycle; occurrence, distribution, movement, physical and chemical properties of waters of the earth and their environmental relationships. Study and practice of hydrology: aids in explaining and quantifying the occurrence of water on, under and over the earth's surface.
Hydrologic Cycle Earth’s water resources are in a state of continuous circulation linking the atmosphere, land the oceans. This endless process, which is powered by the forces of nature is called the Hydrologic Cycle. It is the basic framework upon which the science of hydrology is built There are many processes that constitute the hydrologic cycle
Hydrologic Cycle Ref: Applied Hydrology by Ven Te Chow, David R. Maidment, Larry W. Mays
Block diagram representation of the global hydrologic system Ref: Applied Hydrology by Ven Te Chow, David R. Maidment, Larry W. Mays
Estimated world water quantities Item Ocean Area (106 km 2) Volume (km 3) Percent of total water Percent of fresh water 361. 3 1338000000 96. 5 Fresh 134. 8 10530000 0. 76 Saline 134. 8 12870000 0. 93 Soil Moisture 82. 0 16500 0. 0012 0. 05 Polar ice 16. 0 24023500 1. 7 68. 6 0. 3 340600 0. 025 1. 0 Fresh 1. 2 91000 0. 007 0. 26 Saline 0. 8 85400 0. 006 Marshes 2. 7 11470 0. 0008 0. 03 Rivers 148. 8 2120 0. 0002 0. 006 Biological water 510. 0 1120 0. 0001 0. 003 Atmospheric water 510. 0 12900 0. 001 0. 04 Total water 510. 0 1385984610 100 Fresh water 148. 8 35029210 2. 5 Groundwater Other ice and snow 30. 1 Lakes 100 Ref: Applied Hydrology by Ven Te Chow, David R. Maidment, Larry W. Mays
Largest sphere represents all of Earth's water 1, 386, 000 km 3 Fresh water (groundwater, lakes, swamp water, and rivers) 10, 633, 450 km 3 “Tiny" bubble represents fresh water in all the lakes and rivers 93, 113 km 3
Global annual water balance Ocean Land 361300000 148800000 (km 3/yr) 458000 119000 (mm/yr) 1270 800 (km 3/yr) 505000 72000 (mm/yr) 1400 484 Rivers (km 3/yr) - 44700 Groundwater (km 3/yr) - 2200 Total runoff (km 3/yr) - 47000 (mm/yr) - 316 Area (km 2) Precipitation Evaporation Runoff to ocean Ref: Applied Hydrology by Ven Te Chow, David R. Maidment, Larry W. Mays
Precipitation • Air is forced to rise • Rising air cools because the ideal gas law says that the temperature falls when the air pressure decreases. • The air cools at the dry lapse rate until it reaches its dewpoint. • Once the air reaches its dewpoint, the relative humidity reaches 100%, and clouds form. • As the air continues to rise, the air cools at the wet lapse rate, causing precipitation to form because the colder air can not hold the excess moisture. • The condensing water generates heat, causing the air to warm slightly, so that the wet air lapse rate is less than the dry rate. • The excess heat generated by the condensing water causes the air to rise faster (because warmer air rises through colder air).
Three primary steps formation of precipitation • creation of saturation conditions in the atmosphere (typically some type of lifting of air) • phase change from vapor to liquid (cloud formation) • growth of droplets to precipitable size (able to overcome upward velocity)
Lifting Mechanisms Front: the boundary between two adjacent air masses of different temperature and moisture content. Warm Front: Warm air advancing on colder air Cold front: Cold air advancing on warm air
Convective precipitation
Orographic precipitation
Measurement of Precipitation Measured as a depth of water on a flat level surface if all the precipitation remained where it had fallen Units: inch, mm Non Recording Gauge Funnel Measuring tube Overflow can Measuring stick
US Standard Weather Bureau Gauge, Diameter, Φ = 8 in (20. 32 cm) Area of the tube is 0. 1 that of the funnel Graduated Scale: To measure precipitation Excess: Overtops the inner tube and collects in the overflow can Rainfall is measured by an observer at regular intervals
Recording Gauges Tipping Bucket Gauge Consists of a pair of buckets pivoted under a funnel When one bucket receives 0, 25 mm (0. 01 in) of precipitation it tips, discharging its content into the bucket, bringing the other bucket under the funnel Recording mechanism: Time of occurrence of each tip Measures rainfall intensity for short periods
Weighting Type Gauge Has a bucket supported by a spring or lever balance Movement of the bucket is transmitted to a pen, which traces a record of the increasing weight of the bucket and its contents on a clock driven chart Record: Accumulation of precipitation Slope of mass diagram: Rate of rainfall
Floating type Gauge Has a pen actuated by a float on the water surface in the bucket Automatic siphoning arrangement empties the bucket when it is full
Radar records a signal reflected of particles (raindrops) at a high frequency. This signal is converted to cumulative rainfall. This data can provide information on location and movement of storms, data in ungauged regions. However, there are difficulties or error in the measurements due to various types of particulate (hail, snow, high intensities)
Design of Rain Gauge Networks A well distributed network of rain gauge stations within the catchment is essential To obtain reliable results, rain gauges should be evenly and uniformly distributed Total number of rain gauges installed within a given catchment area should neither be too many as to be costly nor should be too less as to give unreliable results
Areal density of rain gauges may vary considerably from region to region in any country Density of gauges may also depend upon the basic purpose behind their installation Guidelines: World Meteorological Organization • (flat) temperate, mediterranean and tropical; 230 – 350 mi 2 per station • (mountainous) temperate, mediteranean and tropical; 40 – 100 mi 2 per station • arid polar zones 600 to 4000 mi 2 per station
Data Representation Cumulative Mass Curve Typically the output from a recording gauge is in the form of cumulative rainfall over time At any given time during a storm, the intensity is the slope of the cumulative rainfall curve at that point in time
Rainfall Hyetograph The slope of the cumulative mass curve at any point represents the rate of rainfall (depth/time). Typically we represent the rainfall distribution in discrete time intervals using the cumulative mass curve to calculate the depth over each time interval. Next the depth or intensity is plotted versus time to generate a hyetograph characterizing the time distribution of a storm or selected time period. The hyetograph is the most common input to hydrologic models (surface hydrology models).
It is expressed in depth units per unit time, usually as mm per hour (mm/h) (or in/hr)
Missing data points (also rainfall at ungauged locations) This is usually done for one or two years, months or days for a long term record. Three methods commonly used and are based on long term records of surrounding gauges (minimum of three) Precipitation measuring stations sometimes fail in providing a continuous record of precipitation Eg. Due to malfunction of instruments, failure to record data or miss a visit to site Simple average of surrounding gauges must be equal distance from point of estimate should have fairly equal rainfall at known gauges
Normal Ratio Method (missing data) when surrounding gauges differ by greater than 10% in measured rainfall, stations are weighted based on normal annual precipitation ratio’s where: Nx Pk Nk Px = = normal long-term annual precipitation at location x event precipitation at gauge k normal long-term annual precipitation at gauge k estimated event precipitation at location x
Reciprocal Distance Method (missing data & ungauged location) Surrounding gauges are weighted based on reciprocals of the sum of squares of distance away from the point of interest. Sometimes called inverse weighted distance method X and y are distances from the unknown point (missing data location) where precipitation is being estimated
HYDROLOGIC ABSTRACTIONS Hydrologic abstractions are the losses of precipitation, which prevent precipitation from becoming surface runoff Eg. Out of the 4300 x 106 m 3 of rainfall receiving on the Walawe Ganga catchment in Sri Lanka only 945 x 106 m 3 is discharged to the sea 85 x 106 m 3 of water is used for drinking and industrial purposes Balance of 3270 x 106 m 3 is evapotranspirated and infiltrated
Average disposition of precipitation in the Walawe Ganga catchment in Sri Lanka
Evaporation The process by which water is transferred from land water masses of the earth to the atmosphere There is a continuous exchange of water molecules between an evaporating surface and its overlying atmosphere Evaporation is the net rate of vapour transfer
It is a function of • solar radiation • difference in vapour pressure between water surface and the overlying air • temperature • wind • atmospheric pressure • the quality of evaporating water • size of the water body Rate is highest from open water Ground surface: Rate depends on the type of soil and saturation with water
Storm periods: vapour pressure gradients are reduced and evaporation is usually not significant Evaporation varies from day to day Daily evaporation in Sri Lanka varies from 1 to 10 mm/day but on average it is taken as 4 mm/day Evaporation is determined based on • water budget • energy budget • empirical formulae • pan-evaporation data
Evaporation Pans Most widely used method A standard evaporation pan The standard weather bureau Class A pan: unpainted, galvanized iron 4‑ft diameter (122 cm), 10 in (25. 4 cm) deep, circular container, mounted 12 in above the ground on a wooden frame Usually filled to a depth of 20 cm and refilled when the depth has fallen to less than 18 cm Water surface is measured with a hook gauge
Pan evaporation estimates lake evaporation Lake evaporation (EL) is usually calculated by multiplying the pan evaporation by a factor called pan coefficient (PC) EL = P C E P Pan coefficient on an annual basis varies between 0. 65 and 0. 82 Evaporation rates vary with the time of the year Greatest is during periods of intense sunlight and least is during cold cloud‑covered days
Evaporation Reduction Evaporation losses can be greatly significant at any location Consequently, the concept of evaporation reduction is receiving widespread attention Evaporation losses from soils can be controlled by employing various types of mulches or by chemical alteration
They may be reduced from open waters by; a) storing water in covered reservoirs b) making increased use of underground storage c) controlling aquatic growths d) building storage reservoirs with minimal surface area e) through the use of chemicals
Transpiration Process by which water is drawn from the soil by plant roots and transferred to the leaves, from which it evaporates Controlled by • solar radiation • temperature • wind velocity • vapour pressure gradient • characteristics of plants • plant density • soil moisture content
Estimation of Transpiration For small plant areas: determined by a closed container in which humidity changes are measured Soil is sealed to prevent evaporation from soil These experiments are performed on site or by use of a phytometer (a container with a particular plant rooted in it). Soil surface is sealed so that the only escape of moisture is by transpiration. Transpiration can be determined by weighting the planted container at desired intervals of time
Precise determination is difficult Extrapolations to other areas can be misleading Water budgets are valuable, but again requires estimates of other variables and thus the transpiration estimates are only as accurate as the measurement of the other variables
Transpiration Reduction Methods of control include • use of chemicals to inhibit water consumption (chemicals are applied in the root zone) • harvesting of plants • improved irrigation practices • actual removal or destruction of certain vegetative types a day when in leaf
Evapotranspiration Sum total of water returned to the atmosphere from surface and ground (soil) water and vegetation Evaporation + Transpiration Difficult to separate the effect of evaporation and transpiration over land areas Mostly, only total evaporation from an area (combined evaporation plus transpiration: consumptive use) is of practical interest to a hydrologist
Maximum value of evapotranspiration: Potential evapotranspiration It is relatively easy to calculate potential evapotranspiration for a saturated surface (open water), using local meteorological parameters such as humidity, temperature and wind speed Actual evapotranspiration is always less than potential evapotranspiration Estimation of Evapotranspiration Lysimeters Penman’s Equation Empirical formulae
Evapotranspiration from satellite data When a surface evaporates, it looses energy and cools itself. This cooling can be observed from space. Satellites can map the infrared heat radiated from Earth, thus enabling to distinguish the cool surfaces from the warm surfaces. Very dry and desert-like surfaces show easily as they get hotter than their surroundings. From this qualitative reasoning, the scientific objective is to determine quantitatively the amount of evapotranspiration that occurs at given locations.
In practice, it consists in entering various types of satellite observations (not just infrared) into mathematical models of the atmosphere. The models, of various complexities, are run in algorithmic form on computers.
Initial Loss Interception process + Depression storage This represents the quantity of storage that must be satisfied before overland runoff begins Interception Segment of gross precipitation input, which wets and adheres to above ground objects until it is returned to the atmosphere through evaporation
It is part of a subcycle of the hydrological cycle Precipitation striking vegetation may be retained on leaves or grass, flow down the stems of plants and become stemflow, or fall off the leaves to become part of the throughfall Interception is a function of a) the storm character b) the species (type), age and density of prevailing plants and trees c) the season of the year Typical interception loss curve
Most interception loss develops during the initial storm period and the rate of interception rapidly approach zero thereafter Determined by comparing precipitation in gauges beneath the vegetation with that recorded nearby under the open sky. Intercepted precipitation is dissipated as stemflow (measured by catch devices around tree trunk) down the trunk of the trees and evaporation from the leaf surface
Depression Storage Precipitation that reaches the ground may infiltrate, flow over the surface or become trapped in numerous small depressions from which the only escape is evaporation or infiltration The nature of depression as well as their size is largely a function of the original land form and local land use practices All depression must be full before overland flow supply begins
Infiltration The movement of water through the ground surface into the soil and on downwards Infiltration rate and quantity are a function of soil type soil moisture soil permeability ground cover drainage conditions depth of water table intensity and volume of precipitation
Infiltrated water percolates downwards by gravity until it reaches the zone of saturation Rate of downward movement is controlled by the transmission characteristics of the underlying soil profile Due to the infinite combinations of soil and other factors existing in nature no general relationship exists to quantify infiltration
Measuring Infiltration Infiltrometer studies a) Rainfall simulators b) Flooding infiltrometers Hydrograph analysis
Calculation of Infiltration Calculations vary in sophistication from the application of average rates to the use of conceptually sound differential equations Horton (1930 s) studied infiltration process and suggested the following relationship for determining infiltration Where, f = infiltration rate as a function of time, (depth/time) fc = final or ultimate (equilibrium) infiltration rate fo = initial infiltration rate k = a constant representing the rate of decrease in infiltration capacity
The variation of infiltration capacity
Temporal and Spatial Variability of Infiltration Capacity Infiltration rate generally varies both in space and time Spatial variations are due to differences in soil type and vegetation Accommodate this type of variation by subdividing the total region into compartments having approximately uniform soil and vegetal cover The infiltration capacity at a given location in a watershed varies with time as shown before
STREAMFLOW Streamflow = surface runoff + underground flow Throughflow through the soil in the zone of aeration (above the water table) Baseflow groundwater River discharge (streamflow): Volume of water that flows past a point in a certain time
The measurement, or gauging, of river discharge is important for assessment of water resources, design of water supply schemes, flood‑control projects, hydroelectric projects etc. Streamflow Measurements Measurement techniques can be broadly classified into two categories as, a) direct determination (Area-velocity methods, Dilution techniques) b) indirect determination (Hydraulic structures [eg. , weirs, flumes] )
Flow measuring methods can also be classified as shown below too Stage (water surface elevation) Discharge (structural) Visual observation Float Pressure Sensor Electrical Resistance Current meter Dilution Float Indirect via Manning's equation Direct volume collection Weirs Flumes Orifices Streamflow is the general term used to represent volumes or rates of flow Discharge is the rate of measurement and applied to waters that flow from a specific watershed or pond area
Continuous measurement of stream discharge is very difficult (very time-consuming and costly) Hence, a two-step procedure is followed First, the discharge is related to the elevation of the water surface (stage) Next, the stage of the stream is observed routinely in a relatively inexpensive manner and the discharge is estimated by using the previously determined stagedischarge relationship
Measurement of Stage: water surface elevation recorded relative to some horizontal datum elevation, frequently MSL Record of stage is called "stage hydrograph" A stage recorder can be as simple as a ruler along a bridge or other structure. It can be read periodically
Stage data is presented as a plot of stage against chronological time (stage hydrograph) Besides its use in the determination of stream discharge, stage data itself is of importance in flood warning and flood protection works
Stream Discharge Velocity‑area Method Based on continuity Equation Where, Q A V = = = volume rate of discharge (m 3/s) cross sectional area (m 2) mean velocity in the cross section (m/s) Discharge is determined by measuring cross sectional area and the velocity
Cross‑sectional area is determined from measurements of depth of water taken at known intervals across the river Velocity is measured by floats, by a pitot tube (restricted to pipes or to experimental channels) or by using a current meter Current meter is mostly used
Calculation of mean velocities Type Depth in vertical Observation point Mean velocity Single point 1 - 2 ft 0. 6 D from surface v = v 0. 6 Two point 2 - 10 ft 0. 2 D & 0. 8 D v=1/2[v 0. 2+v 0. 8)] Three point 10 - 20 ft 0. 2 D, 0. 6 D & 0. 8 D v=1/4[v 0. 2+2 v 0. 6+v 0. 8)] Five point Over 20 ft S, 0. 2 D, 0. 6 D, 0. 8 D & B v=1/10[vs+3 v 0. 2+2 v 0. 6+3 v 0. 8)+v. B ] VS is measured 1 ft below surface, and VB is measured 1 ft above stream bottom Discharge in subsection Qsub = Asub x Vsub Cross section of a river - current meter measurements
a) Price current meter Meter is suspended from a cable This consists of six conical cups rotating about a vertical axis Electrical device is used to count the revolutions
b) Propeller current meter Rotating element is a propeller turning about a horizontal axis The relation between revolutions per second N of the meter cups and water velocity v in m/s is given by an equation of the form v = a + b. N Where, a is the starting velocity or velocity required to overcome mechanical friction
Stage - Discharge Relations Stage‑discharge relation (or rating curve) is constructed by plotting measured discharge against stage (water surface elevation) at the time of measurement
Assumption: if the stage at that point is the same, the discharge will be the same River discharge can be estimated from measurement of stage alone Constructed by plotting successive measurements of the discharge and gauge heights on a graph Rating curve must be checked periodically to ensure that the relationship between the discharge and gauge height has remained constant: scouring of the stream bed or deposition of sediment in the stream can cause the rating curve to change so that the same recorded gauge height produces a different discharge.
Floats A floating object on the surface of a stream is timed: provides surface velocity Where, S = distance traveled in time t
Though primitive still finds applications in special circumstances, such as: (i) a small stream in flood (ii) small stream with a rapidly changing water surface (iii) preliminary or exploratory surveys Any floating object can be used Normally specially made leakproof and easily identifiable floats are used Mean velocity is obtained by multiplying the observed surface velocity by a reduction coefficient
Surface floats are affected by surface winds To get the average velocity in the vertical, floats in which part of the body is under water (rod floats) are used The method is restricted to straight rivers having almost uniform cross section throughout The method is not good if the depth of water exceeds 1. 5 m or more
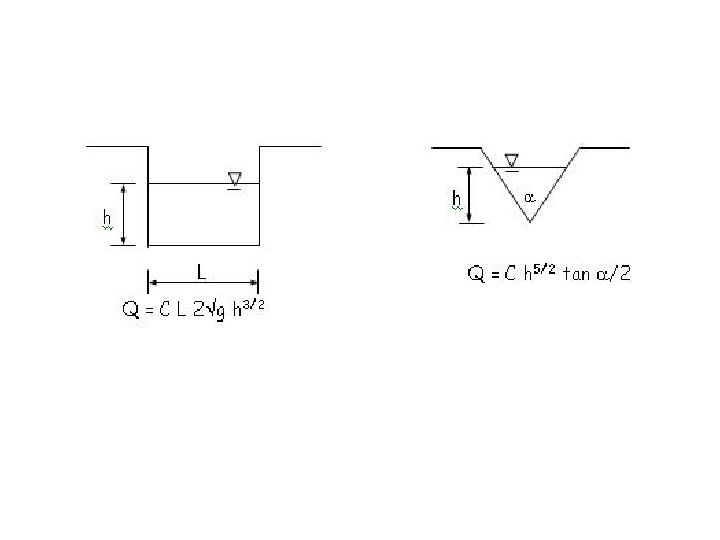
Weirs and Flumes Employed where a high degree of precision or reliability of the discharge measurements are required Confined (or limited) to streams and fairly small rivers For wide rivers this is extremely expensive Stream discharge is made to behave according to certain well known hydraulics laws
Dilution Method Used where the conventional velocity‑area method can not be used (eg. boulder - strewn stream) Discharge is determined over a length of the stream rather than at a single point A known quantity of some exotic substance (a tracer) is introduced. Samples are withdrawn at a downstream point
The tracer may be a chemical tracer or a radioactive tracer If a tracer solution is injected into a stream at a constant rate and samples are taken downstream at a point where turbulence has achieved complete mixing, the steady flow rate Q in the stream is given by Where, Qt = Steady dozing rate C 0 = Concentration of the tracer in the undosed flow C 1 = Concentration of the tracer in the dose C 2 = Concentration of the tracer in the dosed flow