Hydrological Cycle RAINFALL is the main source of
- Slides: 59
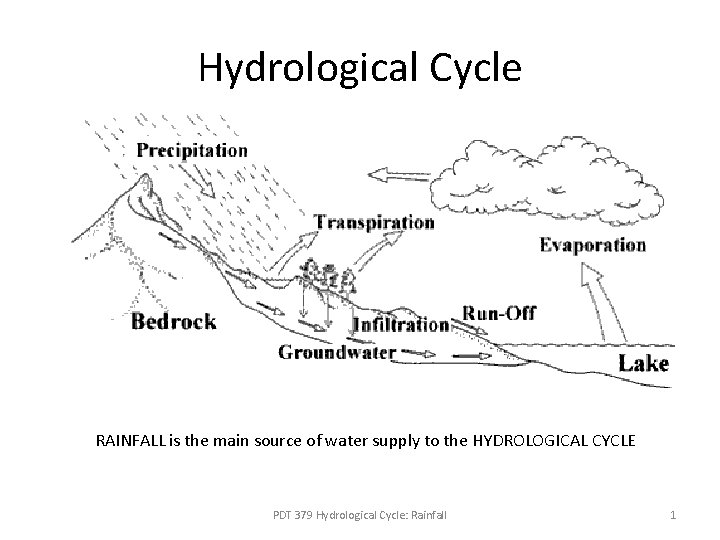
Hydrological Cycle RAINFALL is the main source of water supply to the HYDROLOGICAL CYCLE PDT 379 Hydrological Cycle: Rainfall 1
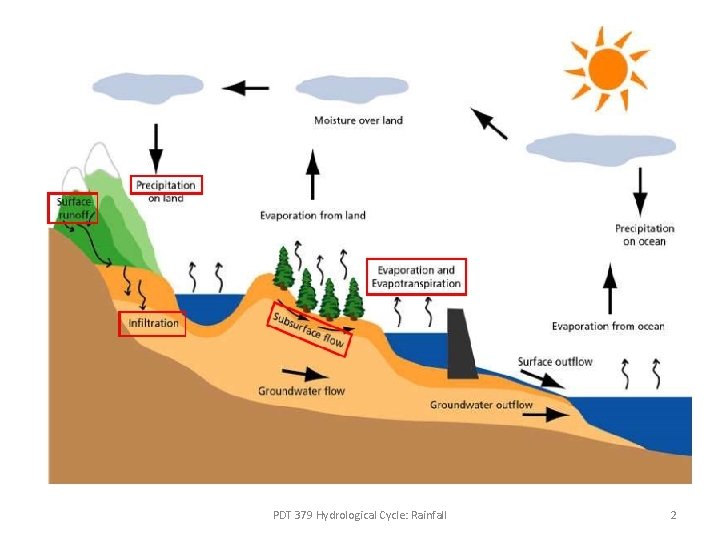
PDT 379 Hydrological Cycle: Rainfall 2
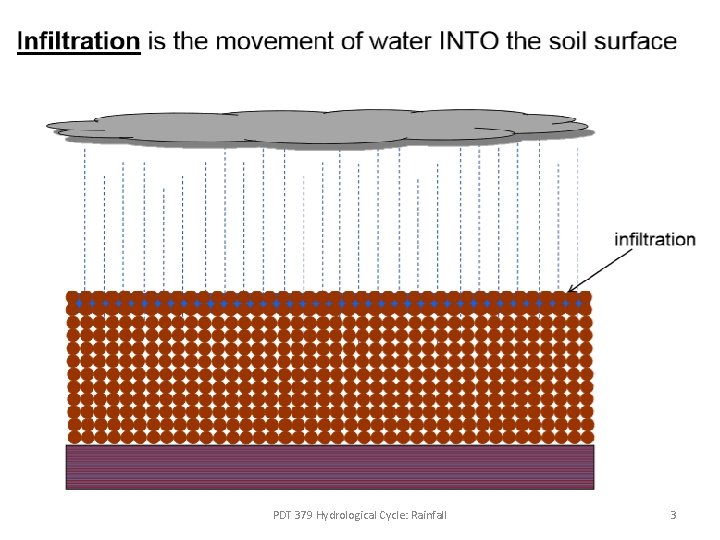
PDT 379 Hydrological Cycle: Rainfall 3
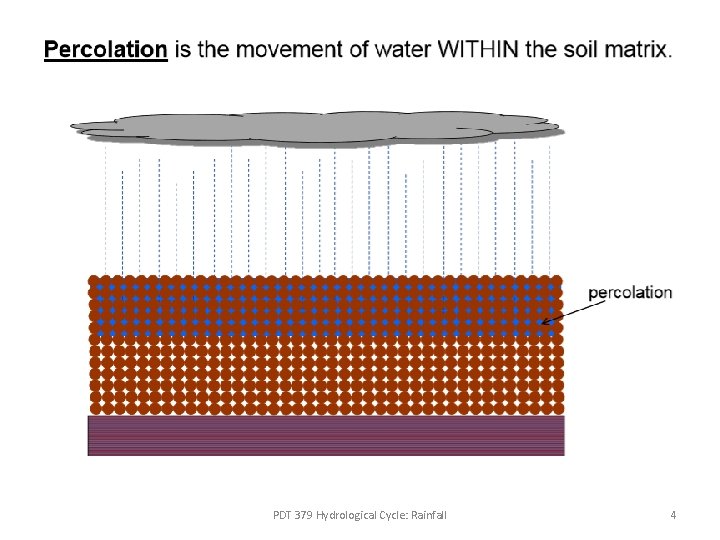
PDT 379 Hydrological Cycle: Rainfall 4
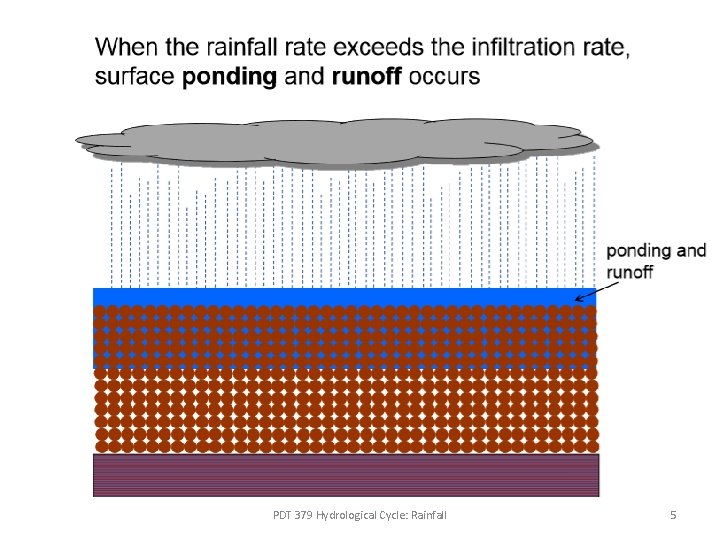
PDT 379 Hydrological Cycle: Rainfall 5
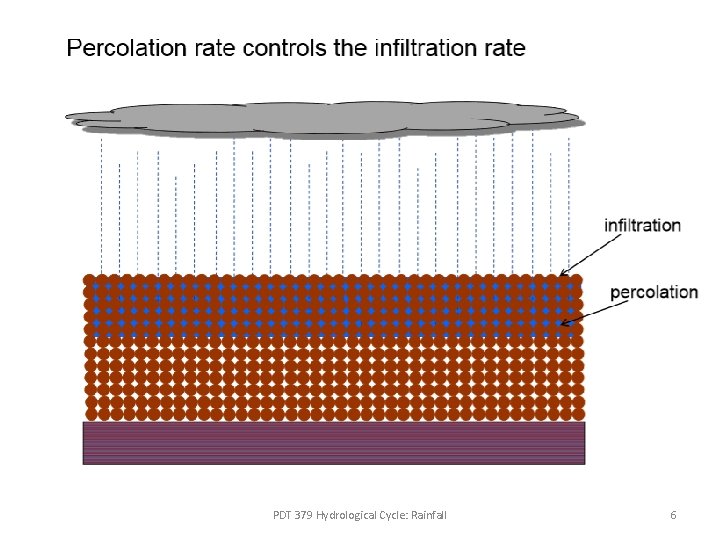
PDT 379 Hydrological Cycle: Rainfall 6
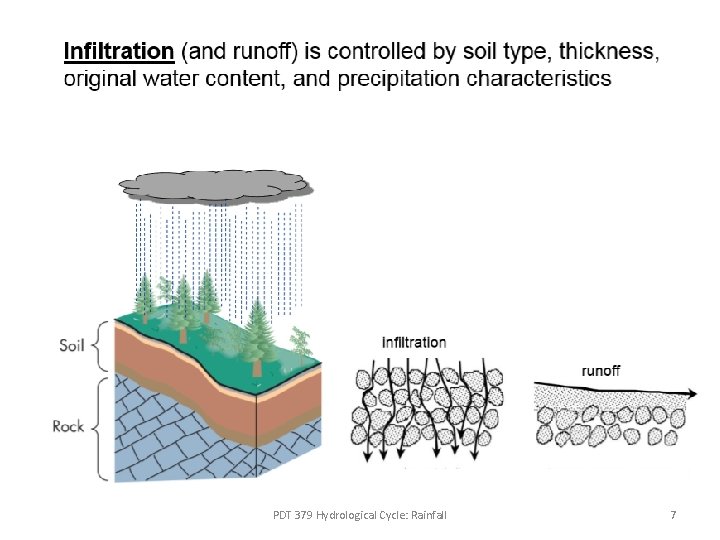
PDT 379 Hydrological Cycle: Rainfall 7
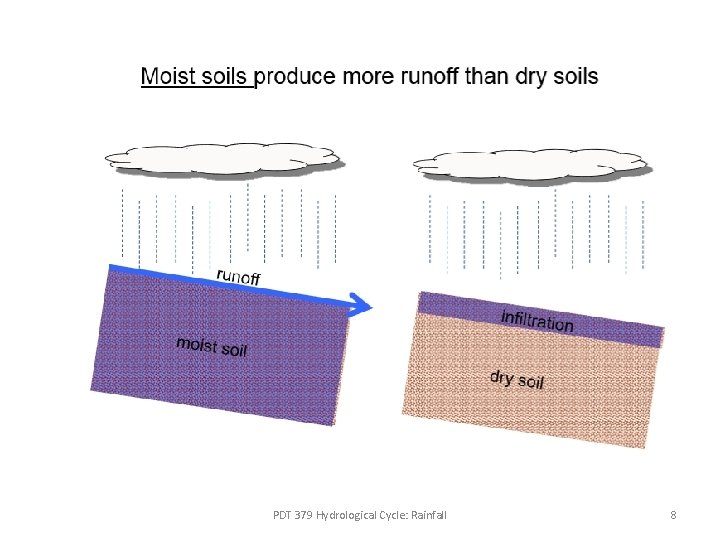
PDT 379 Hydrological Cycle: Rainfall 8
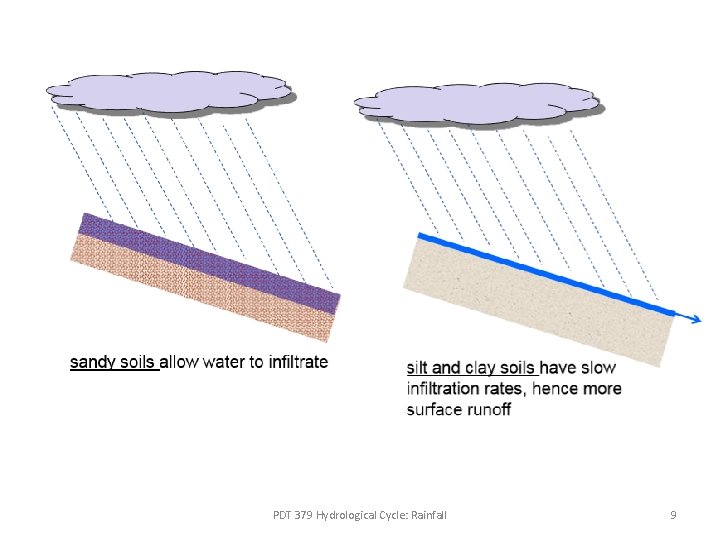
PDT 379 Hydrological Cycle: Rainfall 9
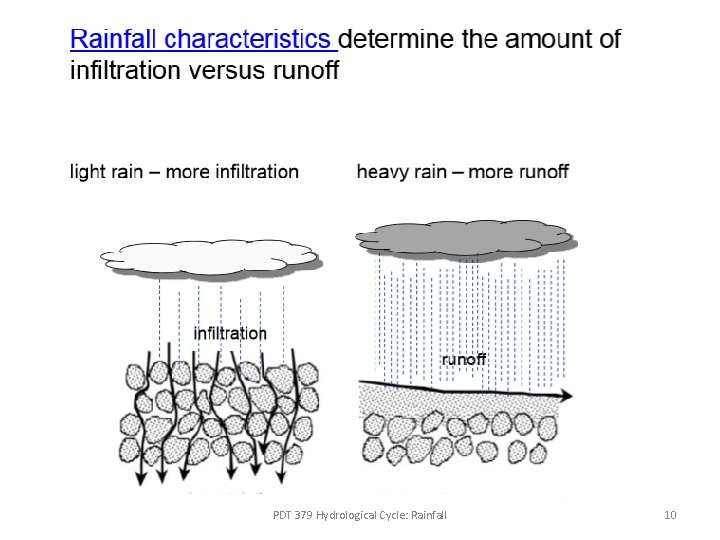
PDT 379 Hydrological Cycle: Rainfall 10
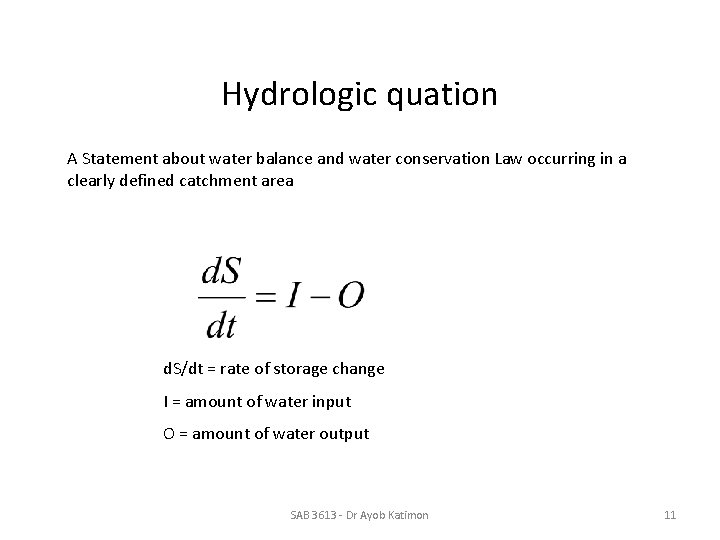
Hydrologic quation A Statement about water balance and water conservation Law occurring in a clearly defined catchment area d. S/dt = rate of storage change I = amount of water input O = amount of water output SAB 3613 - Dr Ayob Katimon 11
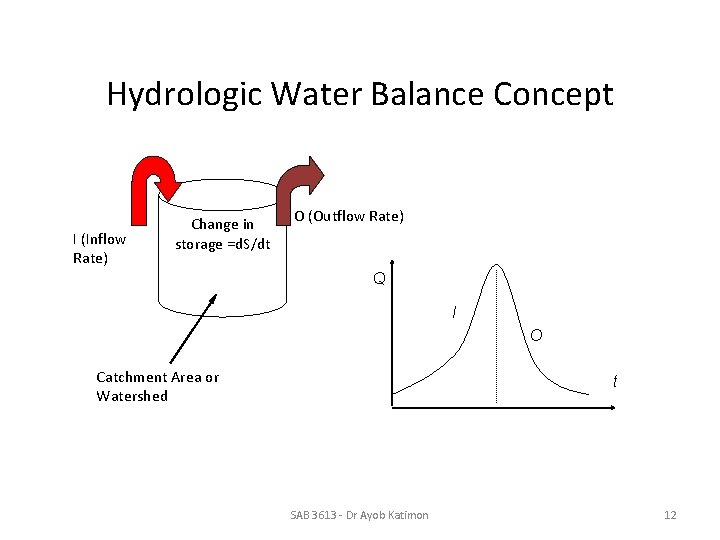
Hydrologic Water Balance Concept I (Inflow Rate) Change in storage =d. S/dt O (Outflow Rate) Q I O Catchment Area or Watershed t SAB 3613 - Dr Ayob Katimon 12
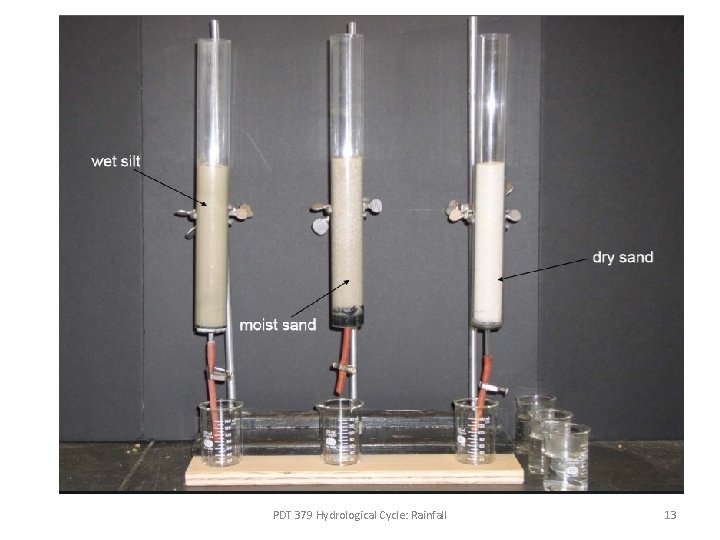
PDT 379 Hydrological Cycle: Rainfall 13
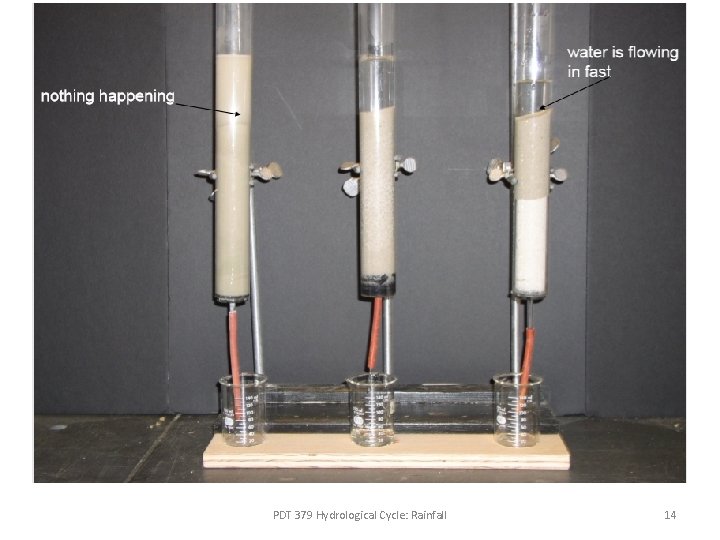
PDT 379 Hydrological Cycle: Rainfall 14
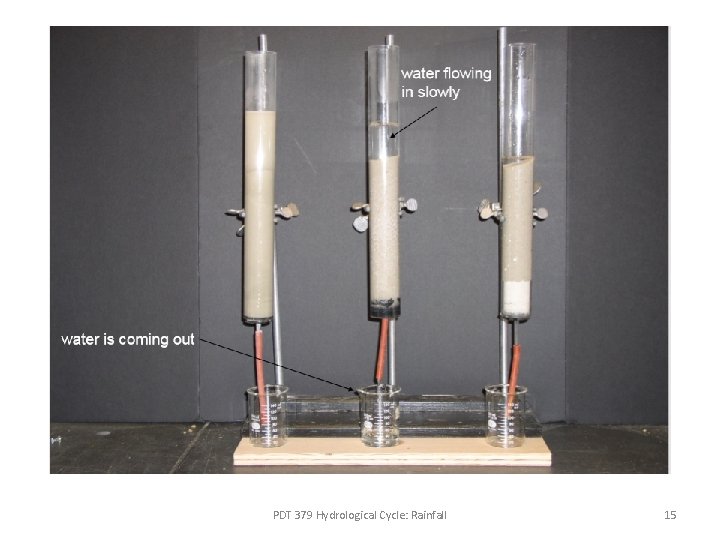
PDT 379 Hydrological Cycle: Rainfall 15
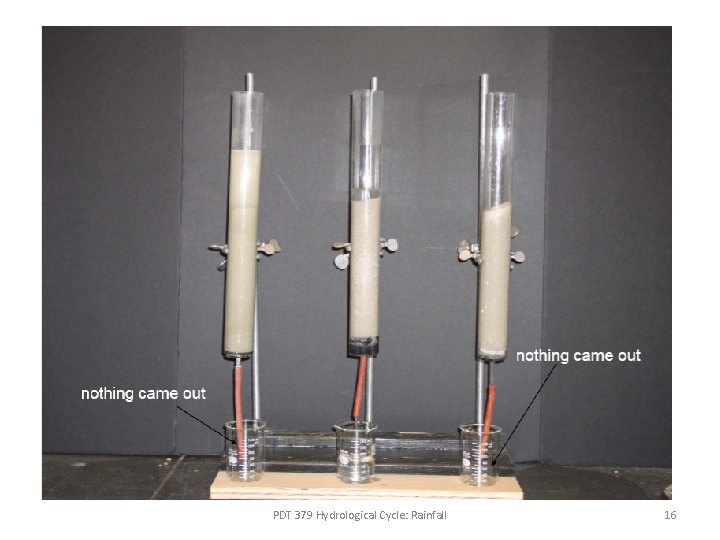
PDT 379 Hydrological Cycle: Rainfall 16
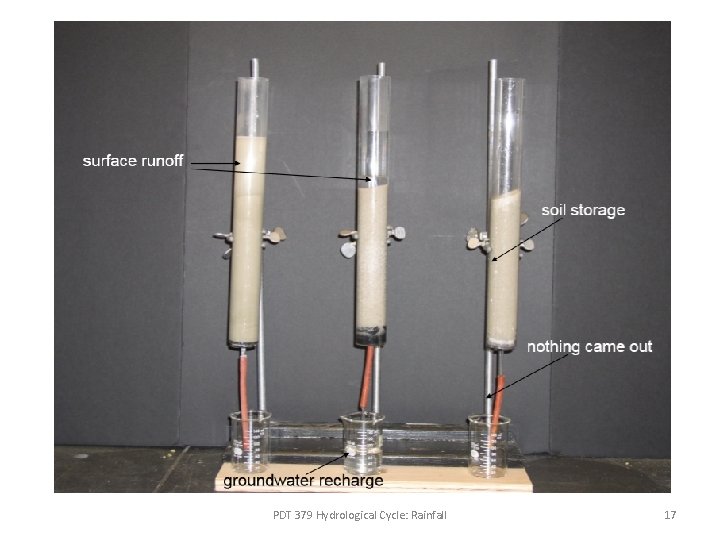
PDT 379 Hydrological Cycle: Rainfall 17
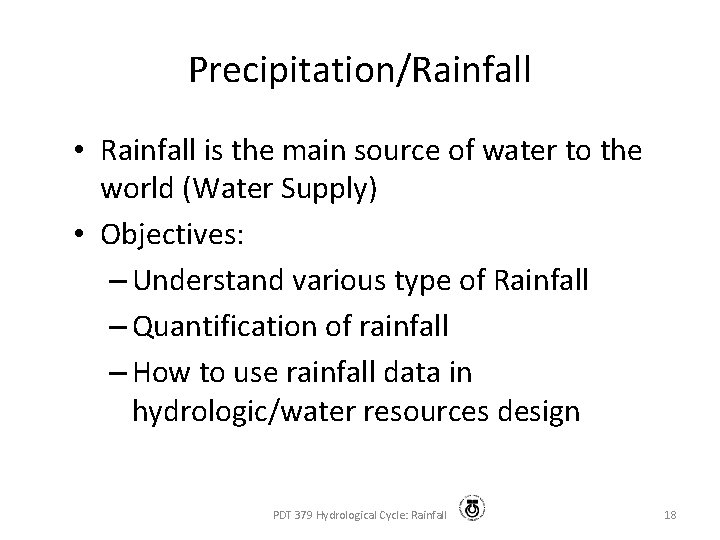
Precipitation/Rainfall • Rainfall is the main source of water to the world (Water Supply) • Objectives: – Understand various type of Rainfall – Quantification of rainfall – How to use rainfall data in hydrologic/water resources design PDT 379 Hydrological Cycle: Rainfall 18
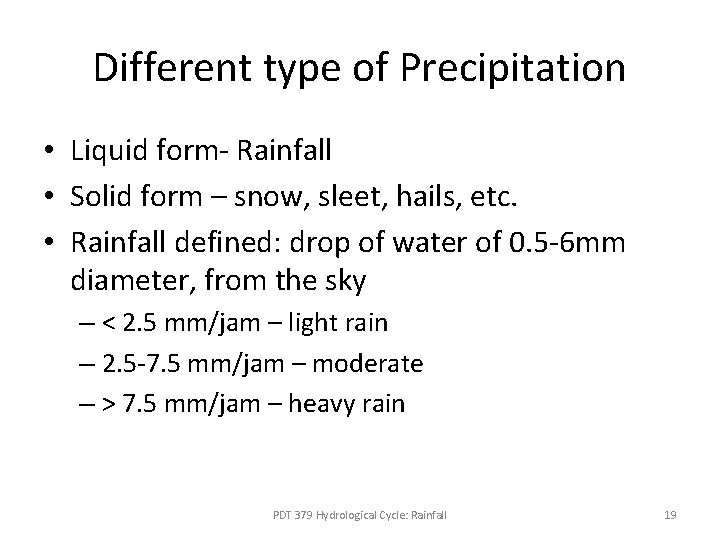
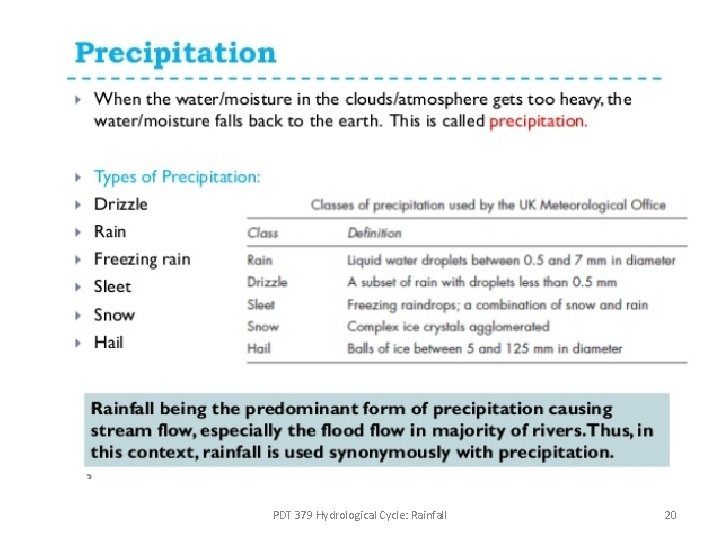
Different type of Precipitation • Liquid form- Rainfall • Solid form – snow, sleet, hails, etc. • Rainfall defined: drop of water of 0. 5 -6 mm diameter, from the sky – < 2. 5 mm/jam – light rain – 2. 5 -7. 5 mm/jam – moderate – > 7. 5 mm/jam – heavy rain PDT 379 Hydrological Cycle: Rainfall 19
PDT 379 Hydrological Cycle: Rainfall 20
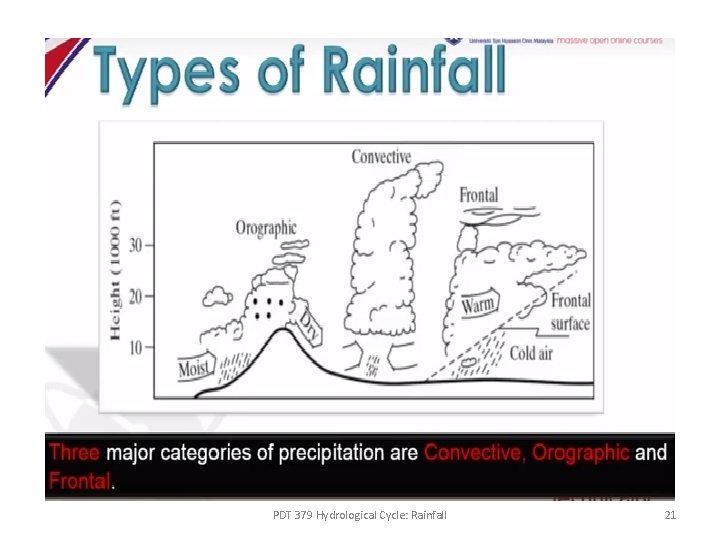
PDT 379 Hydrological Cycle: Rainfall 21
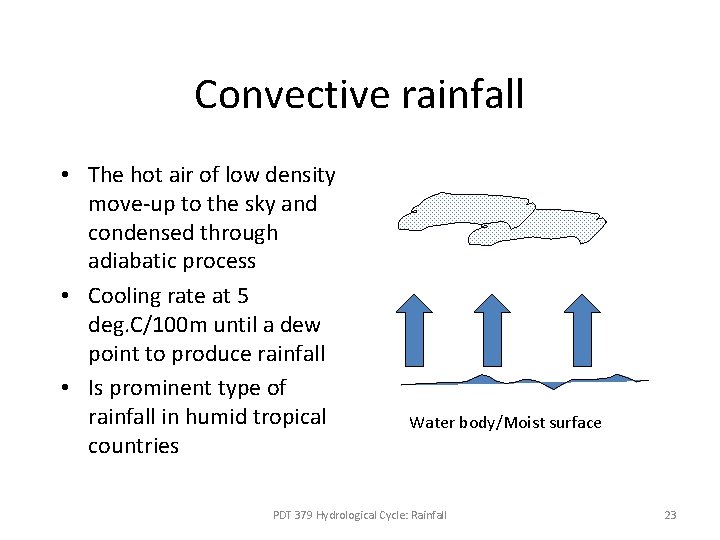
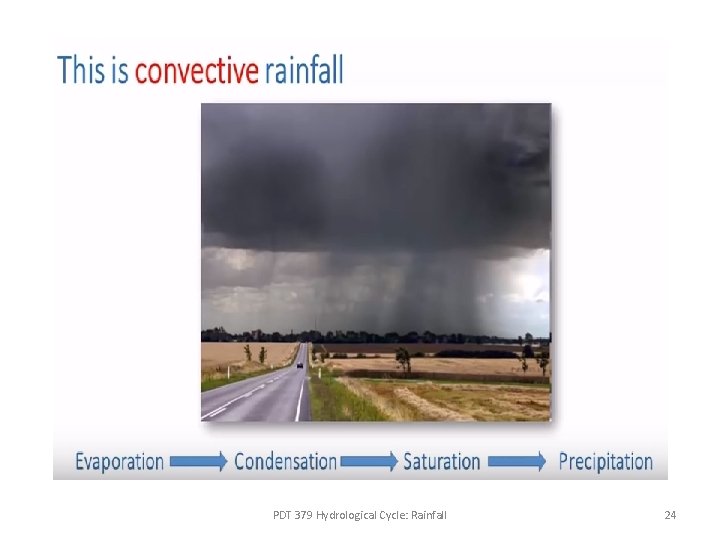
Convective rainfall • The hot air of low density move-up to the sky and condensed through adiabatic process • Cooling rate at 5 deg. C/100 m until a dew point to produce rainfall • Is prominent type of rainfall in humid tropical countries Water body/Moist surface PDT 379 Hydrological Cycle: Rainfall 23
PDT 379 Hydrological Cycle: Rainfall 24
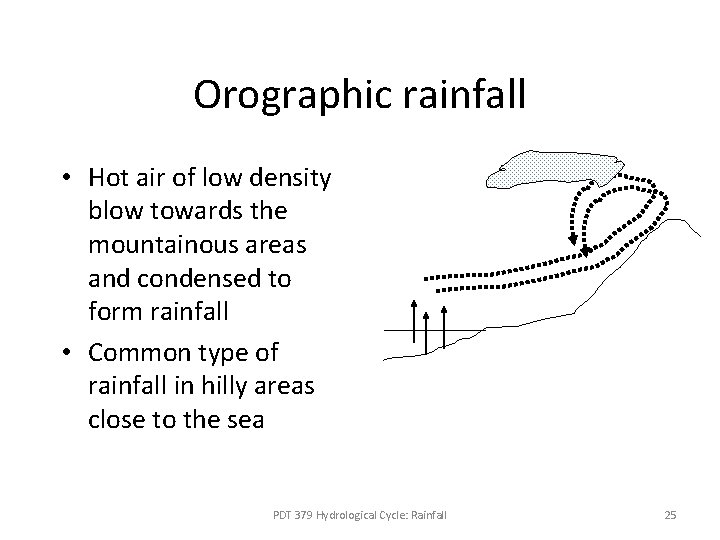
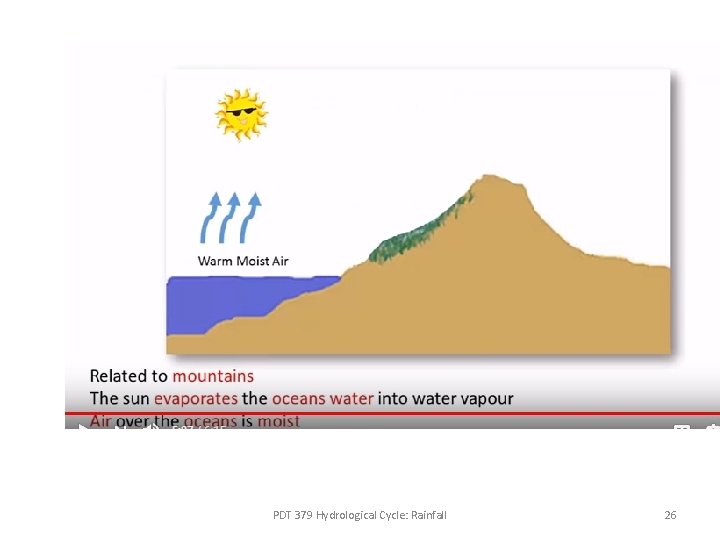
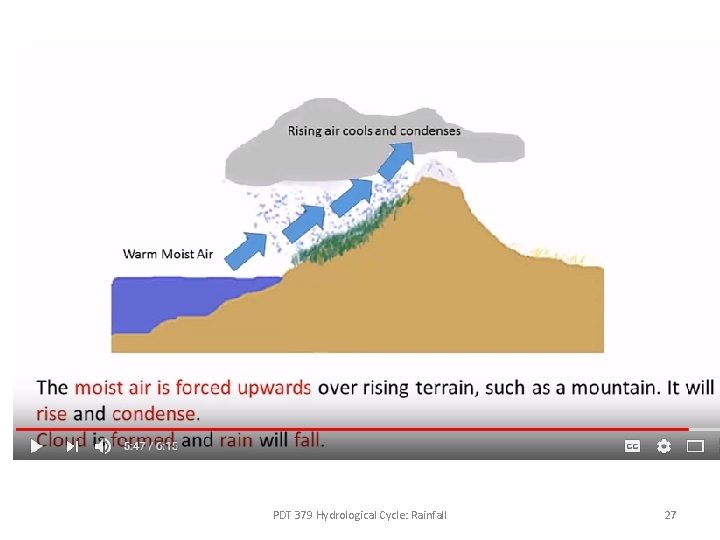
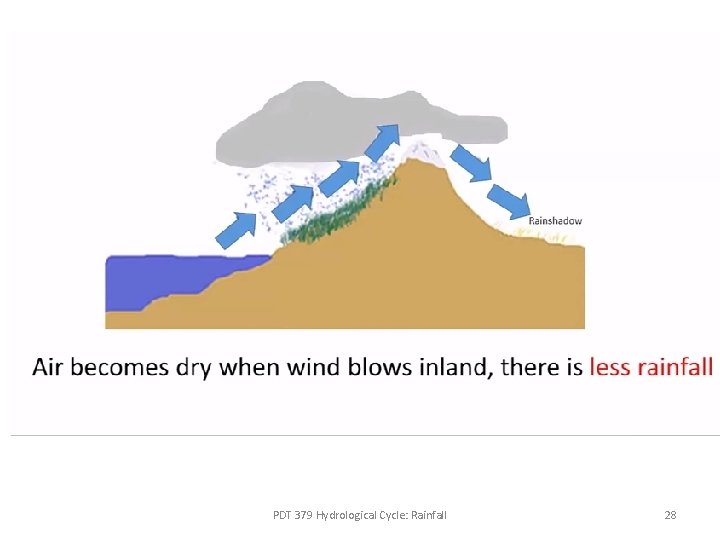
Orographic rainfall • Hot air of low density blow towards the mountainous areas and condensed to form rainfall • Common type of rainfall in hilly areas close to the sea PDT 379 Hydrological Cycle: Rainfall 25
PDT 379 Hydrological Cycle: Rainfall 26
PDT 379 Hydrological Cycle: Rainfall 27
PDT 379 Hydrological Cycle: Rainfall 28
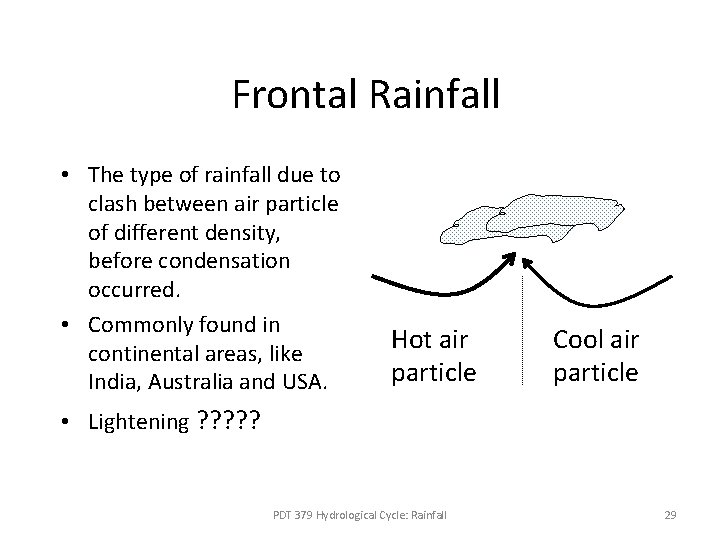
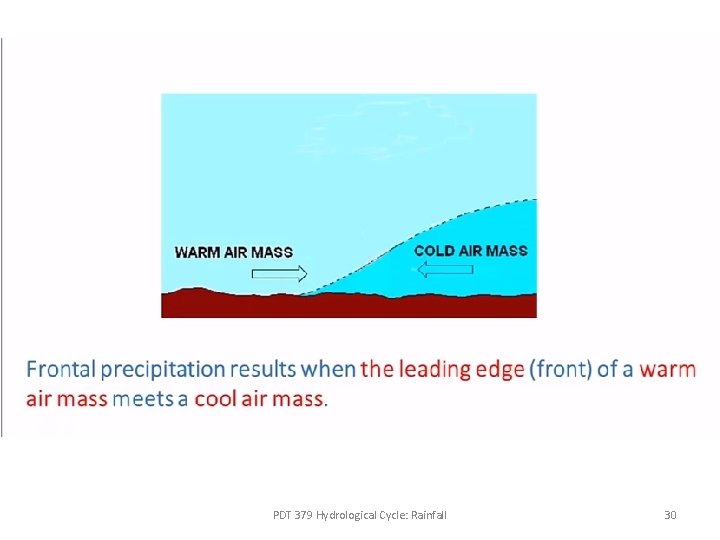
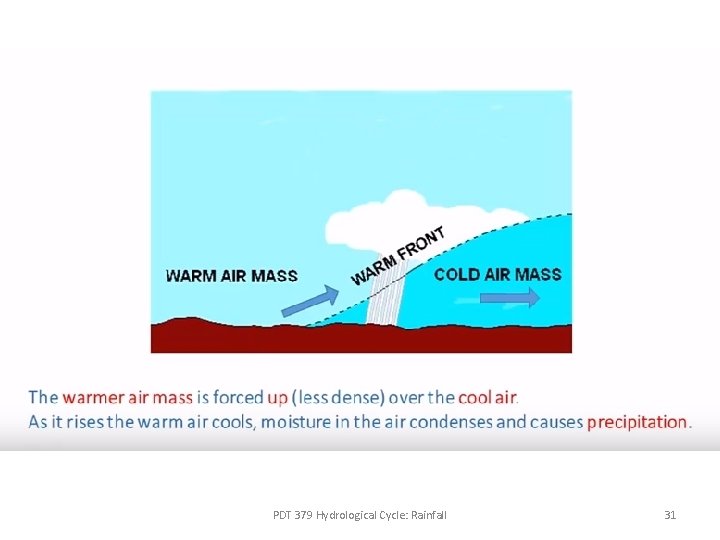
Frontal Rainfall • The type of rainfall due to clash between air particle of different density, before condensation occurred. • Commonly found in continental areas, like India, Australia and USA. Hot air particle Cool air particle • Lightening ? ? ? PDT 379 Hydrological Cycle: Rainfall 29
PDT 379 Hydrological Cycle: Rainfall 30
PDT 379 Hydrological Cycle: Rainfall 31
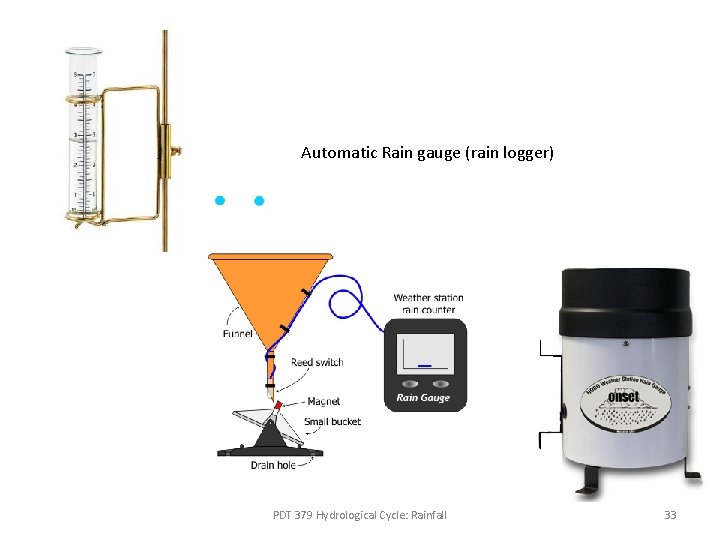
Measurement of Rainfall • Basic equipment: Raingauge • Manual recording & Automatic (graph paper & data logger) • Basic component: timer (clock), graph paper, pen, tipping bucket, funnel • Automatic radio recording gauge • Radar-satellite PDT 379 Hydrological Cycle: Rainfall 32
Automatic Rain gauge (rain logger) PDT 379 Hydrological Cycle: Rainfall 33
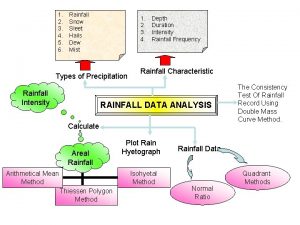
Analysis of rainfall data • Rainfall record: hourly, daily, weekly, monthly, yearly (annual) • Rainfall record: Total, max, min, mean (average) • Rainfall records must complete and sufficient before further analysis can be made to be used in engineering design • 2 concepts in Rainfall analysis – Point rainfall: rainfall record taken from a rainfall station – Aerial rainfall: rainfall record representing an area of study PDT 379 Hydrological Cycle: Rainfall 34
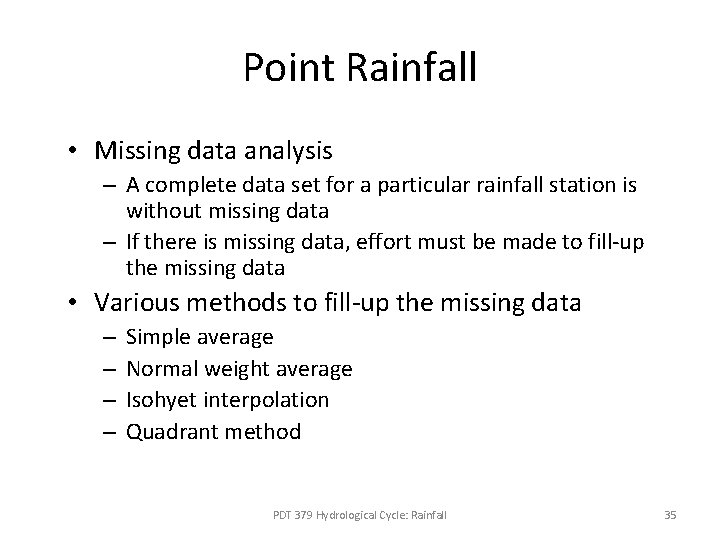
Point Rainfall • Missing data analysis – A complete data set for a particular rainfall station is without missing data – If there is missing data, effort must be made to fill-up the missing data • Various methods to fill-up the missing data – – Simple average Normal weight average Isohyet interpolation Quadrant method PDT 379 Hydrological Cycle: Rainfall 35
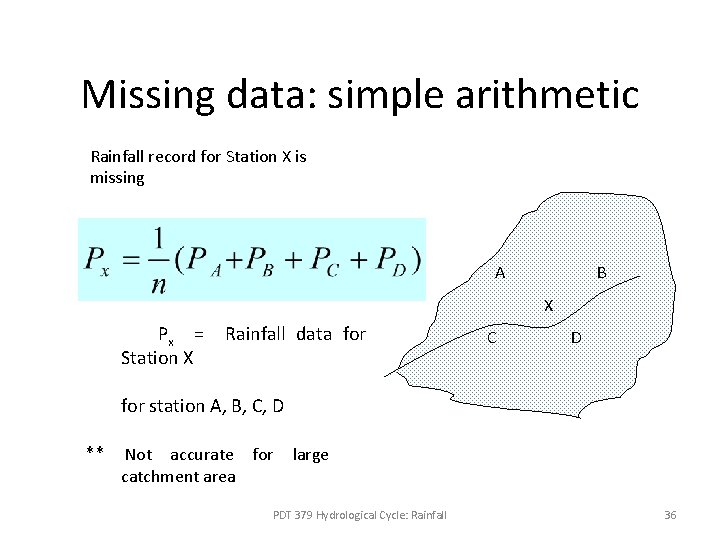
Missing data: simple arithmetic Rainfall record for Station X is missing A B X Px = Station X Rainfall data for C D for station A, B, C, D ** Not accurate for large catchment area PDT 379 Hydrological Cycle: Rainfall 36
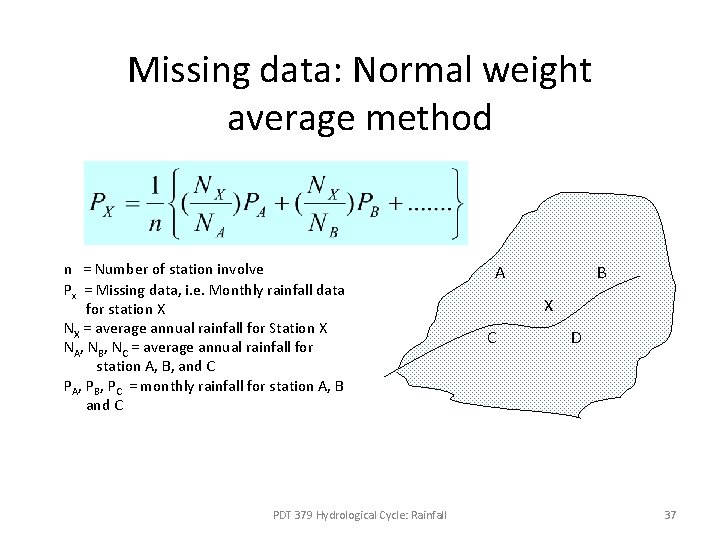
Missing data: Normal weight average method n = Number of station involve Px = Missing data, i. e. Monthly rainfall data for station X NX = average annual rainfall for Station X NA, NB, NC = average annual rainfall for station A, B, and C PA, PB, PC = monthly rainfall for station A, B and C PDT 379 Hydrological Cycle: Rainfall A B X C D 37
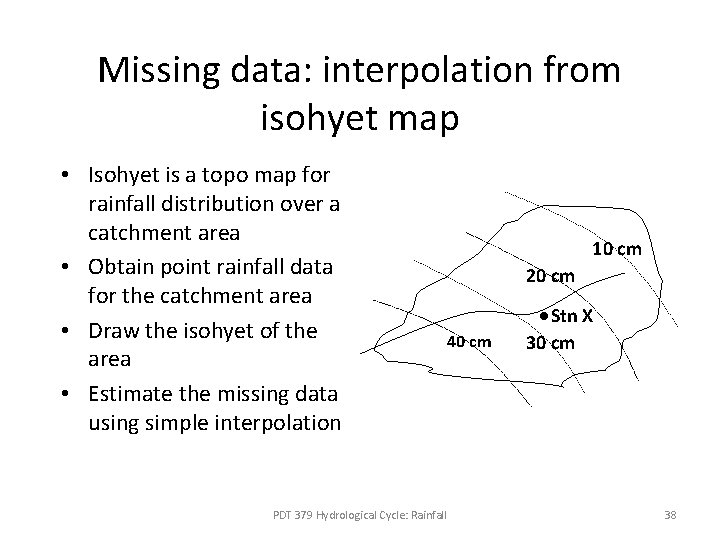
Missing data: interpolation from isohyet map • Isohyet is a topo map for rainfall distribution over a catchment area • Obtain point rainfall data for the catchment area • Draw the isohyet of the area • Estimate the missing data using simple interpolation 10 cm 20 cm 40 cm PDT 379 Hydrological Cycle: Rainfall Stn X 30 cm 38
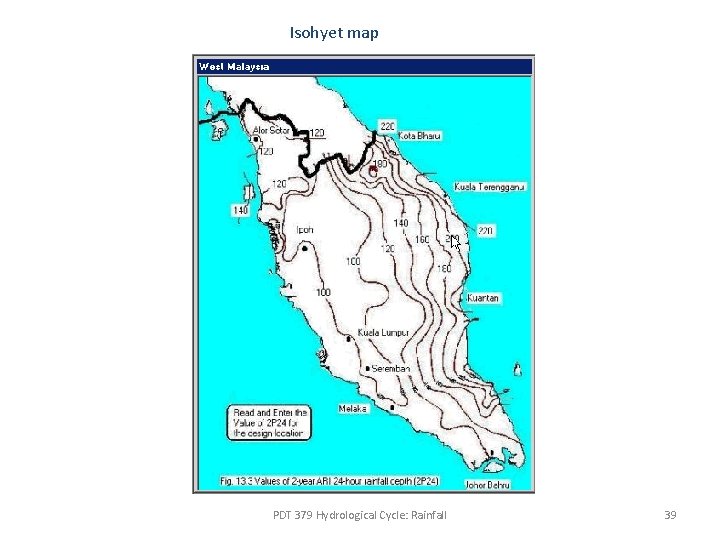
Isohyet map PDT 379 Hydrological Cycle: Rainfall 39
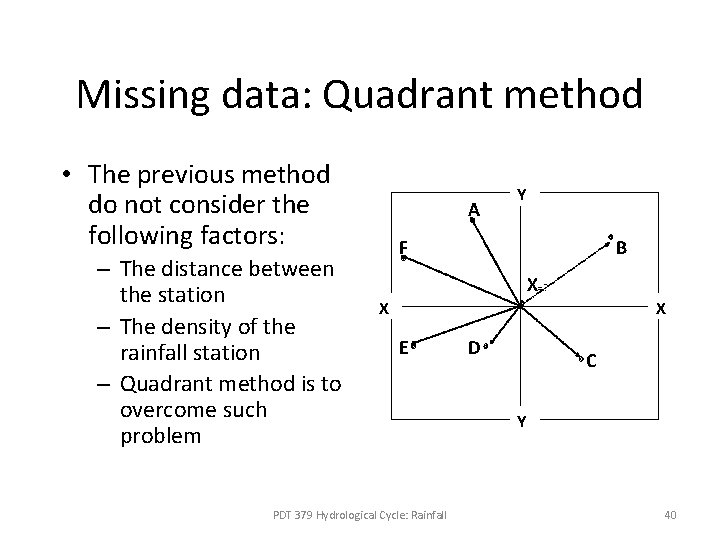
Missing data: Quadrant method • The previous method do not consider the following factors: – The distance between the station – The density of the rainfall station – Quadrant method is to overcome such problem A Y F B X=? X E PDT 379 Hydrological Cycle: Rainfall D X C Y 40
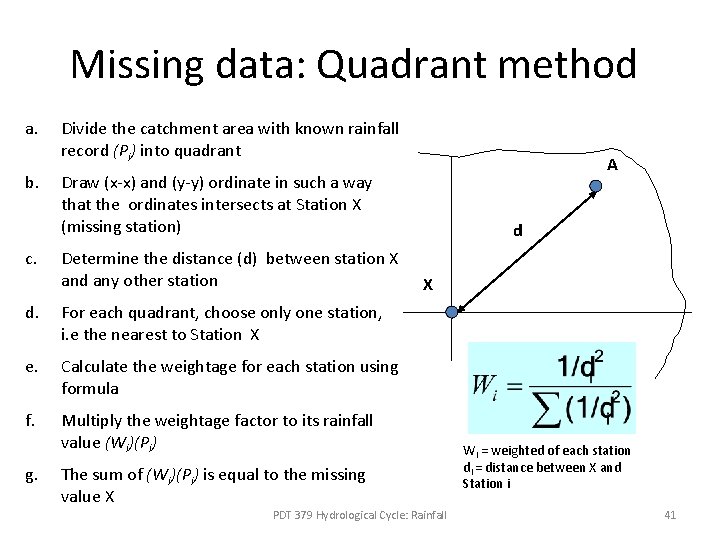
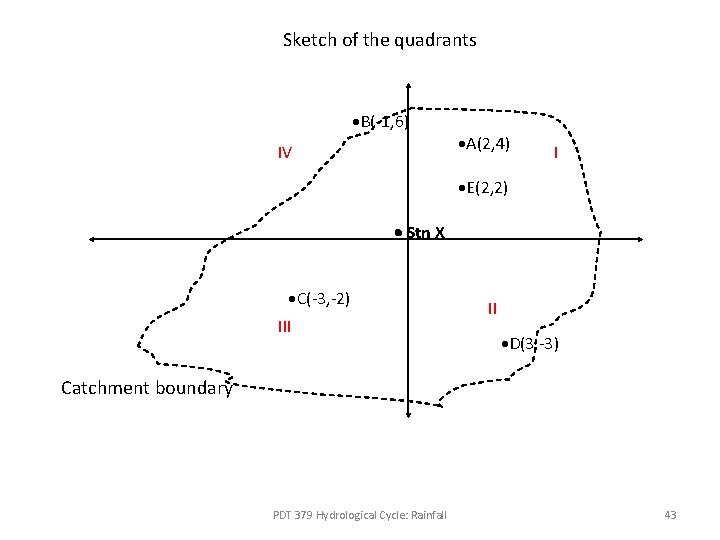
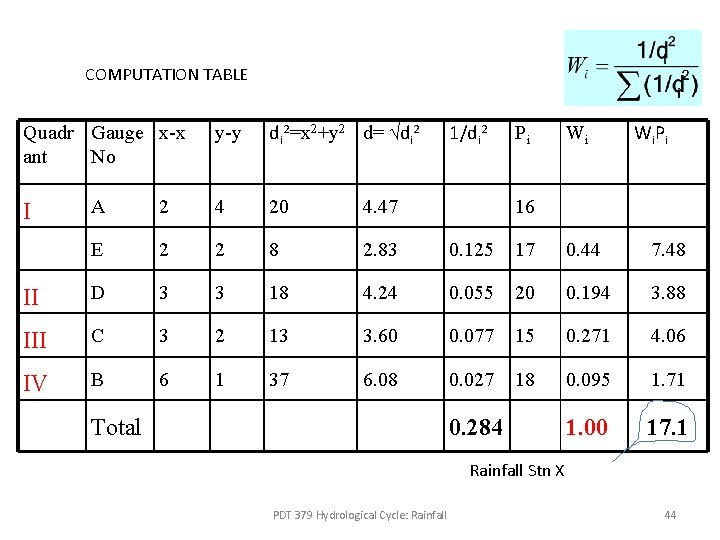
Missing data: Quadrant method a. b. c. Divide the catchment area with known rainfall record (Pi) into quadrant Draw (x-x) and (y-y) ordinate in such a way that the ordinates intersects at Station X (missing station) Determine the distance (d) between station X and any other station d. For each quadrant, choose only one station, i. e the nearest to Station X e. Calculate the weightage for each station using formula f. Multiply the weightage factor to its rainfall value (Wi)(Pi) g. A d X The sum of (Wi)(Pi) is equal to the missing value X PDT 379 Hydrological Cycle: Rainfall Wi = weighted of each station di = distance between X and Station i 41
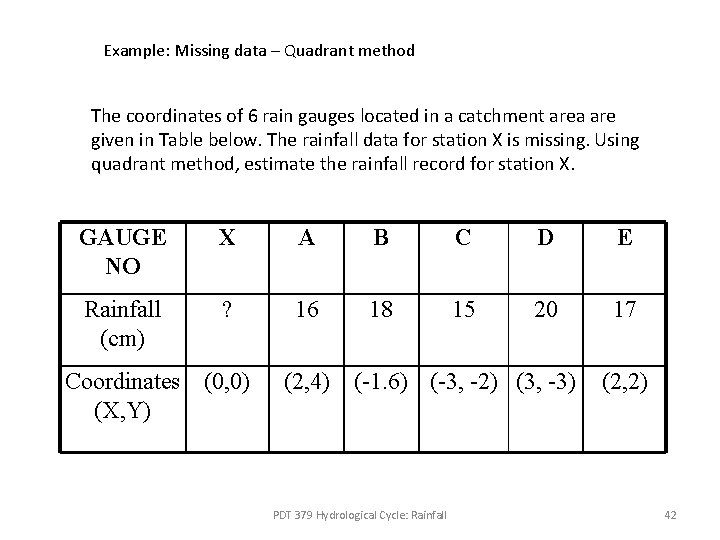
Example: Missing data – Quadrant method The coordinates of 6 rain gauges located in a catchment area are given in Table below. The rainfall data for station X is missing. Using quadrant method, estimate the rainfall record for station X. GAUGE NO X A B C D E Rainfall (cm) ? 16 18 15 20 17 Coordinates (0, 0) (X, Y) (2, 4) (-1. 6) (-3, -2) (3, -3) PDT 379 Hydrological Cycle: Rainfall (2, 2) 42
Sketch of the quadrants B(-1, 6) A(2, 4) IV I E(2, 2) Stn X C(-3, -2) III II D(3, -3) Catchment boundary PDT 379 Hydrological Cycle: Rainfall 43
COMPUTATION TABLE Quadr Gauge x-x ant No y-y di 2=x 2+y 2 d= √di 2 1/di 2 Pi Wi Wi. Pi A 2 4 20 4. 47 E 2 2 8 2. 83 0. 125 17 0. 44 7. 48 II D 3 3 18 4. 24 0. 055 20 0. 194 3. 88 III C 3 2 13 3. 60 0. 077 15 0. 271 4. 06 IV B 6 1 37 6. 08 0. 027 18 0. 095 1. 71 1. 00 17. 1 I Total 16 0. 284 Rainfall Stn X PDT 379 Hydrological Cycle: Rainfall 44
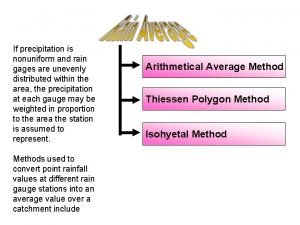
Areal Rainfall • Most civil engineering project involve area/regional development • Therefore, rainfall record must be in the form of ‘areal’ • Unfortunately, rainfall record can only be obtained through point measurement (point rainfall) • Thus, point value must be converted into areal value • 5 methods: simple average, poligon Theissen, Isohyetal, Hipsometric, multiple quadrant PDT 379 Hydrological Cycle: Rainfall 45
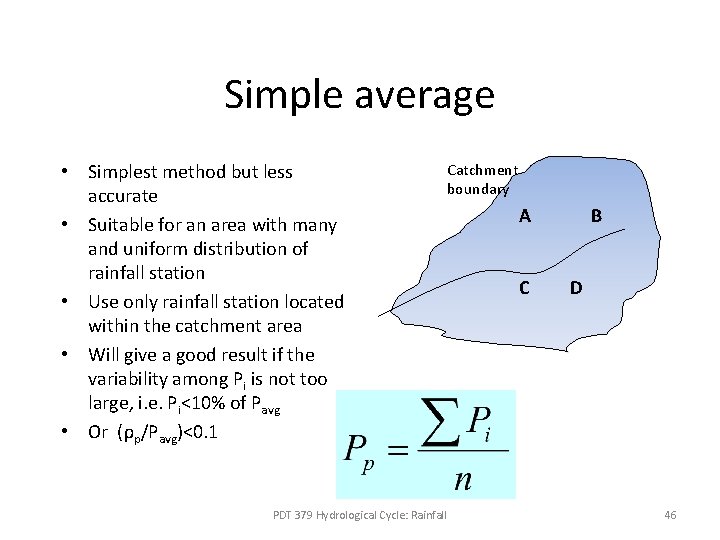
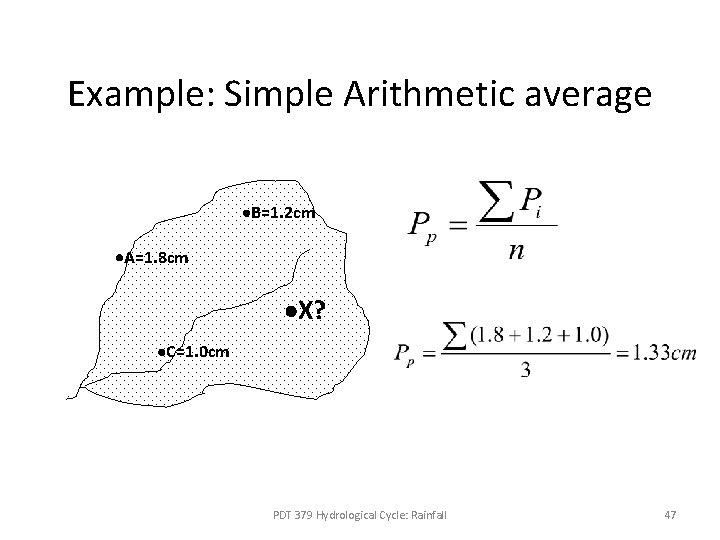
Simple average • Simplest method but less accurate • Suitable for an area with many and uniform distribution of rainfall station • Use only rainfall station located within the catchment area • Will give a good result if the variability among Pi is not too large, i. e. Pi<10% of Pavg • Or (ρp/Pavg)<0. 1 PDT 379 Hydrological Cycle: Rainfall Catchment boundary A C B D 46
Example: Simple Arithmetic average B=1. 2 cm A=1. 8 cm X? C=1. 0 cm PDT 379 Hydrological Cycle: Rainfall 47
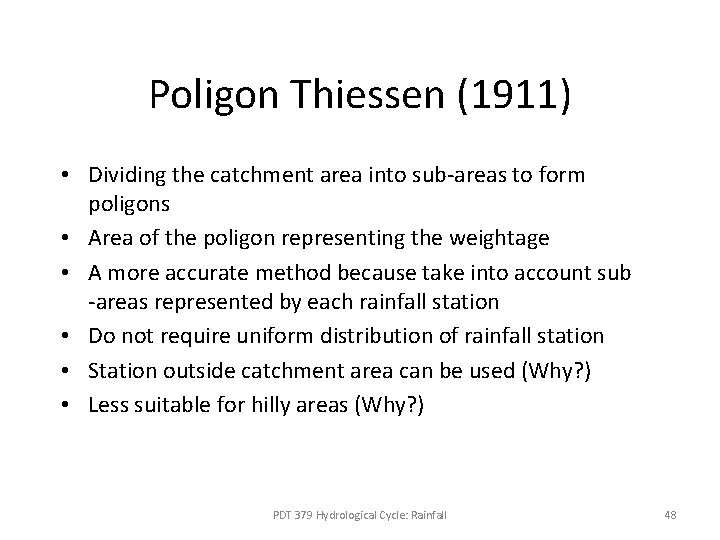
Poligon Thiessen (1911) • Dividing the catchment area into sub-areas to form poligons • Area of the poligon representing the weightage • A more accurate method because take into account sub -areas represented by each rainfall station • Do not require uniform distribution of rainfall station • Station outside catchment area can be used (Why? ) • Less suitable for hilly areas (Why? ) PDT 379 Hydrological Cycle: Rainfall 48
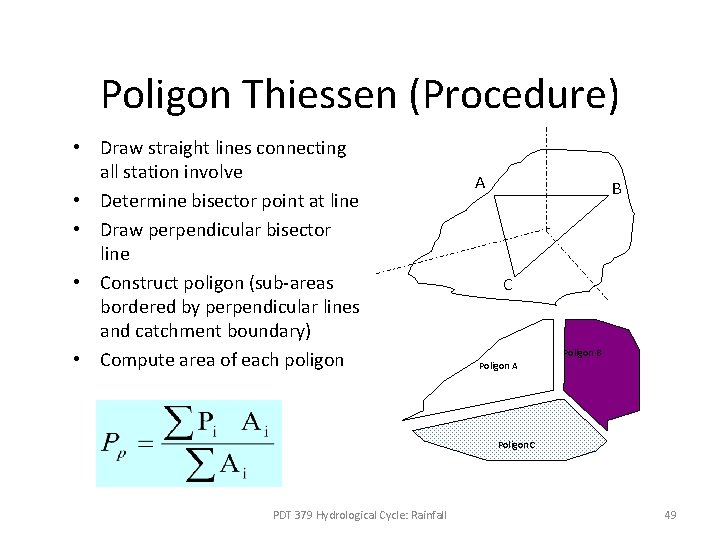
Poligon Thiessen (Procedure) • Draw straight lines connecting all station involve • Determine bisector point at line • Draw perpendicular bisector line • Construct poligon (sub-areas bordered by perpendicular lines and catchment boundary) • Compute area of each poligon A B C Poligon B Poligon A Poligon C PDT 379 Hydrological Cycle: Rainfall 49
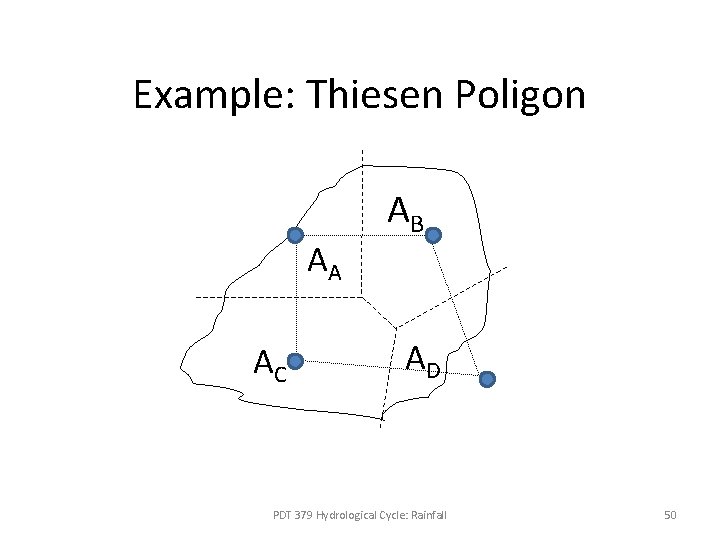
Example: Thiesen Poligon AA AC AB AD PDT 379 Hydrological Cycle: Rainfall 50
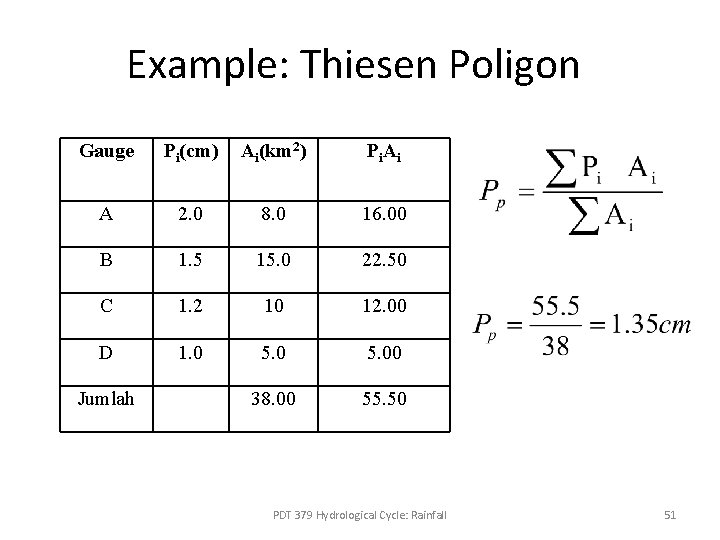
Example: Thiesen Poligon Gauge Pi(cm) Ai(km 2) Pi. Ai A 2. 0 8. 0 16. 00 B 1. 5 15. 0 22. 50 C 1. 2 10 12. 00 D 1. 0 5. 00 38. 00 55. 50 Jumlah PDT 379 Hydrological Cycle: Rainfall 51
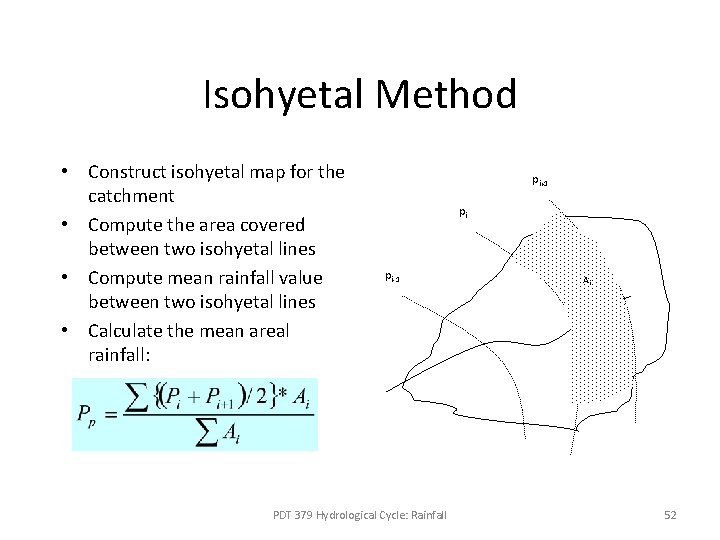
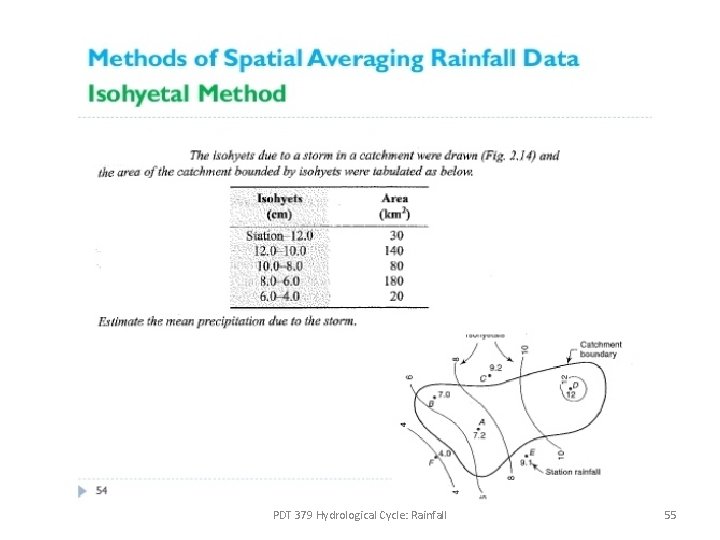
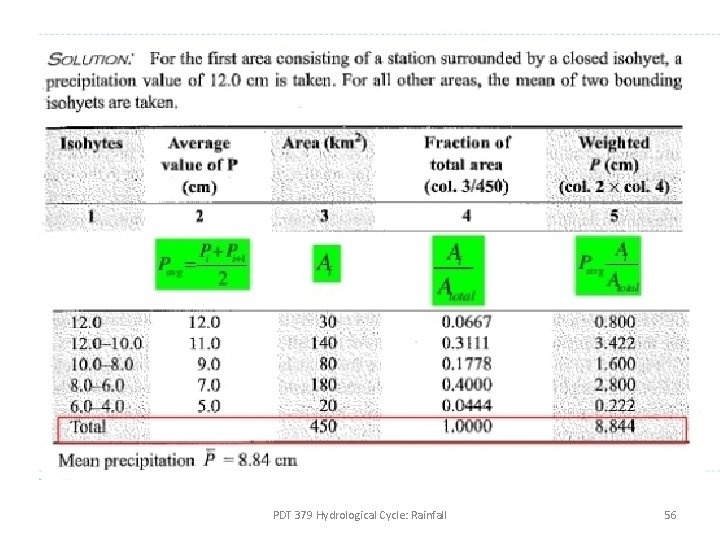
Isohyetal Method • Construct isohyetal map for the catchment • Compute the area covered between two isohyetal lines • Compute mean rainfall value between two isohyetal lines • Calculate the mean areal rainfall: pi+1 pi pi-1 PDT 379 Hydrological Cycle: Rainfall Ai 52
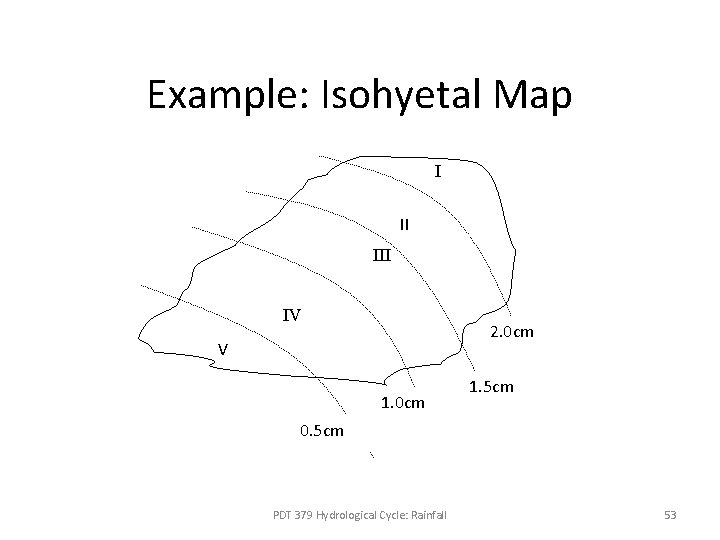
Example: Isohyetal Map I II IV 2. 0 cm V 1. 0 cm 1. 5 cm 0. 5 cm PDT 379 Hydrological Cycle: Rainfall 53
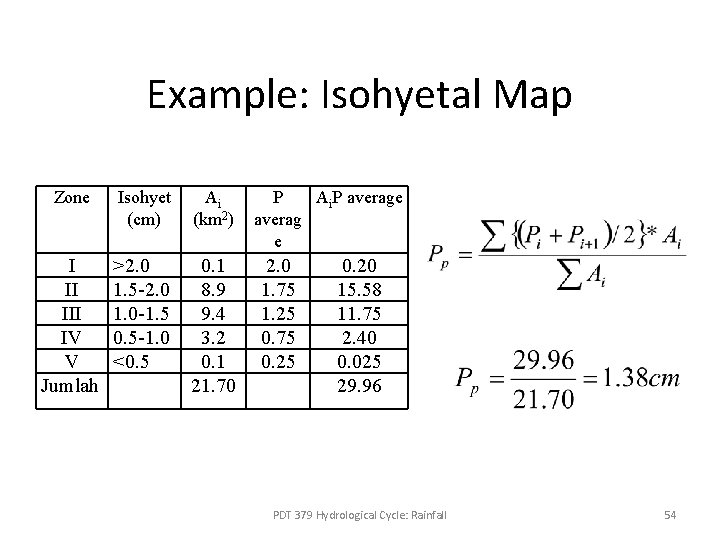
Example: Isohyetal Map Zone Isohyet (cm) Ai (km 2) I II IV V Jumlah >2. 0 1. 5 -2. 0 1. 0 -1. 5 0. 5 -1. 0 <0. 5 0. 1 8. 9 9. 4 3. 2 0. 1 21. 70 P Ai. P average averag e 2. 0 1. 75 1. 25 0. 75 0. 20 15. 58 11. 75 2. 40 0. 025 29. 96 PDT 379 Hydrological Cycle: Rainfall 54
PDT 379 Hydrological Cycle: Rainfall 55
PDT 379 Hydrological Cycle: Rainfall 56
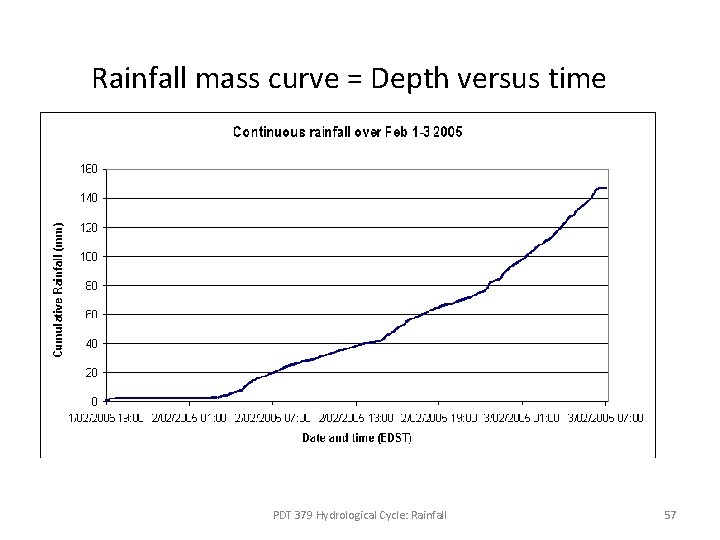
Rainfall mass curve = Depth versus time PDT 379 Hydrological Cycle: Rainfall 57
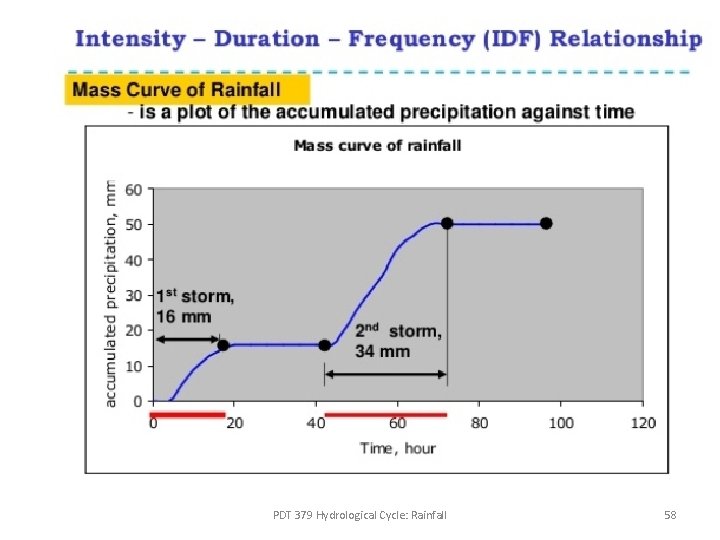
PDT 379 Hydrological Cycle: Rainfall 58
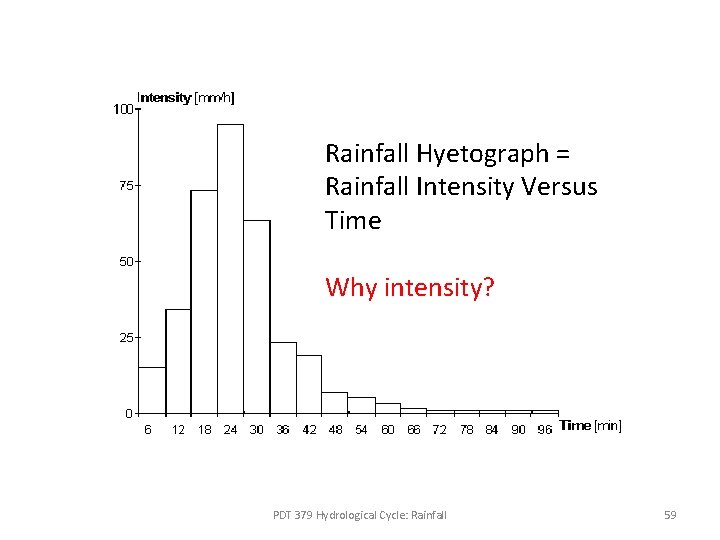
Rainfall Hyetograph = Rainfall Intensity Versus Time Why intensity? PDT 379 Hydrological Cycle: Rainfall 59
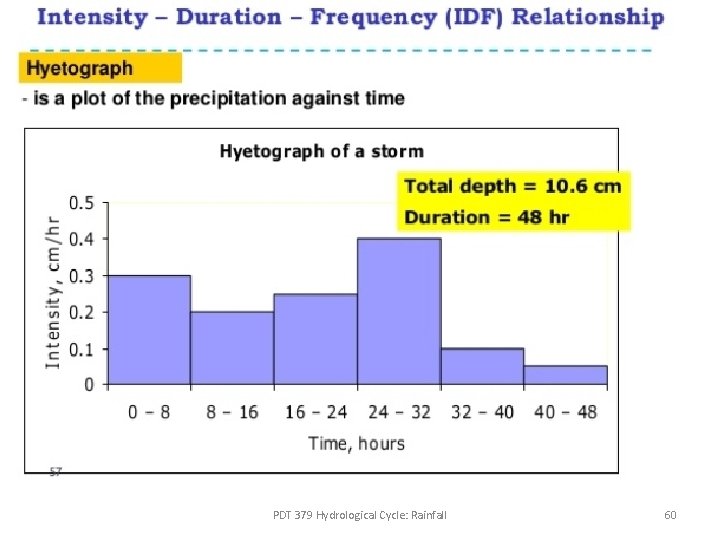
PDT 379 Hydrological Cycle: Rainfall 60