
Hydrology and Water Resources RG 744 October 2
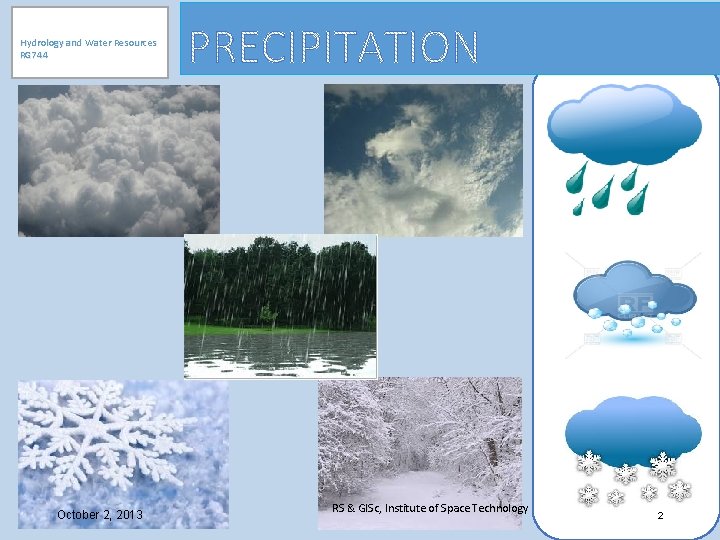
Hydrology and Water Resources RG 744 October 2, 2013 RS & GISc, Institute of Space Technology 2
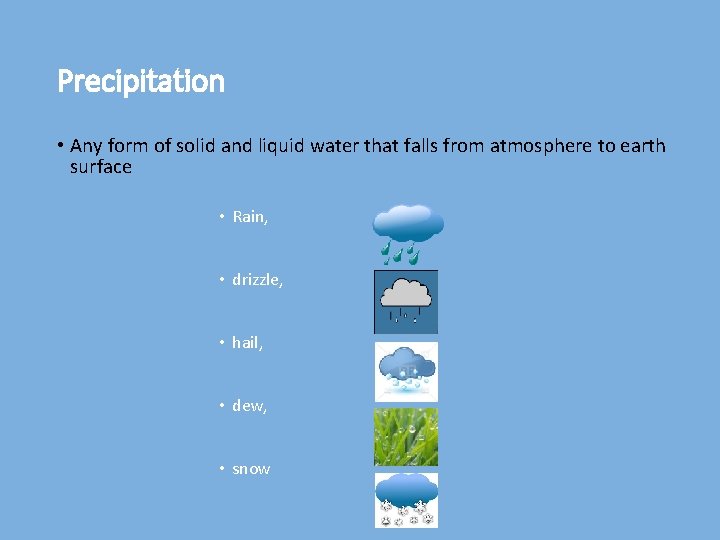
Precipitation • Any form of solid and liquid water that falls from atmosphere to earth surface • Rain, • drizzle, • hail, • dew, • snow
Types of Precipitation • The precipitation types can be categorized as • Frontal Precipitation • The formation of precipitation due to the convergence of two air masses with contrasting temperature and densities • Convective Precipitation • Upward movement of warm air with low density than its surrounding air rises till it reaches to a level where it has the temperature of its environment. The temperature contrast causes convection and cools adiabatically and clouds are made that burst into thunderstorm • Convective storms are generally known as thunderstorms • Orographic Precipitation • Uplift of an air mass because of a topographic obstruction. • Uplift also causes the cooling of the air mass. If enough cooling occurs condensation can occur and form into orographic precipitation
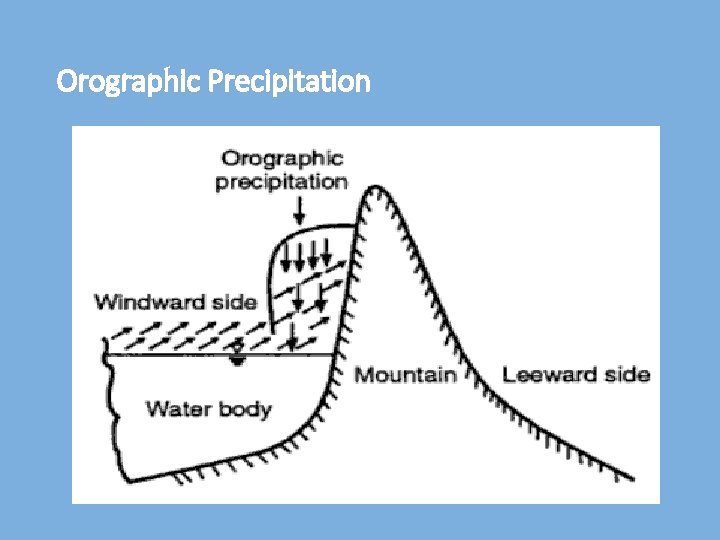
Orographic Precipitation
• Cyclonic Precipitation • Air mass that converges into a low pressure area moves up due to difference in pressure and winds blow spirally inward • Precipitation due to Turbulent Ascent • Condensation of air mass that moves up due to increased turbulence and friction of earth surface after its travel over ocean
Measurement of Precipitation • Total amount (depth) over some time period (hourly, daily, monthly, seasonally, or annually) • Problems: • Many records are not available for rural areas • Discontinuous or short term
Methods of Measurement • Rain gauges • Radar (Radio Detection and Ranging) • Weather Satellites
Rain Gauges • Symon’s (non-recording) Type • Weighing Bucket Type (mass curve) • Tipping Bucket • Siphon or Floating Gauge • Storage Rain Gauge (for remote areas) • Telemetring Rain Gauge (inaccessible places) • Automatic Radio Reporting Gauge
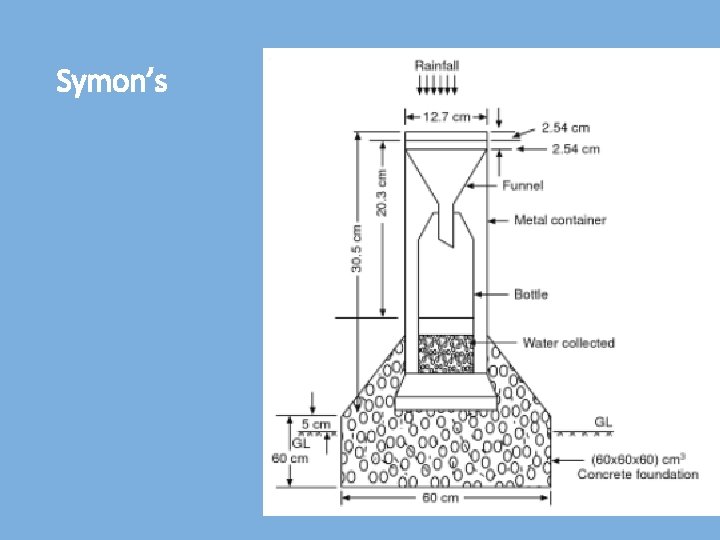
Symon’s
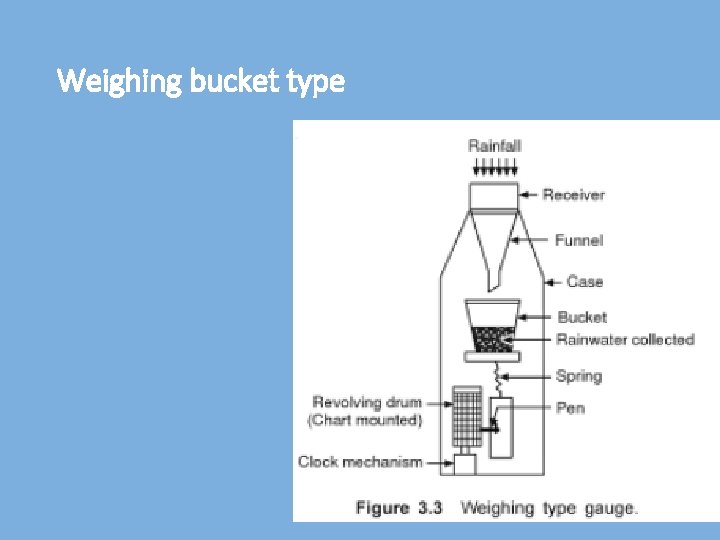
Weighing bucket type
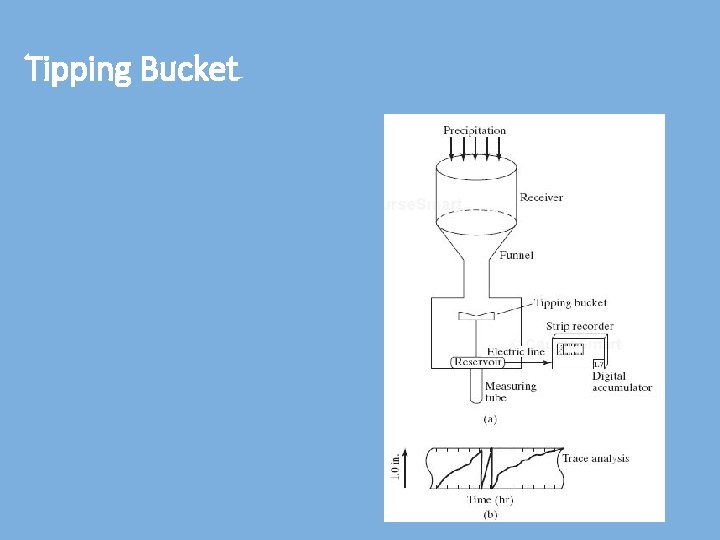
Tipping Bucket
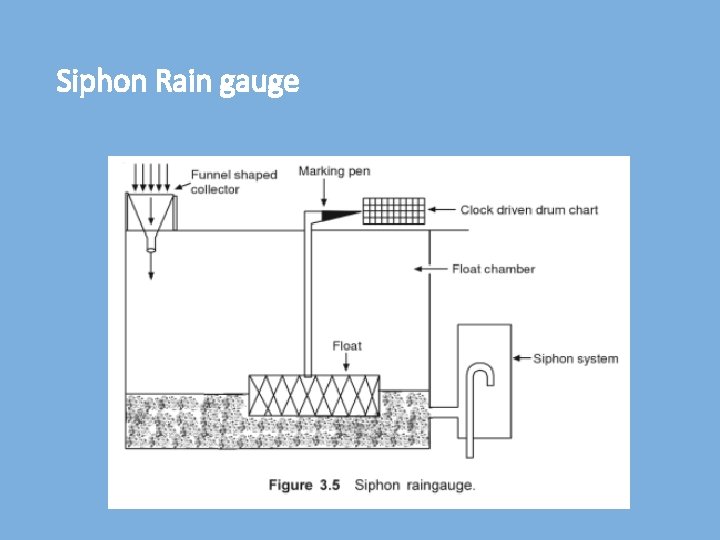
Siphon Rain gauge
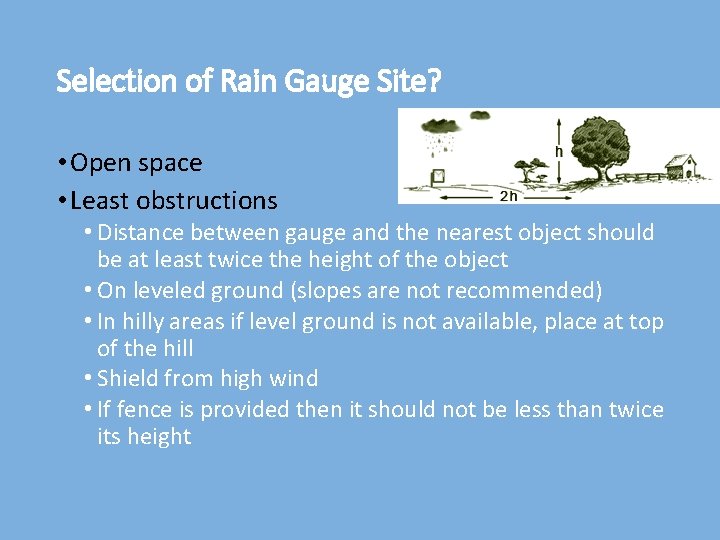
Selection of Rain Gauge Site? • Open space • Least obstructions • Distance between gauge and the nearest object should be at least twice the height of the object • On leveled ground (slopes are not recommended) • In hilly areas if level ground is not available, place at top of the hill • Shield from high wind • If fence is provided then it should not be less than twice its height
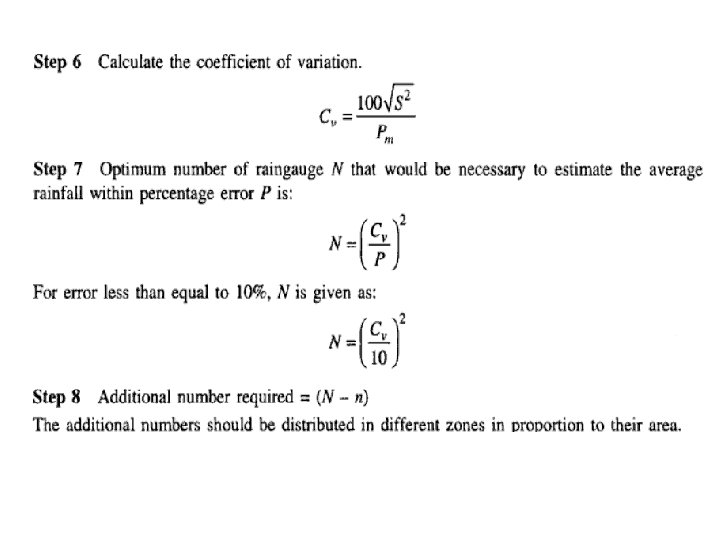
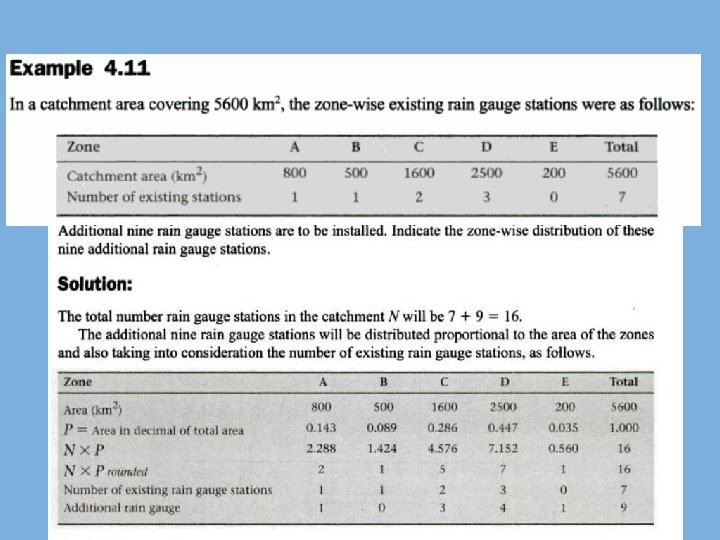
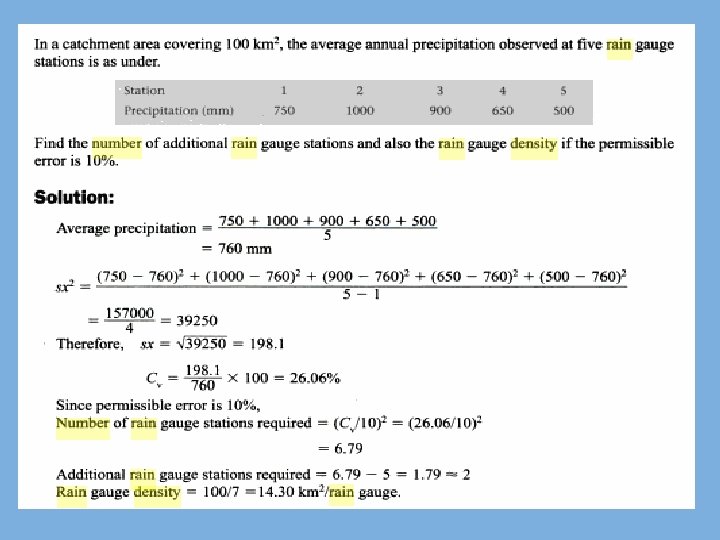
Adequacy of Rainfall Station • A well distributed network is essential • Statistical Analysis • To give necessary average rainfall with certain % Error • Number of stations required for a given area • How to estimate? (Reference: Hydrology by Das & Saikia)
World Meteorological Organization (WMO) Recommendations • Flat regions of temperate, Mediterranean and tropical zones • Ideal – 1 station for 600 -900 sq. km. • Acceptable – 1 station for 900 -3, 000 sq. km. • Mountainous regions of temperate, Mediterranean and tropical zones • Ideal – 1 station for 100 -250 sq. km. • Acceptable – 1 station for 250 -1, 000 sq. km. • Arid and polar zones • Ideal – 1 station for 1, 500 -10, 000 sq. km. Depending on the feasibility. • 10% of rain gauge stations should be equipped with self recording rain gauges
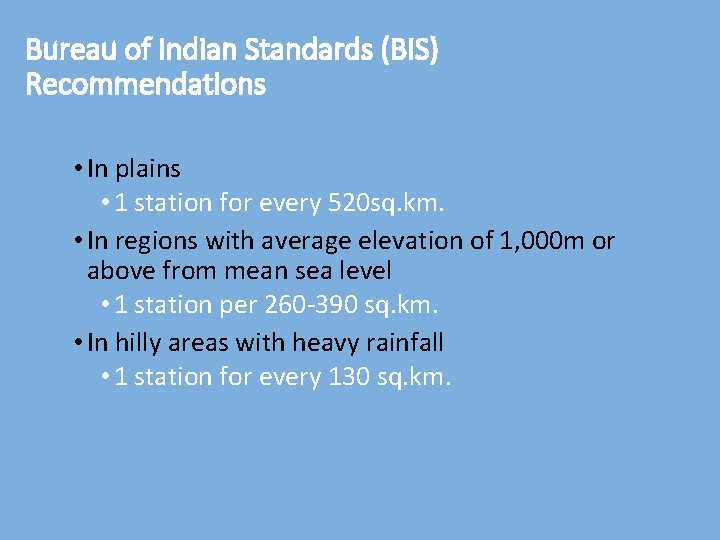
Bureau of Indian Standards (BIS) Recommendations • In plains • 1 station for every 520 sq. km. • In regions with average elevation of 1, 000 m or above from mean sea level • 1 station per 260 -390 sq. km. • In hilly areas with heavy rainfall • 1 station for every 130 sq. km.
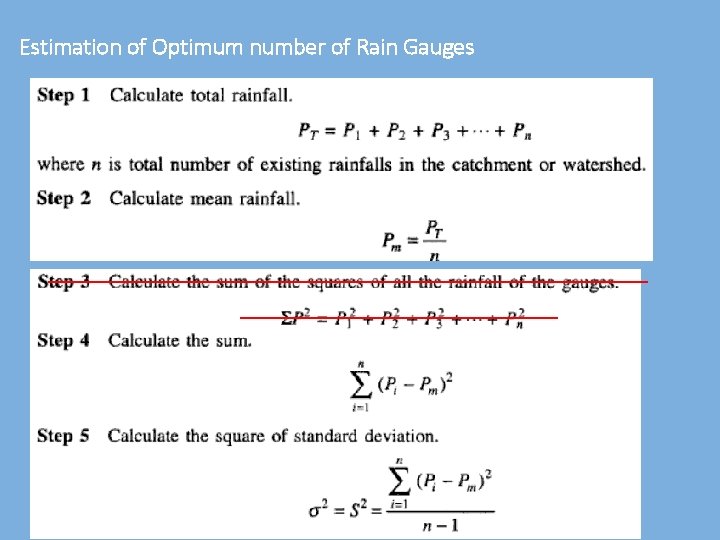
Estimation of Optimum number of Rain Gauges
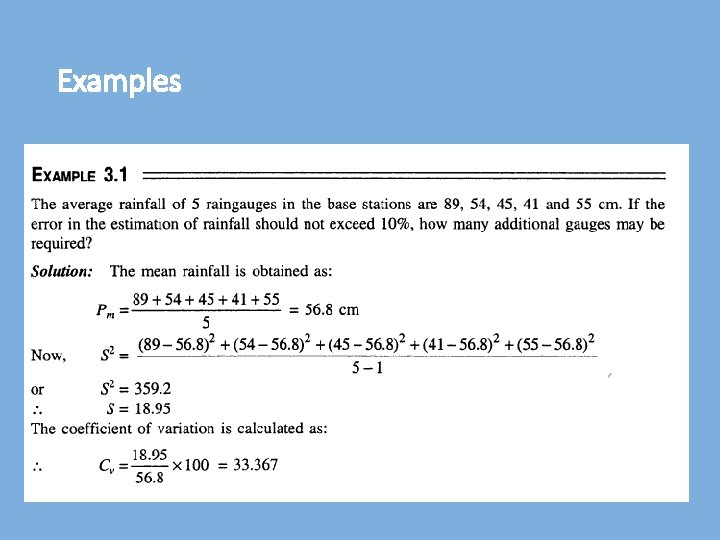
Examples
Radar Measurement • Weather radar detects, measure and locates precipitation • Usually used to supplement gauge data • Radar signals reflected by rain • Determine magnitude and areal distribution • Sending microwave signals and listening for return signals • Timings of return signals give range of an object • The amount of energy reflected back to the radar is proportional to the precipitation intensity
Weather satellites • Used to monitor weather and climate of the Earth • Can provide useful information on rainfall distribution over large areas and inaccessible regions • Direct measurement of rainfall from satellites is not feasible because the presence of clouds
Weather satellites • Provide information only about the cloud tops rather than cloud bases or interiors Examples • Polar orbiting • NOAA-N series • Geostationary • GOES (operated by the United States National Environmental Satellite) • GMS (by the Japan Meteorological Agency), and • Meteosat
Analysis of Precipitation • Mean Rainfall • Estimating Missing data • Double Mass Analysis • Frequency Analysis • Depth Area Duration Curve • Rainfall Hyetographs • Intensity Duration Frequency Curve • Frequency (IDF) Curves
Calculation of Mean Watershed Precipitation • Arithmetic Method • Thiessen Polygon Method • Isohyetal Method
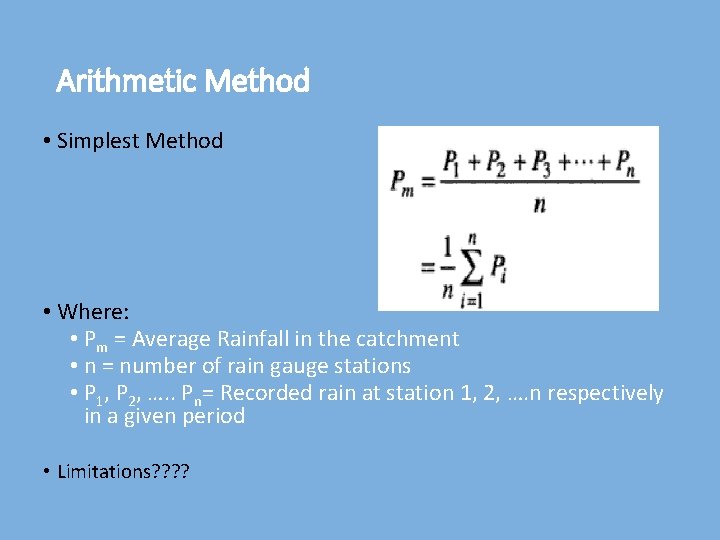
Arithmetic Method • Simplest Method • Where: • Pm = Average Rainfall in the catchment • n = number of rain gauge stations • P 1, P 2, …. . Pn= Recorded rain at station 1, 2, …. n respectively in a given period • Limitations? ?
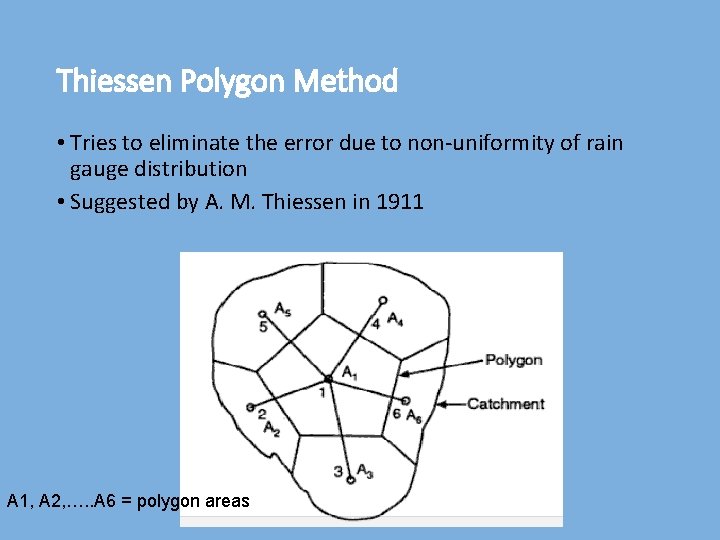
Thiessen Polygon Method • Tries to eliminate the error due to non-uniformity of rain gauge distribution • Suggested by A. M. Thiessen in 1911 A 1, A 2, …. . A 6 = polygon areas
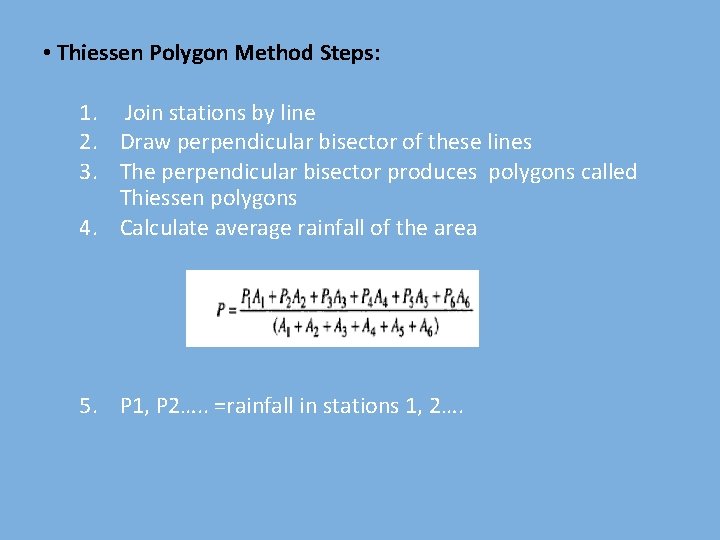
• Thiessen Polygon Method Steps: 1. Join stations by line 2. Draw perpendicular bisector of these lines 3. The perpendicular bisector produces polygons called Thiessen polygons 4. Calculate average rainfall of the area 5. P 1, P 2…. . =rainfall in stations 1, 2….
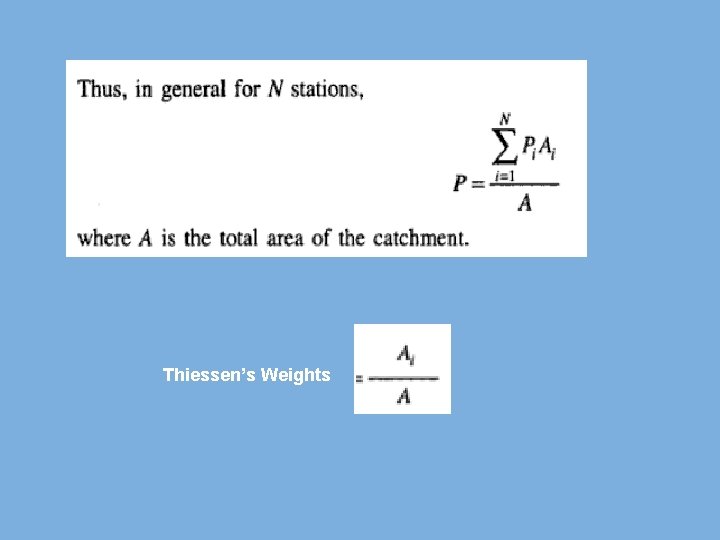
Thiessen’s Weights
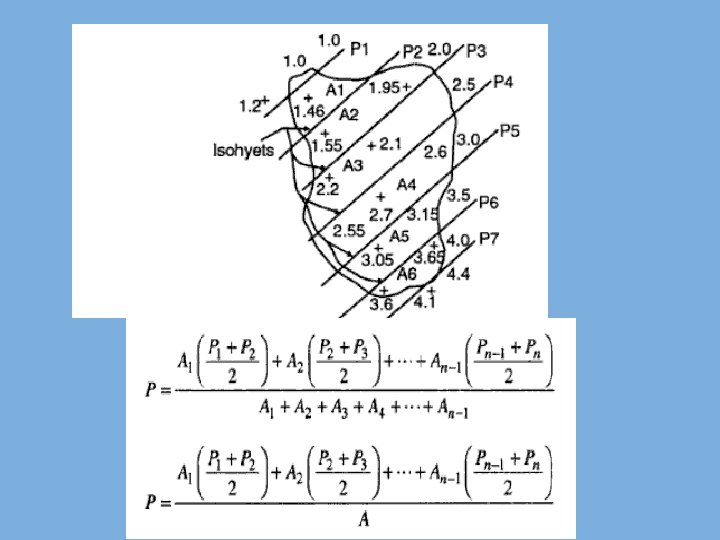
Isohyetal Method • More accurate than other methods • Location and precipitation are plotted • Contours of equal precipitation called Isohyets are drawn • Calculate area between successive isohyets • The equivalent uniform depth of precipitation between isohyets is assumed to be equal to the median value of two isohyets
Adjustment for Missing Data • If rain gauge data at 1 or 2 stations is missing • Interpolation in the estimation of average rainfall • Data from neighboring stations is used • ‘Normal Rainfall’ used as a standard for comparison • ‘Normal Rainfall’ is the average value of rainfall at a particular date, month or year over a specified 30 -year period.
Estimating Point Rainfall at a given Location • Interpolation • From recorded values at surrounding sites • Arithmetic Mean Method • Inverse distance square • Normal Ratio Method • Station Year Method • Double Mass Curve
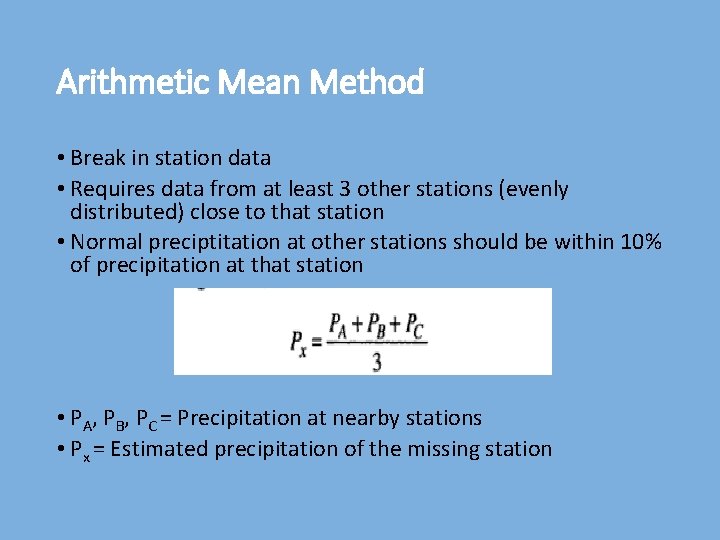
Arithmetic Mean Method • Break in station data • Requires data from at least 3 other stations (evenly distributed) close to that station • Normal preciptitation at other stations should be within 10% of precipitation at that station • PA, PB, PC = Precipitation at nearby stations • Px = Estimated precipitation of the missing station
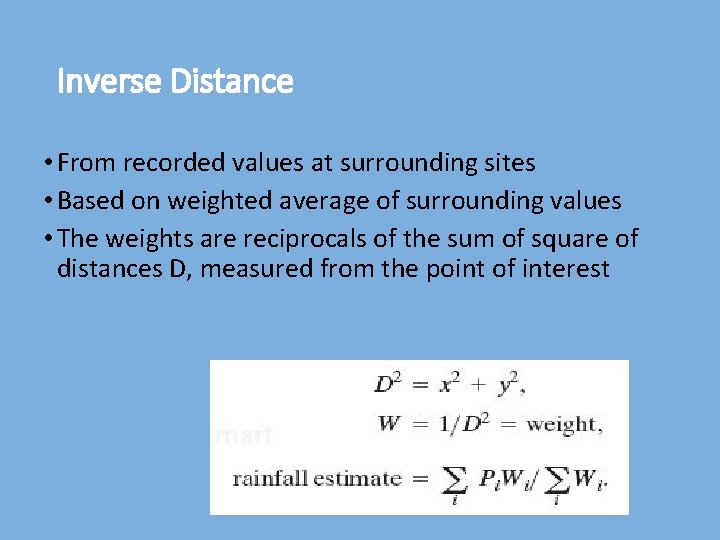
Inverse Distance • From recorded values at surrounding sites • Based on weighted average of surrounding values • The weights are reciprocals of the sum of square of distances D, measured from the point of interest
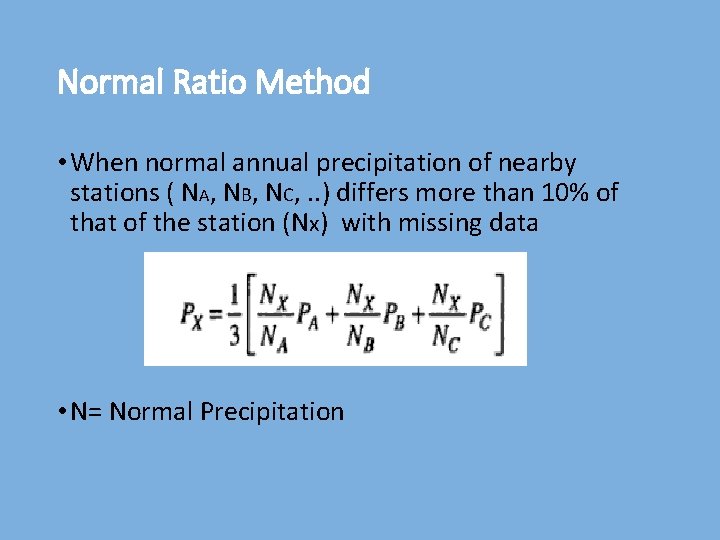
Normal Ratio Method • When normal annual precipitation of nearby stations ( NA, NB, NC, . . ) differs more than 10% of that of the station (Nx) with missing data • N= Normal Precipitation
Station Year Method • Record of 2 or more independent stations are combined • Area of these stations should be climatologically same • Missing record at certain station in particular year is found by ratio of the average PA 2000/PA 1999 = PB 2000/PB 1999
Double Mass Analysis • For checking the consistency of a station against one or more nearby stations • Consider a station E collecting data for 45 years • For some reasons, the catch of the station is affected • There are other stations H and I with same storm patterns though their annual rainfall differ • Check for a consistent correlation between the averages of H and I and that of E in early years • Plot the accumulated annual rainfall at E against the accumulated average annual rainfall at H and I • Correct the existing rainfall catch at E when the relationship changes against the previous relationship
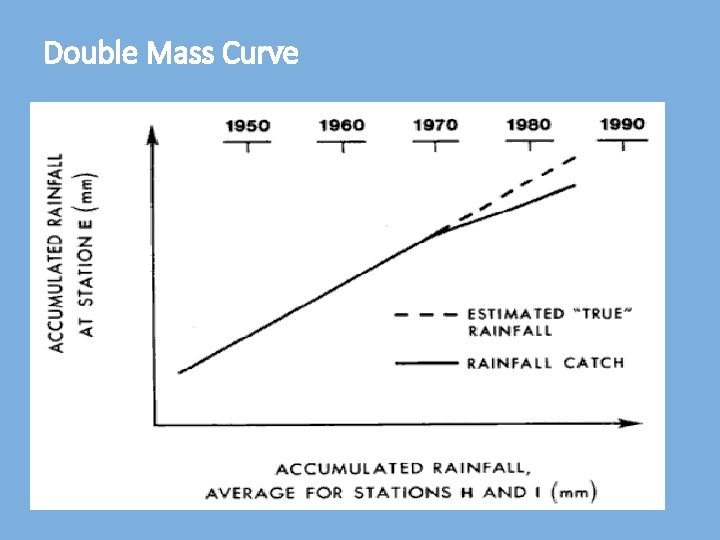
Double Mass Curve
Rain-Gauge Data Spatial Interpolation • When interpolation methods are appropriate? • when an attribute measured at sample points is a spatially continuous field variable • Involves estimating the rainfall values at unmeasured points
Spatial Interpolation Methods • Nearest neighbor (Thiessen Polygon Method ) • Isohyetal • Triangulation • Distance weighting • Krigging
Triangulation • Joining of adjacent data points by a line to form a lattice of triangles (TIN) • Values at any intermediate point on the surface can be computed through trigonometry
Distance weighting • Moving-average procedure using points within a specified zone of influence • Example: Inverse distance weighting • weights are inversely proportional to the square of the distance between the point of interest and each of the data points
Kriging • Also based on a weighted sum of the points within a zone of influence • weights in kriging are determined from a set of n simultaneous linear equations, where n is the number of points used for the estimation • Based on spatial correlation • points closer together tend to be strongly correlated, whereas those far apart lack correlation
PRISM? • Parameter-elevation Regressions on Independent Slopes Model • Expert system that uses point data and a digital elevation model (DEM) to generate gridded estimates of climate parameters • Developed to overcome the deficiencies of standard spatial interpolation methods, where orographic effects strongly influence weather patterns • PRISM has been used to map temperature, snowfall, weather generator statistics, and others • Uses DEM
PRISM (conti. . ) • For each DEM grid cell, PRISM develops a weighted precipitation/elevation (P/E) regression function from nearby stations, and predicts precipitation at the cell’s DEM elevation with this function • In the regression, greater weight is given to stations with locations, elevations, and topographic positionings similar to that of the grid cell • Whenever possible, PRISM calculates a prediction interval for the estimate, which is an approximation of the uncertainty involved.
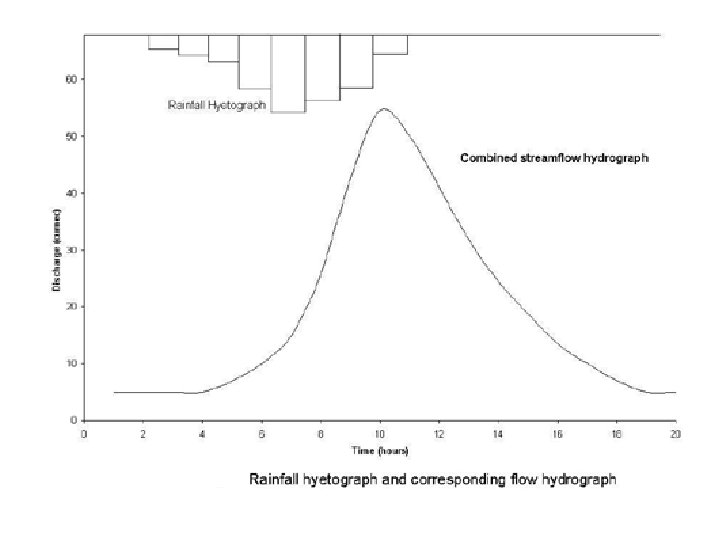
Hyetograph, Mass Curve and Hydrograph • Hyetograph is the graphical plot of the rainfall plotted against time • Mass Curve of rainfall is a plot of accumulated rainfall against time • Hydrograph is a plot of discharge in the channel vs. time (cubic feet per second) • Hydrograph after separating the base flow is called Direct Runoff Hydrograph
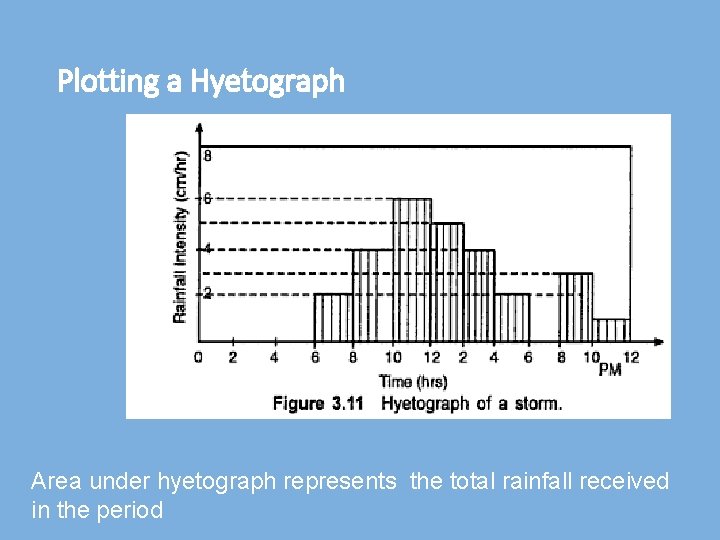
Plotting a Hyetograph Area under hyetograph represents the total rainfall received in the period
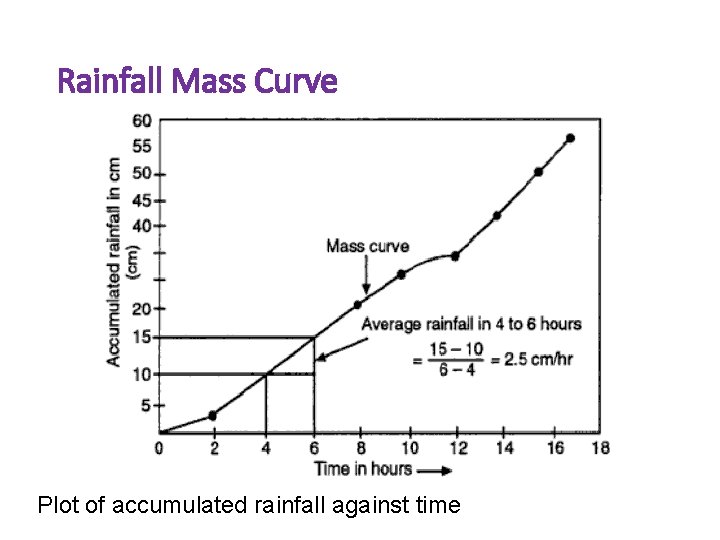
Rainfall Mass Curve Plot of accumulated rainfall against time

END

Solution: Class Exercise
- Slides: 54