
The Atlantic Multidecadal Oscillation A signature of persistent
- Slides: 18
The Atlantic Multidecadal Oscillation: A signature of persistent natural thermohaline circulation cycles in observed climate Jeff Knight, Rob Allan, Chris Folland, Michael Vellinga and Michael Mann* Hadley Centre for Climate Prediction and Research *Dept of Environmental Sciences, University of Virginia, USA 1 Hadley Centre
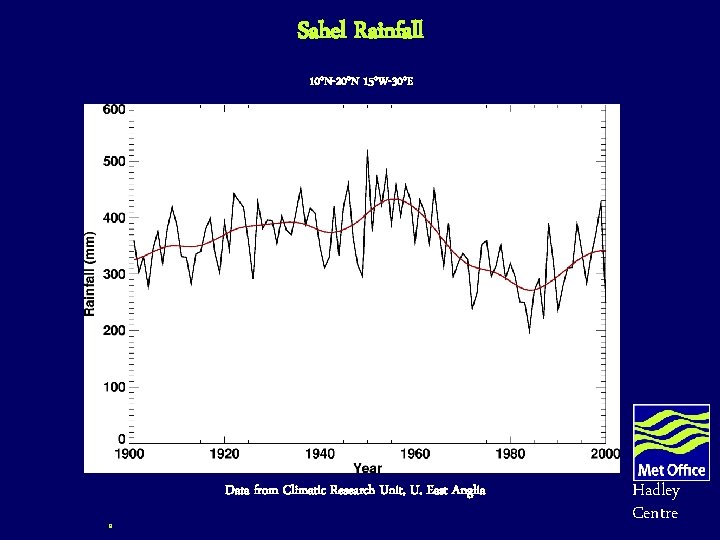
Introduction n Observed multidecadal variations in surface climate n Had. CM 3 Control Simulation: THC variability n Simulated THC links with climate n What do instrumental surface temperature records show with regard to the modelled multidecadal THC-climate mode? n Relationship of global and hemispheric mean temperatures with the modelled THC. n Links to regional climate phenomena, e. g. NE Brazil and Sahel rainfall. n Multidecadal modulation of North Atlantic hurricanes. n Reconstruction the 20 th century THC from historical observations of climate? n Forecast of natural THC evolution over the next few decades. 2 Hadley Centre
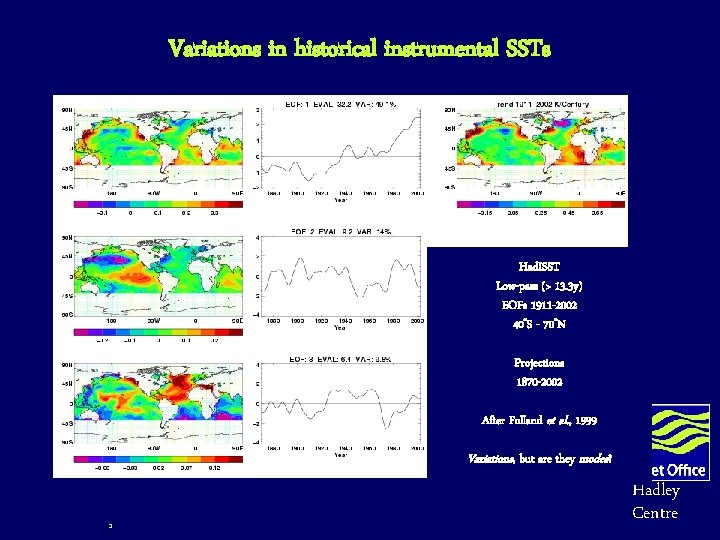
Variations in historical instrumental SSTs Had. ISST Low-pass (> 13. 3 y) EOFs 1911 -2002 40ºS - 70ºN Projections 1870 -2002 After Folland et al. , 1999 Variations, but are they modes? 3 Hadley Centre
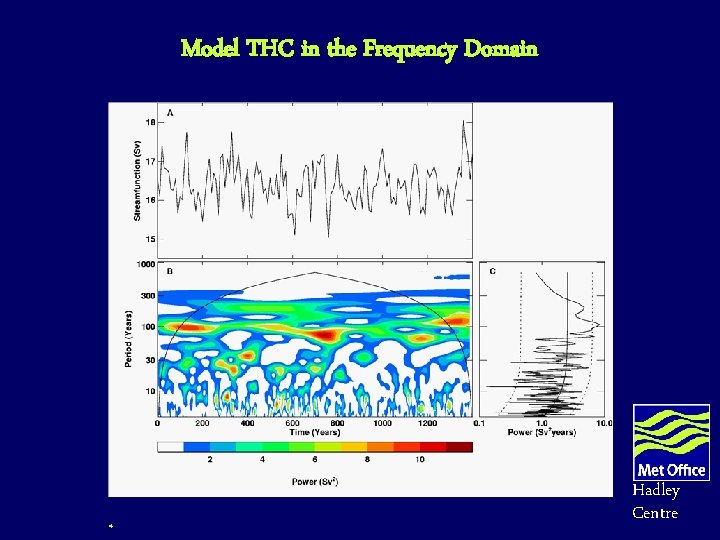
Model THC in the Frequency Domain 4 Hadley Centre
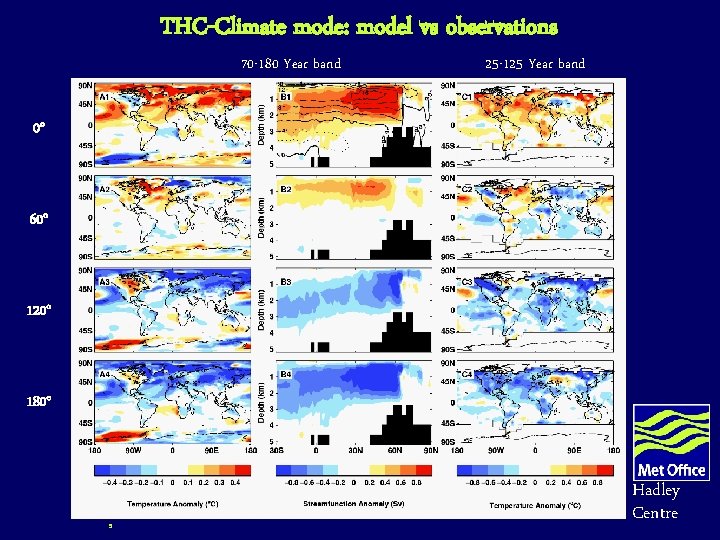
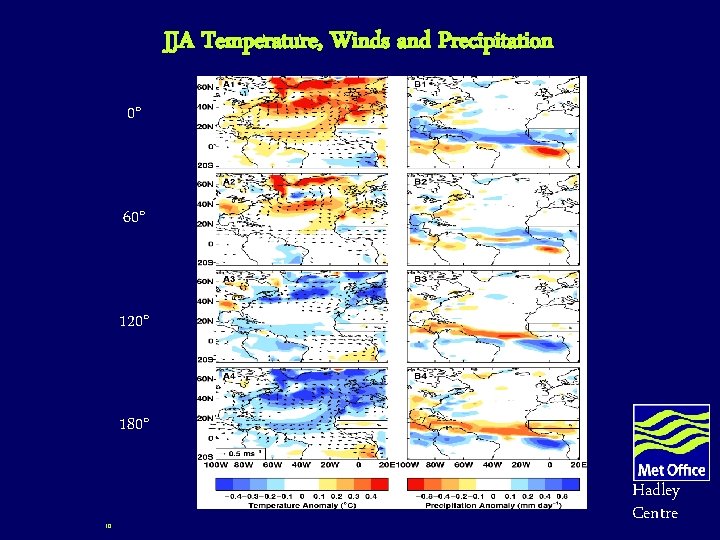
THC-Climate mode: model vs observations 70 -180 Year band 25 -125 Year band 0° 60° 120° 180° 5 Hadley Centre
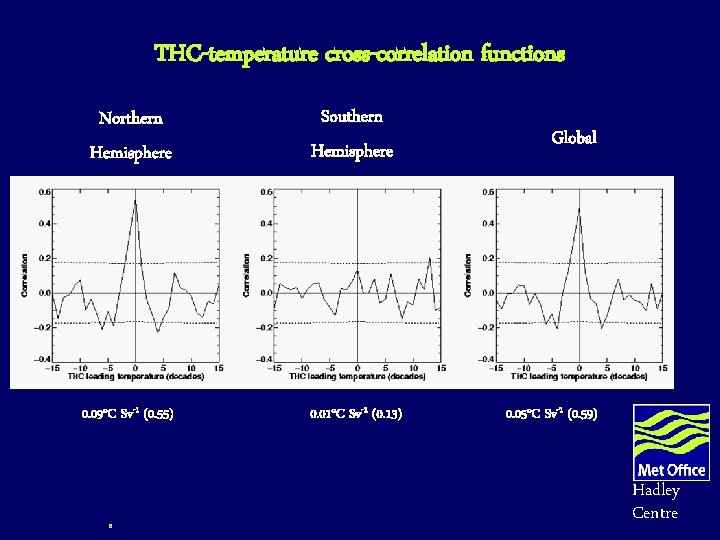
THC-temperature cross-correlation functions Northern Hemisphere Southern Hemisphere 0. 09°C Sv-1 (0. 55) 0. 01°C Sv-1 (0. 13) 6 Global 0. 05°C Sv-1 (0. 59) Hadley Centre
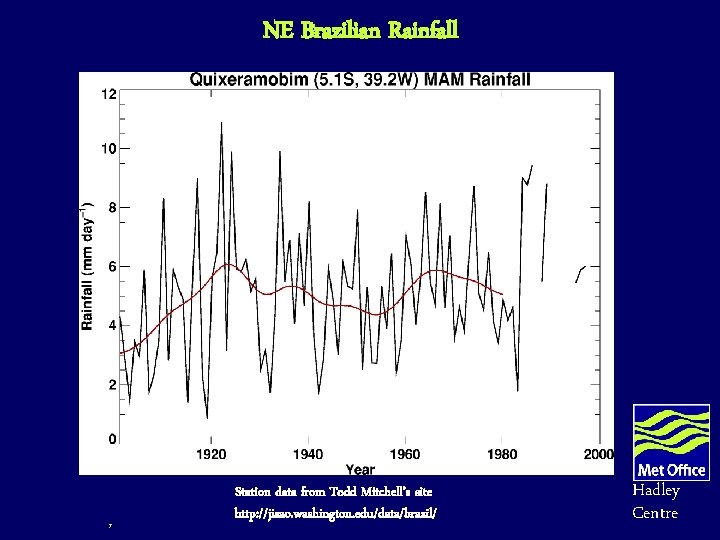
NE Brazilian Rainfall 7 Station data from Todd Mitchell’s site http: //jisao. washington. edu/data/brazil/ Hadley Centre
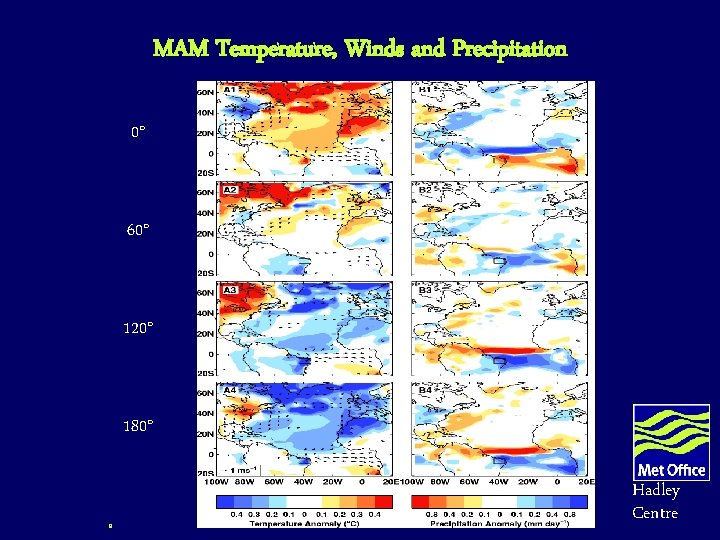
MAM Temperature, Winds and Precipitation 0° 60° 120° 180° 8 Hadley Centre
Sahel Rainfall 10°N-20°N 15°W-30°E Data from Climatic Research Unit, U. East Anglia 9 Hadley Centre
JJA Temperature, Winds and Precipitation 0° 60° 120° 180° 10 Hadley Centre
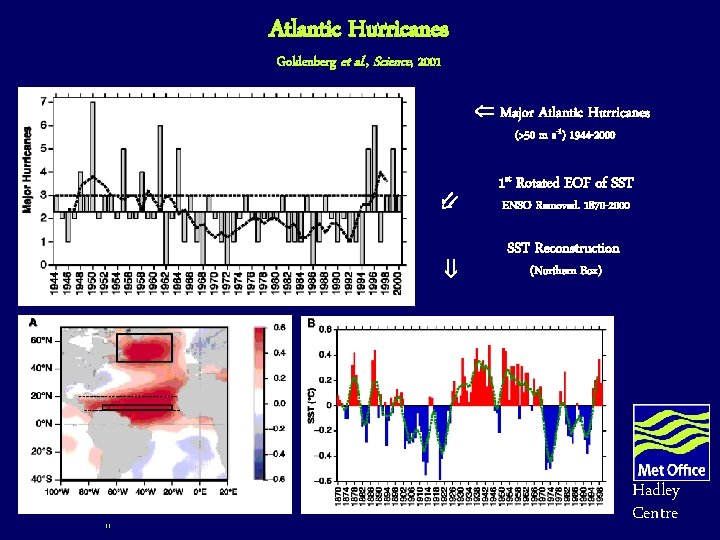
Atlantic Hurricanes Goldenberg et al. , Science, 2001 Major Atlantic Hurricanes (>50 m s-1) 1944 -2000 11 1 st Rotated EOF of SST ENSO Removed. 1870 -2000 SST Reconstruction (Northern Box) Hadley Centre
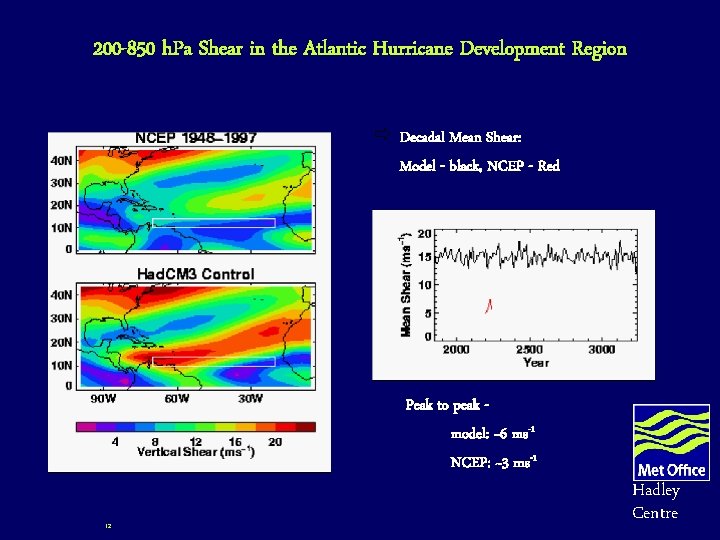
200 -850 h. Pa Shear in the Atlantic Hurricane Development Region ð Decadal Mean Shear: Model - black, NCEP - Red Peak to peak model: ~6 ms-1 NCEP: ~3 ms-1 12 Hadley Centre
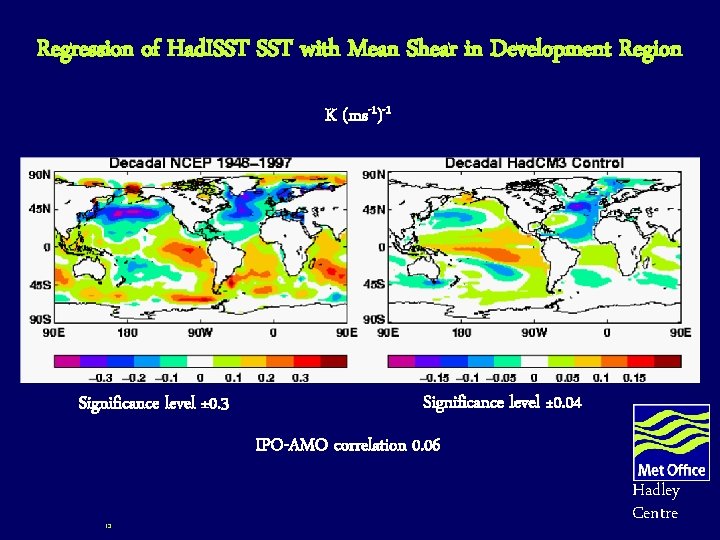
Regression of Had. ISST with Mean Shear in Development Region K (ms-1)-1 Significance level ± 0. 3 Significance level ± 0. 04 IPO-AMO correlation 0. 06 13 Hadley Centre
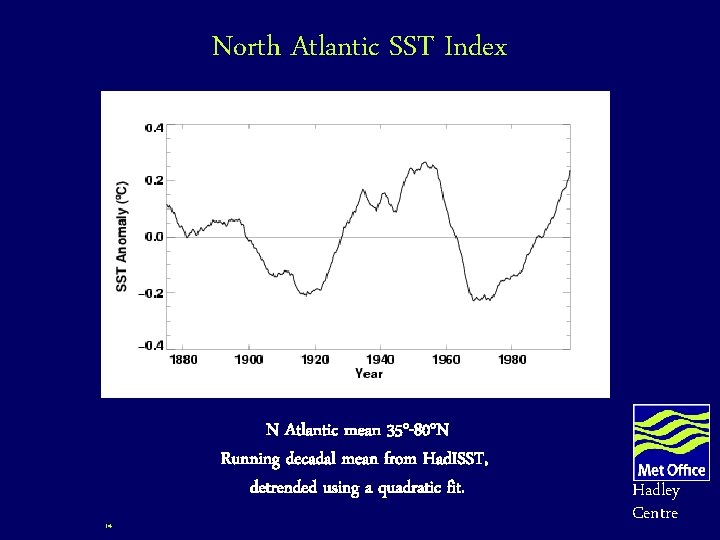
North Atlantic SST Index N Atlantic mean 35°-80°N Running decadal mean from Had. ISST, detrended using a quadratic fit. 14 Hadley Centre
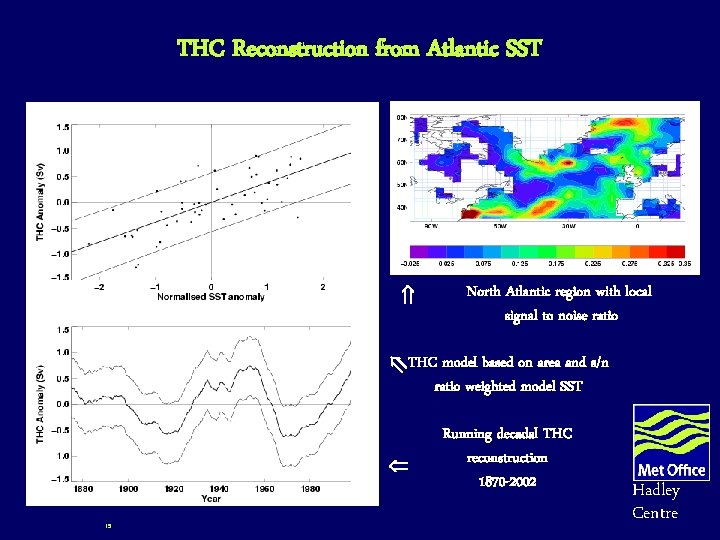
THC Reconstruction from Atlantic SST North Atlantic region with local signal to noise ratio THC model based on area and s/n ratio weighted model SST 15 Running decadal THC reconstruction 1870 -2002 Hadley Centre
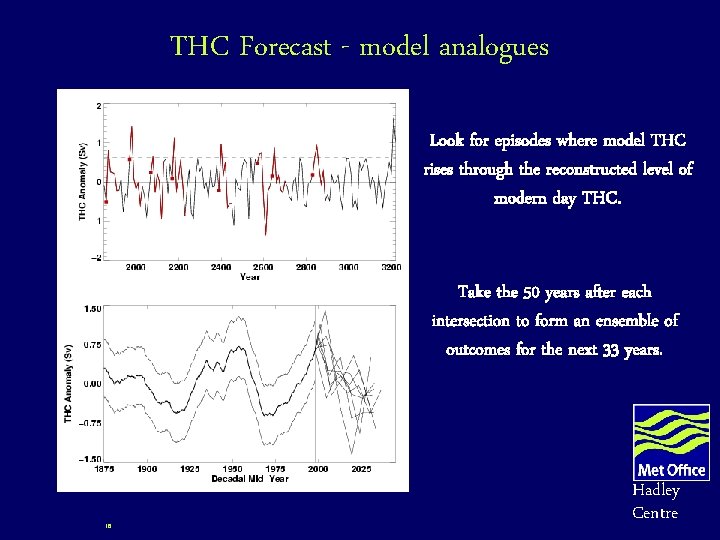
THC Forecast - model analogues Look for episodes where model THC rises through the reconstructed level of modern day THC. Take the 50 years after each intersection to form an ensemble of outcomes for the next 33 years. 16 Hadley Centre
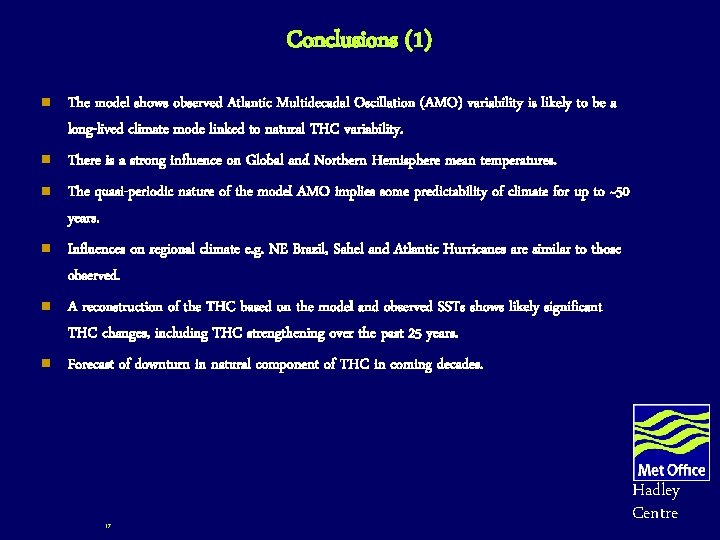
Conclusions (1) n The model shows observed Atlantic Multidecadal Oscillation (AMO) variability is likely to be a long-lived climate mode linked to natural THC variability. n There is a strong influence on Global and Northern Hemisphere mean temperatures. n The quasi-periodic nature of the model AMO implies some predictability of climate for up to ~50 years. n Influences on regional climate e. g. NE Brazil, Sahel and Atlantic Hurricanes are similar to those observed. n A reconstruction of the THC based on the model and observed SSTs shows likely significant THC changes, including THC strengthening over the past 25 years. n Forecast of downturn in natural component of THC in coming decades. 17 Hadley Centre
Conclusions (2) n Shows how coupled models can be used to study 20 th century climate phenomena – long simulations can be a surrogate for the ‘observations we would like to have’. n Highlights need for a range of C 20 C sensitivity experiments with imposed AMO anomalies eg. AMO- (like 1970 s), AMO+ (like 1940 s) to simulate climate anomalies across the range of seasons. 18 Hadley Centre