SEEGRIDSCI Monitoring Tools www seegridsci eu Regional SEEGRIDSCI

![Gmetad – Configuration Data source and failover designations § data_source "my cluster" [polling interval] Gmetad – Configuration Data source and failover designations § data_source "my cluster" [polling interval]](https://slidetodoc.com/presentation_image_h2/c148a1c3d76f732c42eb40d6a895f147/image-22.jpg)



- Slides: 70

SEE-GRID-SCI Monitoring Tools www. see-grid-sci. eu Regional SEE-GRID-SCI Training for Site Administrators Institute of Physics Belgrade March 5 -6, 2009 Antun Balaz Institute of Physics Belgrade, Serbia antun@scl. rs The SEE-GRID-SCI initiative is co-funded by the European Commission under the FP 7 Research Infrastructures contract no. 211338

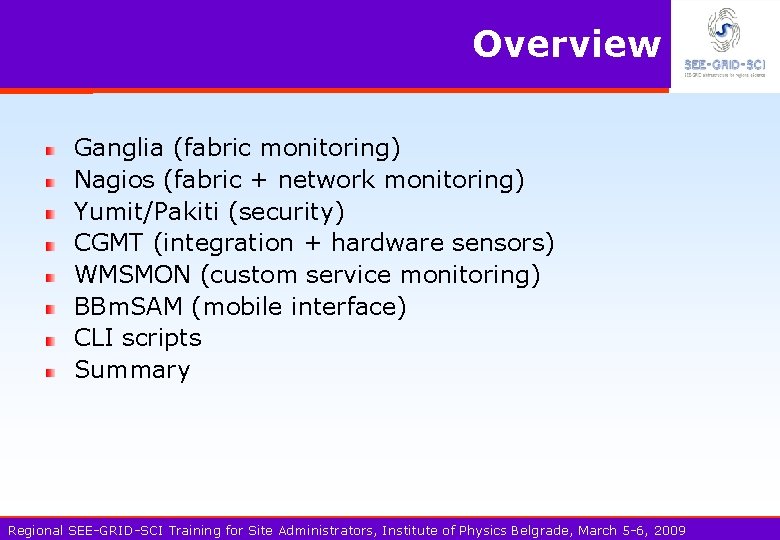
Overview Ganglia (fabric monitoring) Nagios (fabric + network monitoring) Yumit/Pakiti (security) CGMT (integration + hardware sensors) WMSMON (custom service monitoring) BBm. SAM (mobile interface) CLI scripts Summary Regional SEE-GRID-SCI Training for Site Administrators, Institute of Physics Belgrade, March 5 -6, 2009

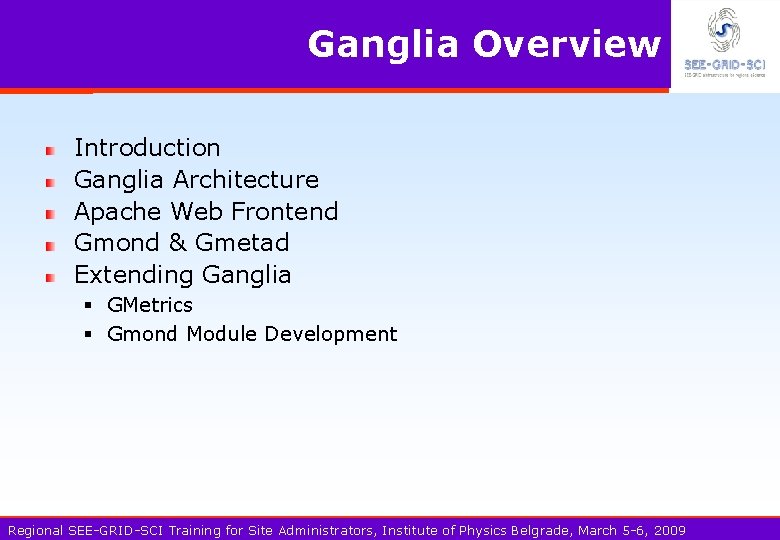
Ganglia Overview Introduction Ganglia Architecture Apache Web Frontend Gmond & Gmetad Extending Ganglia § GMetrics § Gmond Module Development Regional SEE-GRID-SCI Training for Site Administrators, Institute of Physics Belgrade, March 5 -6, 2009

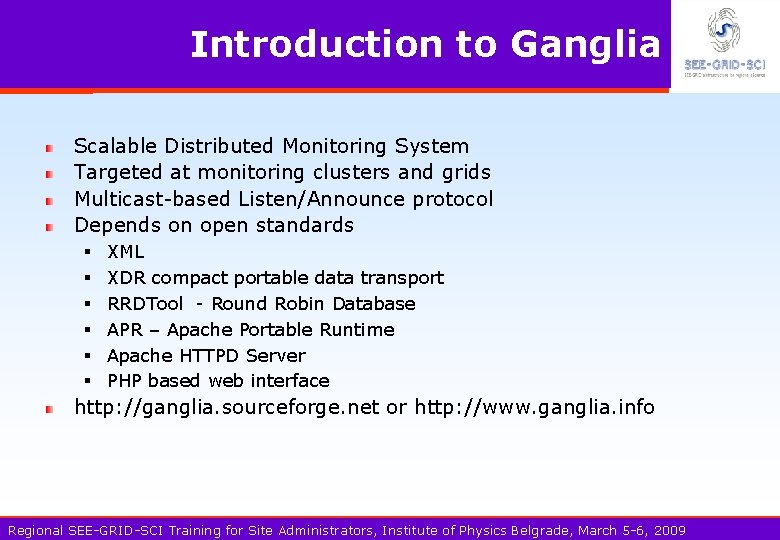
Introduction to Ganglia Scalable Distributed Monitoring System Targeted at monitoring clusters and grids Multicast-based Listen/Announce protocol Depends on open standards § § § XML XDR compact portable data transport RRDTool - Round Robin Database APR – Apache Portable Runtime Apache HTTPD Server PHP based web interface http: //ganglia. sourceforge. net or http: //www. ganglia. info Regional SEE-GRID-SCI Training for Site Administrators, Institute of Physics Belgrade, March 5 -6, 2009

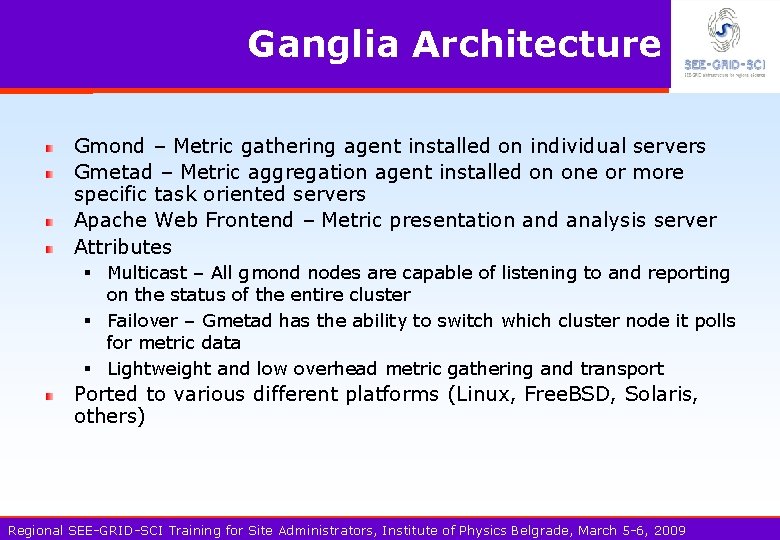
Ganglia Architecture Gmond – Metric gathering agent installed on individual servers Gmetad – Metric aggregation agent installed on one or more specific task oriented servers Apache Web Frontend – Metric presentation and analysis server Attributes § Multicast – All gmond nodes are capable of listening to and reporting on the status of the entire cluster § Failover – Gmetad has the ability to switch which cluster node it polls for metric data § Lightweight and low overhead metric gathering and transport Ported to various different platforms (Linux, Free. BSD, Solaris, others) Regional SEE-GRID-SCI Training for Site Administrators, Institute of Physics Belgrade, March 5 -6, 2009

Ganglia Architecture Regional SEE-GRID-SCI Training for Site Administrators, Institute of Physics Belgrade, March 5 -6, 2009

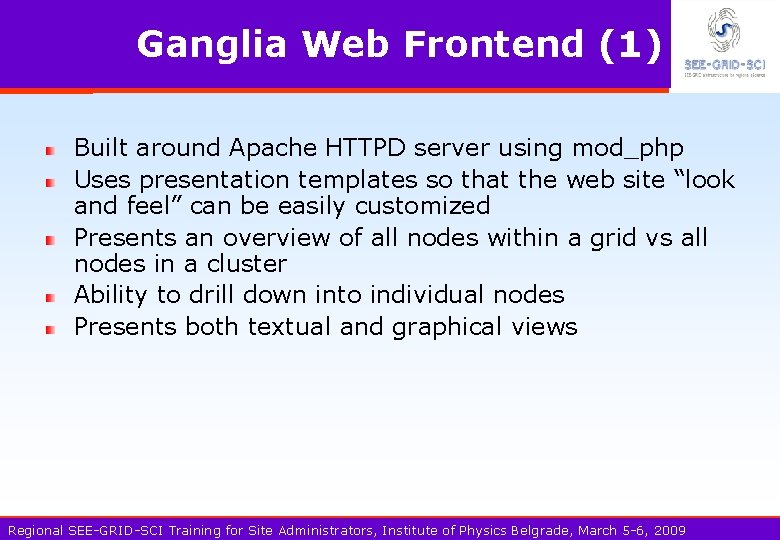
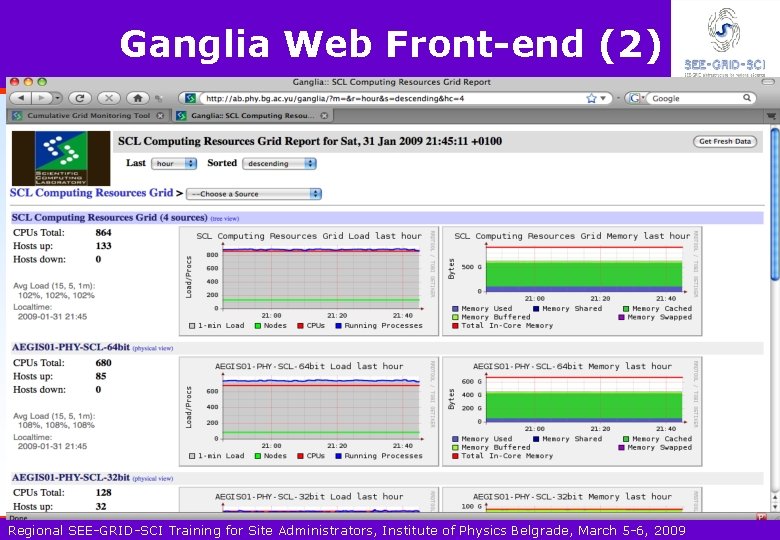
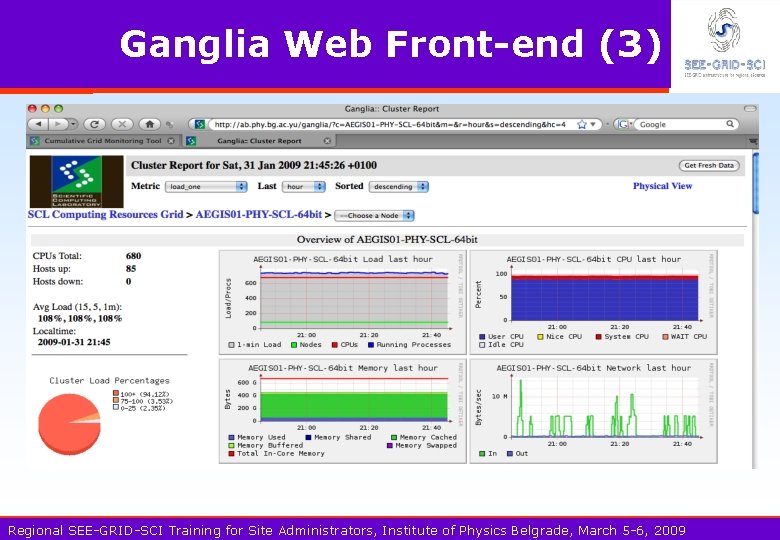
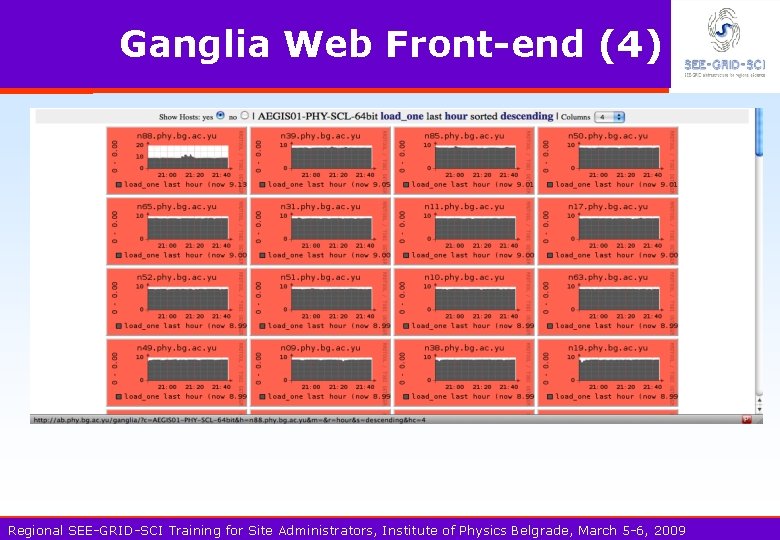
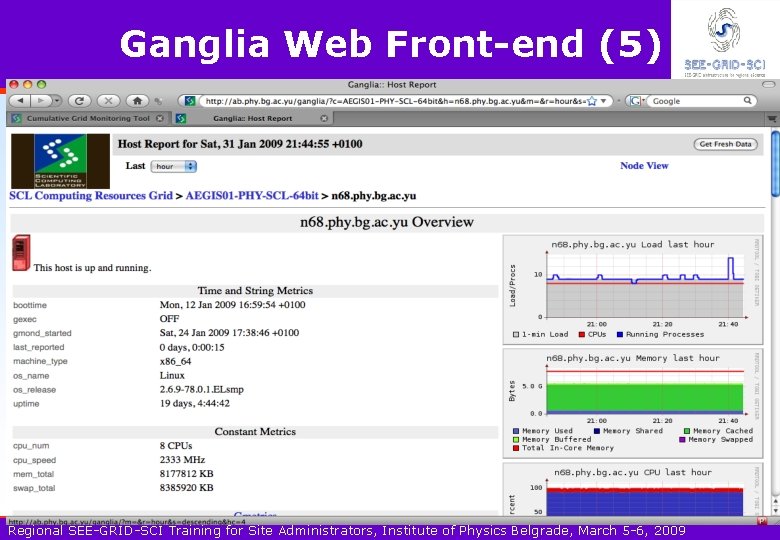
Ganglia Web Frontend (1) Built around Apache HTTPD server using mod_php Uses presentation templates so that the web site “look and feel” can be easily customized Presents an overview of all nodes within a grid vs all nodes in a cluster Ability to drill down into individual nodes Presents both textual and graphical views Regional SEE-GRID-SCI Training for Site Administrators, Institute of Physics Belgrade, March 5 -6, 2009

Ganglia Web Front-end (2) Regional SEE-GRID-SCI Training for Site Administrators, Institute of Physics Belgrade, March 5 -6, 2009

Ganglia Web Front-end (3) Regional SEE-GRID-SCI Training for Site Administrators, Institute of Physics Belgrade, March 5 -6, 2009

Ganglia Web Front-end (4) Regional SEE-GRID-SCI Training for Site Administrators, Institute of Physics Belgrade, March 5 -6, 2009

Ganglia Web Front-end (5) Regional SEE-GRID-SCI Training for Site Administrators, Institute of Physics Belgrade, March 5 -6, 2009

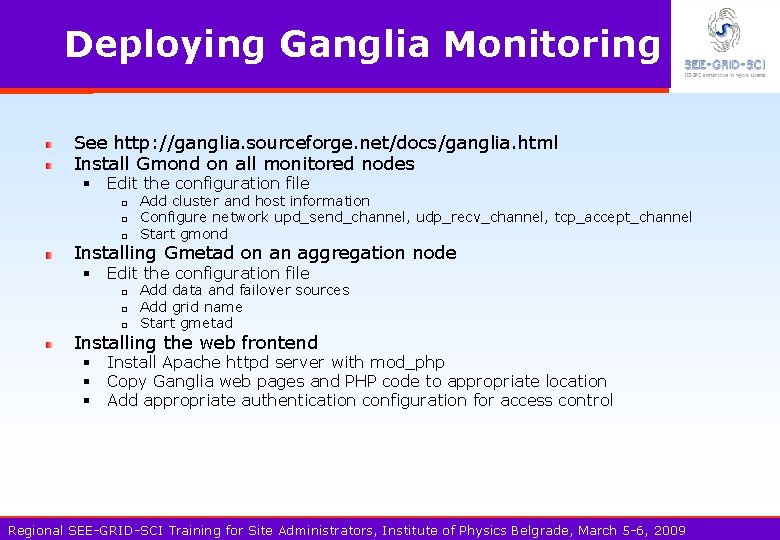
Deploying Ganglia Monitoring See http: //ganglia. sourceforge. net/docs/ganglia. html Install Gmond on all monitored nodes § Edit the configuration file q q q Add cluster and host information Configure network upd_send_channel, udp_recv_channel, tcp_accept_channel Start gmond Installing Gmetad on an aggregation node § Edit the configuration file q q q Add data and failover sources Add grid name Start gmetad Installing the web frontend § Install Apache httpd server with mod_php § Copy Ganglia web pages and PHP code to appropriate location § Add appropriate authentication configuration for access control Regional SEE-GRID-SCI Training for Site Administrators, Institute of Physics Belgrade, March 5 -6, 2009

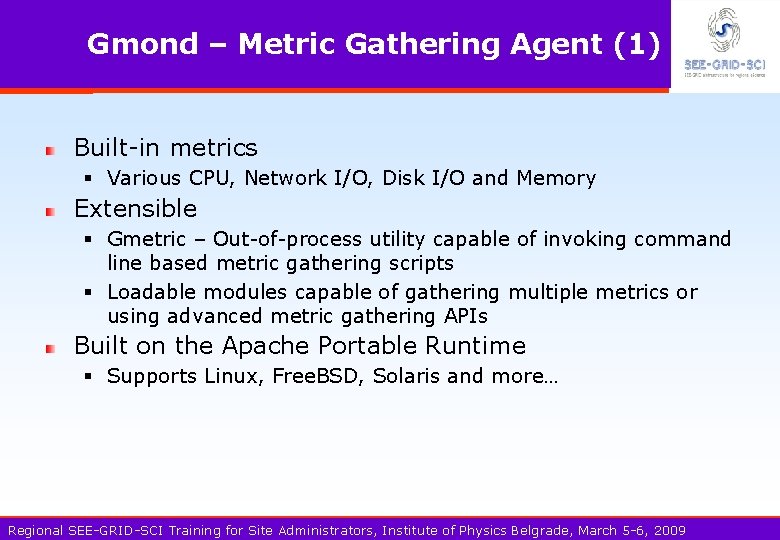
Gmond – Metric Gathering Agent (1) Built-in metrics § Various CPU, Network I/O, Disk I/O and Memory Extensible § Gmetric – Out-of-process utility capable of invoking command line based metric gathering scripts § Loadable modules capable of gathering multiple metrics or using advanced metric gathering APIs Built on the Apache Portable Runtime § Supports Linux, Free. BSD, Solaris and more… Regional SEE-GRID-SCI Training for Site Administrators, Institute of Physics Belgrade, March 5 -6, 2009

Gmond – Metric Gathering Agent (2) Automatic discovery of nodes § Adding a node does not require configuration file changes § Each node is configured independently § Each node has the ability to listen to and/or talk on the multicast channel § Can be configured for unicast connections if desired § Heartbeat metric determines the up/down status Thread pools § Collection threads – Capable of running specialized functions for gathering metric data § Multicast listeners – Listen for metric data from other nodes in the same cluster § Data export listeners – Listen for client requests for cluster metric data Regional SEE-GRID-SCI Training for Site Administrators, Institute of Physics Belgrade, March 5 -6, 2009

Gmond – Global Configuration daemonize - When “yes”, gmond will daemonize setuid - When “yes”, gmond will set its effective UID to the uid of the user specified by the user attribute debug_level - When set to zero (0), gmond will run normally. Greater than zero, gmond runs in the foreground and outputs debugging information mute - When “yes”, gmond will not send data deaf - When “yes”, gmond will not receive data host_dmax - When set to zero (0), gmond will not delete a host from its list. If set to a positive number, gmond will flush a host after it has not heard from it for N seconds cleanup_threshold - Minimum about of time before gmond will cleanup expired data gexec - Specify whether gmond will announce the hosts availability to run gexec jobs Regional SEE-GRID-SCI Training for Site Administrators, Institute of Physics Belgrade, March 5 -6, 2009

Gmond – Cluster Configuration name - Specifies the name of the cluster of machines owner - Specifies the administrators of the cluster latlong - Latitude and longitude GPS coordinates of this cluster on earth url - Additional information about the cluster Regional SEE-GRID-SCI Training for Site Administrators, Institute of Physics Belgrade, March 5 -6, 2009

Gmond – Network Configuration Udp_send_channel § mcast_join, mcast_if – Multicast address and interface § host – Unicast host § port – Multicast or Unicast port Udp_recv_channel § mcast_join, mcast_if, port – Multicast address, interface and port § Bind – Bind a particular local address § family – Protocol family Tcp_accept_channel § Bind, port, interface – Bind a particular local address, listen port and interface § Family – Protocol family § timeout – Request timeout Regional SEE-GRID-SCI Training for Site Administrators, Institute of Physics Belgrade, March 5 -6, 2009

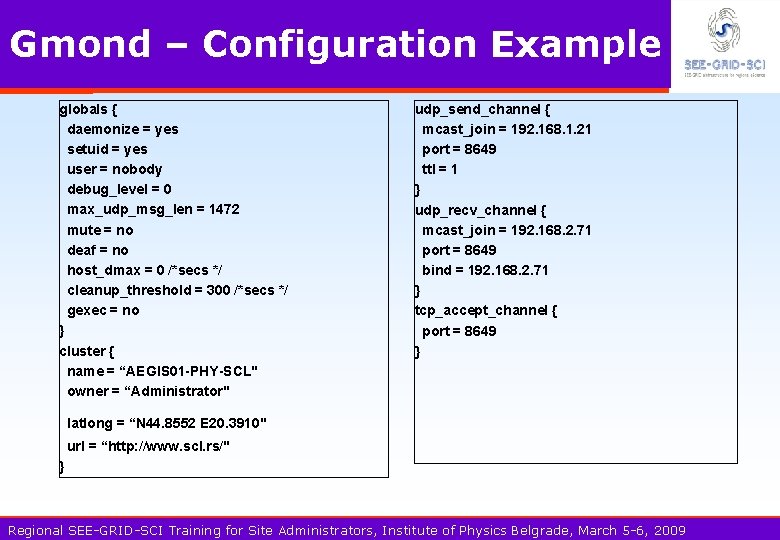
Gmond – Configuration Example globals { daemonize = yes setuid = yes user = nobody debug_level = 0 max_udp_msg_len = 1472 mute = no deaf = no host_dmax = 0 /*secs */ cleanup_threshold = 300 /*secs */ gexec = no } cluster { name = “AEGIS 01 -PHY-SCL" owner = “Administrator" udp_send_channel { mcast_join = 192. 168. 1. 21 port = 8649 ttl = 1 } udp_recv_channel { mcast_join = 192. 168. 2. 71 port = 8649 bind = 192. 168. 2. 71 } tcp_accept_channel { port = 8649 } latlong = “N 44. 8552 E 20. 3910" url = “http: //www. scl. rs/" } Regional SEE-GRID-SCI Training for Site Administrators, Institute of Physics Belgrade, March 5 -6, 2009

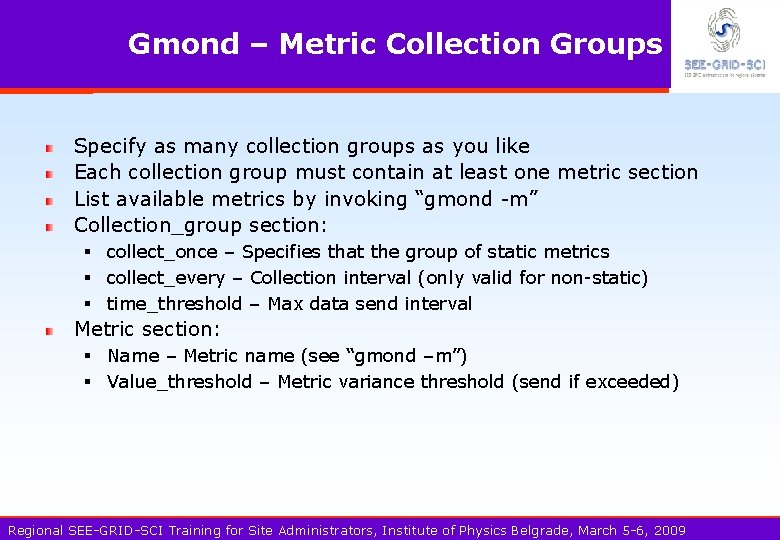
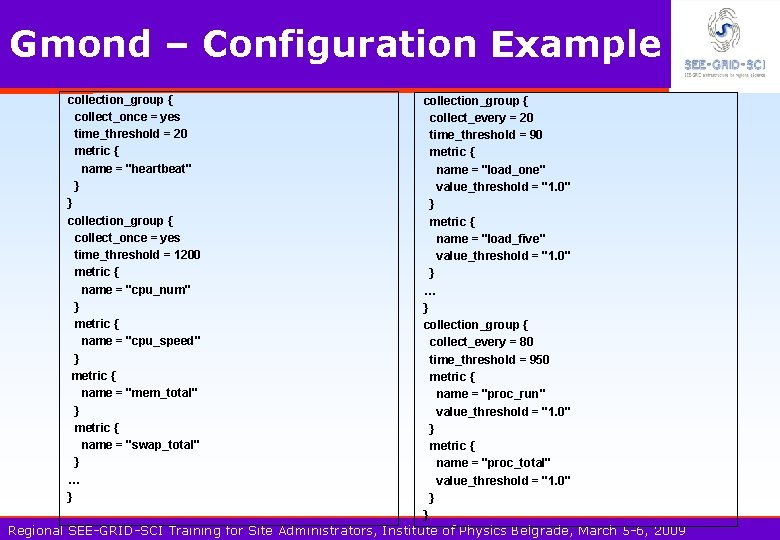
Gmond – Metric Collection Groups Specify as many collection groups as you like Each collection group must contain at least one metric section List available metrics by invoking “gmond -m” Collection_group section: § collect_once – Specifies that the group of static metrics § collect_every – Collection interval (only valid for non-static) § time_threshold – Max data send interval Metric section: § Name – Metric name (see “gmond –m”) § Value_threshold – Metric variance threshold (send if exceeded) Regional SEE-GRID-SCI Training for Site Administrators, Institute of Physics Belgrade, March 5 -6, 2009

Gmond – Configuration Example collection_group { collect_once = yes time_threshold = 20 metric { name = "heartbeat" } } collection_group { collect_once = yes time_threshold = 1200 metric { name = "cpu_num" } metric { name = "cpu_speed" } metric { name = "mem_total" } metric { name = "swap_total" } … } collection_group { collect_every = 20 time_threshold = 90 metric { name = "load_one" value_threshold = "1. 0" } metric { name = "load_five" value_threshold = "1. 0" } … } collection_group { collect_every = 80 time_threshold = 950 metric { name = "proc_run" value_threshold = "1. 0" } metric { name = "proc_total" value_threshold = "1. 0" } } Regional SEE-GRID-SCI Training for Site Administrators, Institute of Physics Belgrade, March 5 -6, 2009

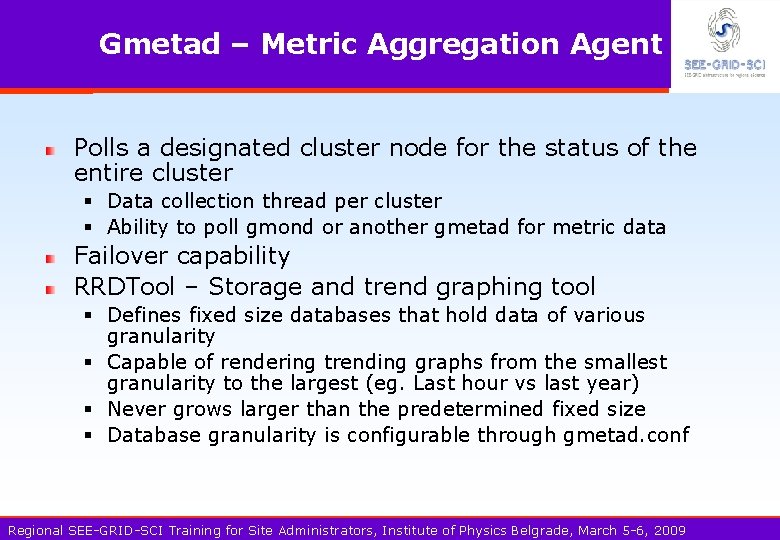
Gmetad – Metric Aggregation Agent Polls a designated cluster node for the status of the entire cluster § Data collection thread per cluster § Ability to poll gmond or another gmetad for metric data Failover capability RRDTool – Storage and trend graphing tool § Defines fixed size databases that hold data of various granularity § Capable of rendering trending graphs from the smallest granularity to the largest (eg. Last hour vs last year) § Never grows larger than the predetermined fixed size § Database granularity is configurable through gmetad. conf Regional SEE-GRID-SCI Training for Site Administrators, Institute of Physics Belgrade, March 5 -6, 2009
![Gmetad Configuration Data source and failover designations datasource my cluster polling interval Gmetad – Configuration Data source and failover designations § data_source "my cluster" [polling interval]](https://slidetodoc.com/presentation_image_h2/c148a1c3d76f732c42eb40d6a895f147/image-22.jpg)
Gmetad – Configuration Data source and failover designations § data_source "my cluster" [polling interval] address 1: port addreses 2: port. . . RRD database storage definition § RRAs "RRA: AVERAGE: 0. 5: 1: 244" "RRA: AVERAGE: 0. 5: 168: 244" "RRA: AVERAGE: 0. 5: 672: 244" "RRA: AVERAGE: 0. 5: 5760: 374" Access control § trusted_hosts address 1 address 2 … DN 1 DN 2 … § all_trusted OFF/on RRD files location § rrd_rootdir "/var/lib/ganglia/rrds" Network § xml_port 8651 interactive_port 8652 Regional SEE-GRID-SCI Training for Site Administrators, Institute of Physics Belgrade, March 5 -6, 2009

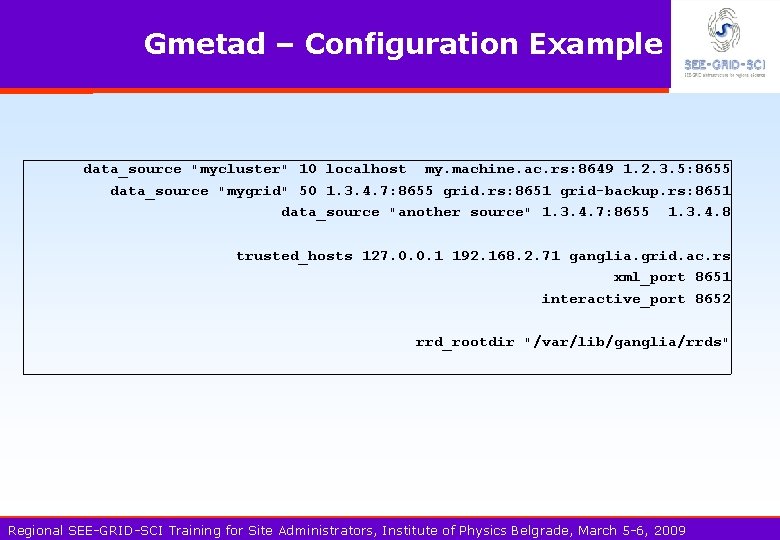
Gmetad – Configuration Example data_source "mycluster" 10 localhost my. machine. ac. rs: 8649 1. 2. 3. 5: 8655 data_source "mygrid" 50 1. 3. 4. 7: 8655 grid. rs: 8651 grid-backup. rs: 8651 data_source "another source" 1. 3. 4. 7: 8655 1. 3. 4. 8 trusted_hosts 127. 0. 0. 1 192. 168. 2. 71 ganglia. grid. ac. rs xml_port 8651 interactive_port 8652 rrd_rootdir "/var/lib/ganglia/rrds" Regional SEE-GRID-SCI Training for Site Administrators, Institute of Physics Belgrade, March 5 -6, 2009

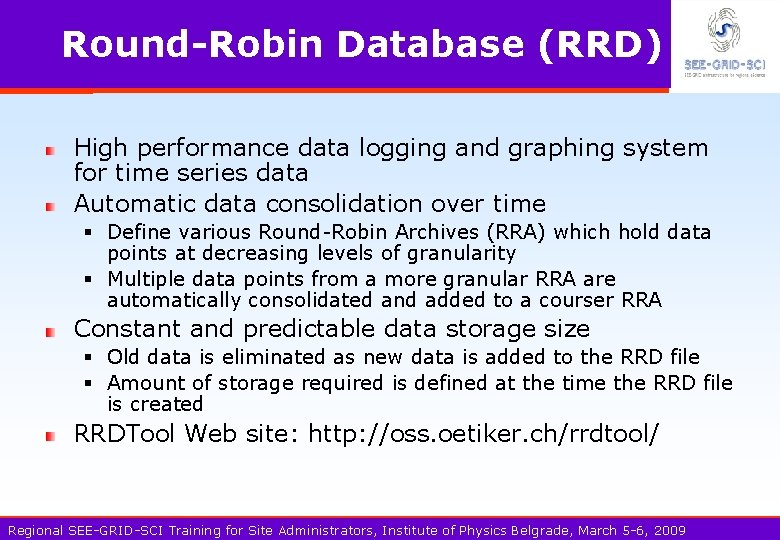
Round-Robin Database (RRD) High performance data logging and graphing system for time series data Automatic data consolidation over time § Define various Round-Robin Archives (RRA) which hold data points at decreasing levels of granularity § Multiple data points from a more granular RRA are automatically consolidated and added to a courser RRA Constant and predictable data storage size § Old data is eliminated as new data is added to the RRD file § Amount of storage required is defined at the time the RRD file is created RRDTool Web site: http: //oss. oetiker. ch/rrdtool/ Regional SEE-GRID-SCI Training for Site Administrators, Institute of Physics Belgrade, March 5 -6, 2009

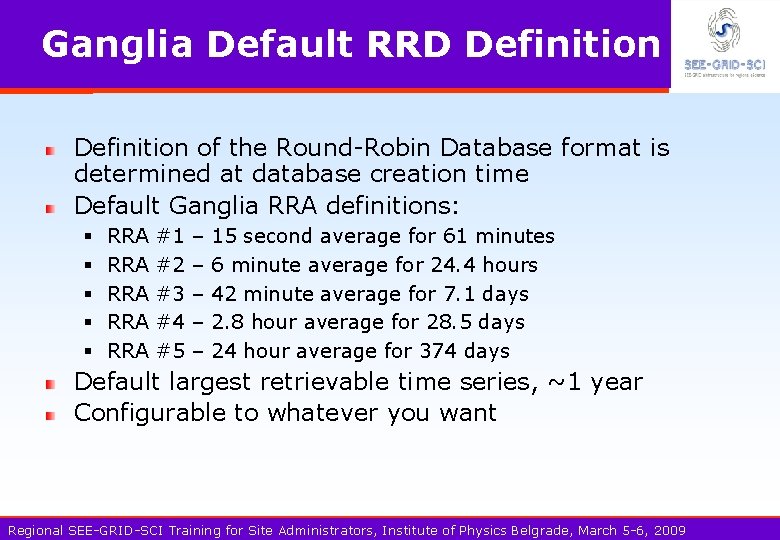
Ganglia Default RRD Definition of the Round-Robin Database format is determined at database creation time Default Ganglia RRA definitions: § § § RRA RRA RRA #1 #2 #3 #4 #5 – – – 15 second average for 61 minutes 6 minute average for 24. 4 hours 42 minute average for 7. 1 days 2. 8 hour average for 28. 5 days 24 hour average for 374 days Default largest retrievable time series, ~1 year Configurable to whatever you want Regional SEE-GRID-SCI Training for Site Administrators, Institute of Physics Belgrade, March 5 -6, 2009

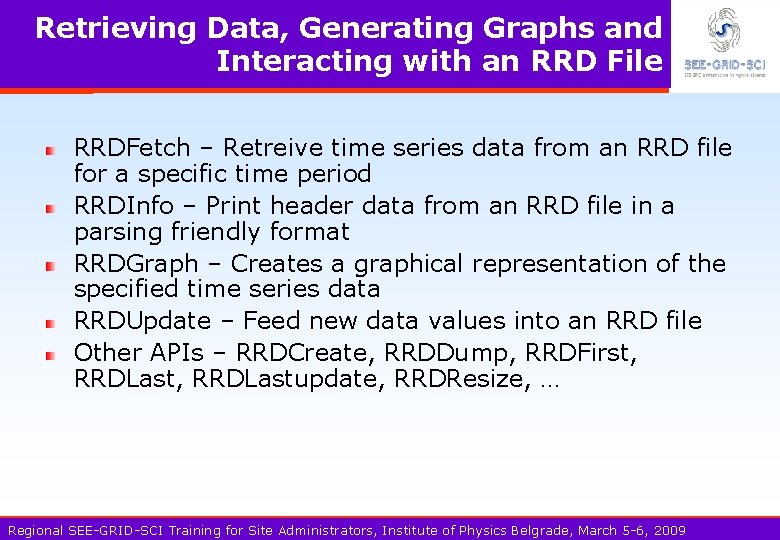
Retrieving Data, Generating Graphs and Interacting with an RRD File RRDFetch – Retreive time series data from an RRD file for a specific time period RRDInfo – Print header data from an RRD file in a parsing friendly format RRDGraph – Creates a graphical representation of the specified time series data RRDUpdate – Feed new data values into an RRD file Other APIs – RRDCreate, RRDDump, RRDFirst, RRDLastupdate, RRDResize, … Regional SEE-GRID-SCI Training for Site Administrators, Institute of Physics Belgrade, March 5 -6, 2009

Gmetric Service Level Metrics Utility Extends the available metrics that can be produced through Gmond Ability to run specialized metric gathering scripts Pushes metric data back through Gmond Must be scheduled through cron rather than Gmond Gmetric repository on Ganglia project site § http: //ganglia. sourceforge. net/gmetric/ Regional SEE-GRID-SCI Training for Site Administrators, Institute of Physics Belgrade, March 5 -6, 2009

Gmond Pluggable Metric Modules Extends the available metrics that can be gathered by Gmond Provided as dynamically loadable modules Configured through the gmond. conf Scheduled through Gmond rather than an external scheduler Module development is similar to an Apache module Able to produce multiple metrics from a single module Regional SEE-GRID-SCI Training for Site Administrators, Institute of Physics Belgrade, March 5 -6, 2009

Gmond Python Module Development Extends the available metrics that can be gathered by Gmond Configured through the Gmond configuration file Python module interface is similar to the C module interface Ability to save state within the script vs. a persistent data store Larger footprint but easier to implement new metrics Regional SEE-GRID-SCI Training for Site Administrators, Institute of Physics Belgrade, March 5 -6, 2009

Nagios Overview Introduction Building blocks § § § Hosts, Commands, Services, Timeperiods and Contacts Remote Checks with NRPE Hostgroups and Servicegroups Templates Config File(s) Active vs. Passive checks Customizations § § § Writing you own Checks NSCA Service Hierarchies Eventhandlers Modifying the Web Pages Regional SEE-GRID-SCI Training for Site Administrators, Institute of Physics Belgrade, March 5 -6, 2009

Introduction to Nagios “Nagios is an enterprise-class monitoring solutions for hosts, services, and networks released under an Open Source license. ” http: //www. nagios. org/ “Nagios is a popular open source computer system and network monitoring application software. It watches hosts and services that you specify, alerting you when things go bad and again when they get better. ” http: //www. wikipedia. org/ Regional SEE-GRID-SCI Training for Site Administrators, Institute of Physics Belgrade, March 5 -6, 2009

Nagios Framework Open source monitoring framework § widely used & actively developed Host and service problems detection and recovery Provides wide set of basic sensors § easy to develop custom sensors Centralized vs. distributed deployment High configurability § service dependencies, fine-grained notification options Web interface § status view, administration Regional SEE-GRID-SCI Training for Site Administrators, Institute of Physics Belgrade, March 5 -6, 2009

Installation Nagios RPMs for RHEL (and so SL/SLC) available from the DAG repository 4 Main component RPMS § nagios – the main server software and web scripts § nagios-plugins – the common set of check scripts used to query services § nagios-nrpe – Nagios Remote Plugin Executor § nagios-nsca – Nagios Service Check Acceptor Setup is simply a matter of installing RPMs, configuring your web server and editing the config files to suit your setup Regional SEE-GRID-SCI Training for Site Administrators, Institute of Physics Belgrade, March 5 -6, 2009

Architecture Simplest setup has central server running Nagios daemon that runs local check scripts to monitor the status of services on local and remote hosts A host is a computer running on the network which runs one or more services to be checked A service is anything on the host that you want checked. Its state can be one of: OK, Warning, Critical or Unknown A check is a script run on the server whose exit status determines the state of the service: 0, 1, 2 or -1 Regional SEE-GRID-SCI Training for Site Administrators, Institute of Physics Belgrade, March 5 -6, 2009

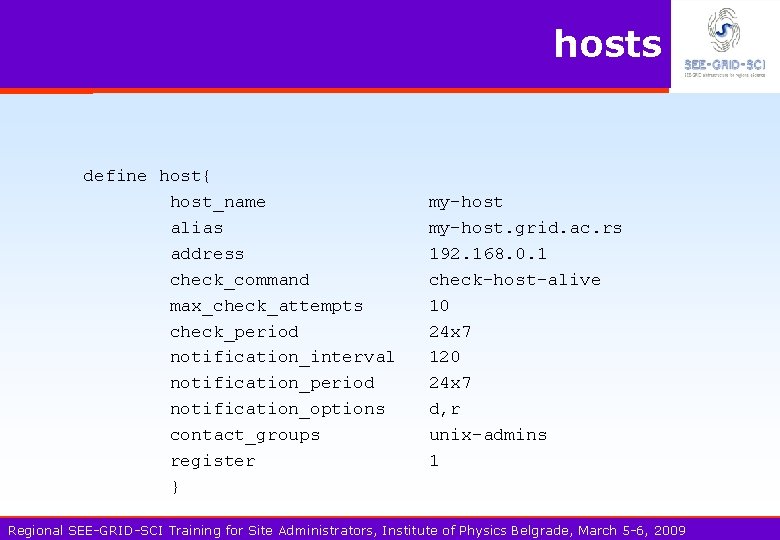
hosts define host{ host_name alias address check_command max_check_attempts check_period notification_interval notification_period notification_options contact_groups register } my-host. grid. ac. rs 192. 168. 0. 1 check-host-alive 10 24 x 7 120 24 x 7 d, r unix-admins 1 Regional SEE-GRID-SCI Training for Site Administrators, Institute of Physics Belgrade, March 5 -6, 2009

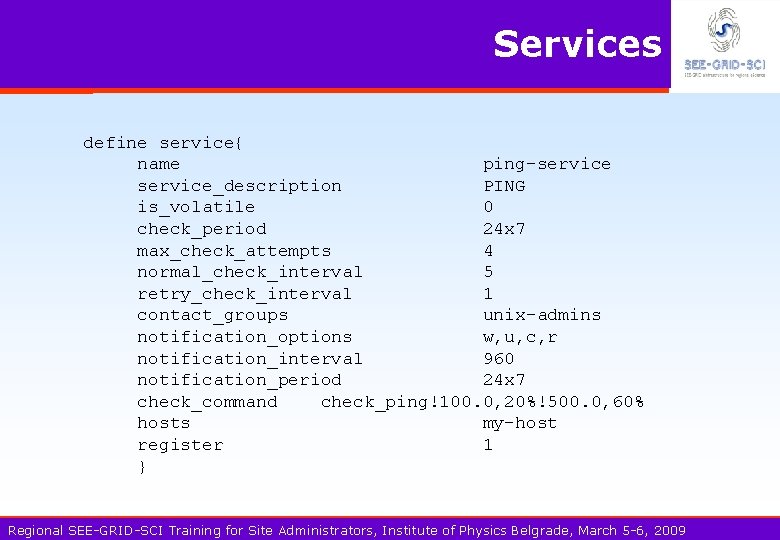
Services define service{ name ping-service_description PING is_volatile 0 check_period 24 x 7 max_check_attempts 4 normal_check_interval 5 retry_check_interval 1 contact_groups unix-admins notification_options w, u, c, r notification_interval 960 notification_period 24 x 7 check_command check_ping!100. 0, 20%!500. 0, 60% hosts my-host register 1 } Regional SEE-GRID-SCI Training for Site Administrators, Institute of Physics Belgrade, March 5 -6, 2009

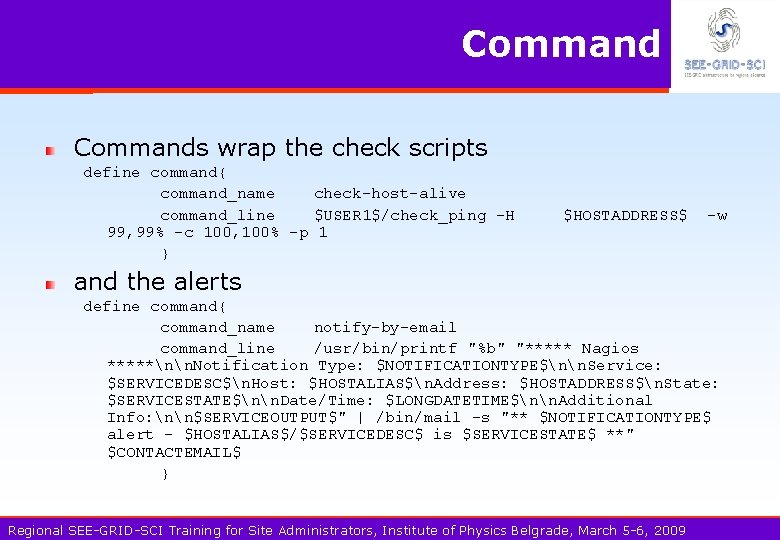
Commands wrap the check scripts define command{ command_name check-host-alive command_line $USER 1$/check_ping -H 99, 99% -c 100, 100% -p 1 } $HOSTADDRESS$ -w and the alerts define command{ command_name notify-by-email command_line /usr/bin/printf "%b" "***** Nagios *****nn. Notification Type: $NOTIFICATIONTYPE$nn. Service: $SERVICEDESC$n. Host: $HOSTALIAS$n. Address: $HOSTADDRESS$n. State: $SERVICESTATE$nn. Date/Time: $LONGDATETIME$nn. Additional Info: nn$SERVICEOUTPUT$" | /bin/mail -s "** $NOTIFICATIONTYPE$ alert - $HOSTALIAS$/$SERVICEDESC$ is $SERVICESTATE$ **" $CONTACTEMAIL$ } Regional SEE-GRID-SCI Training for Site Administrators, Institute of Physics Belgrade, March 5 -6, 2009

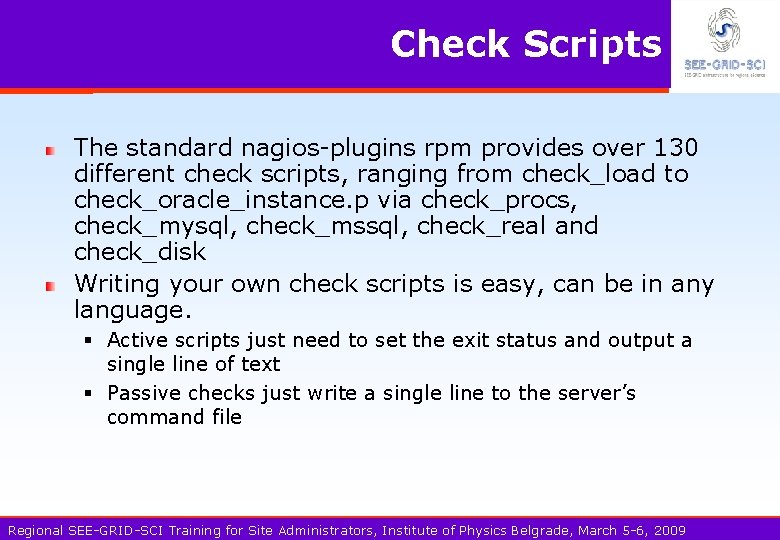
Check Scripts The standard nagios-plugins rpm provides over 130 different check scripts, ranging from check_load to check_oracle_instance. p via check_procs, check_mysql, check_mssql, check_real and check_disk Writing your own check scripts is easy, can be in any language. § Active scripts just need to set the exit status and output a single line of text § Passive checks just write a single line to the server’s command file Regional SEE-GRID-SCI Training for Site Administrators, Institute of Physics Belgrade, March 5 -6, 2009

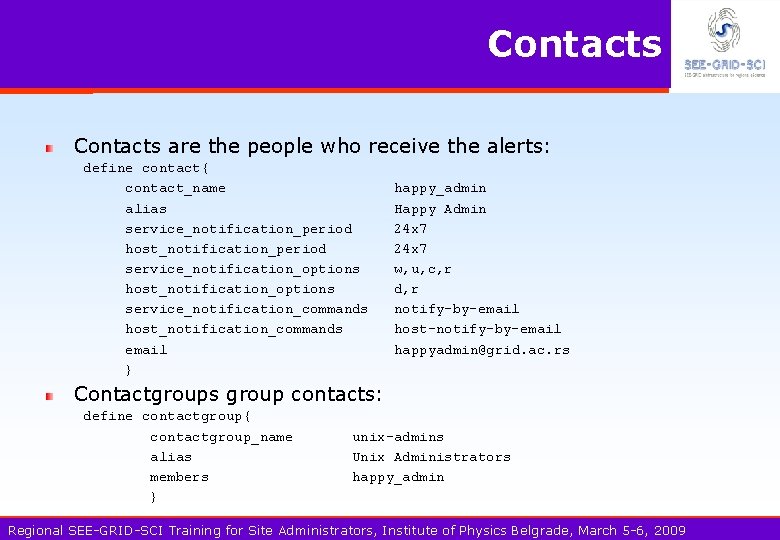
Contacts are the people who receive the alerts: define contact{ contact_name alias service_notification_period host_notification_period service_notification_options host_notification_options service_notification_commands host_notification_commands email } happy_admin Happy Admin 24 x 7 w, u, c, r d, r notify-by-email host-notify-by-email happyadmin@grid. ac. rs Contactgroups group contacts: define contactgroup{ contactgroup_name alias members } unix-admins Unix Administrators happy_admin Regional SEE-GRID-SCI Training for Site Administrators, Institute of Physics Belgrade, March 5 -6, 2009

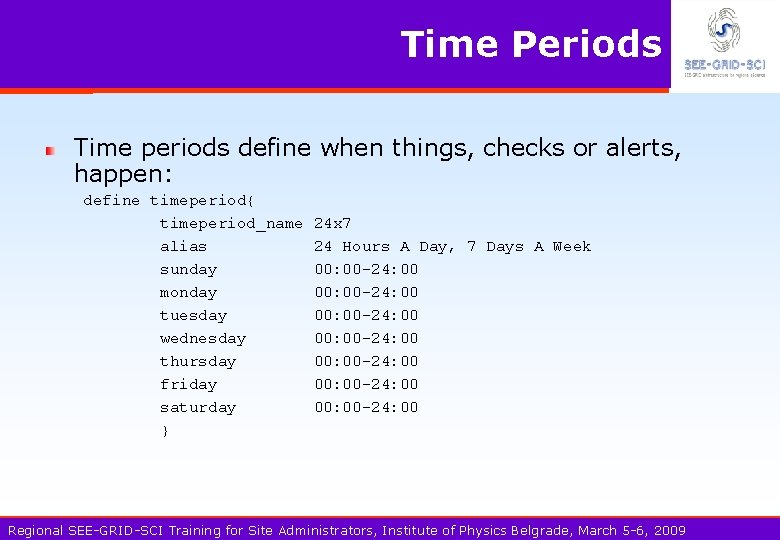
Time Periods Time periods define when things, checks or alerts, happen: define timeperiod{ timeperiod_name alias sunday monday tuesday wednesday thursday friday saturday } 24 x 7 24 Hours A Day, 7 Days A Week 00: 00 -24: 00 00: 00 -24: 00 Regional SEE-GRID-SCI Training for Site Administrators, Institute of Physics Belgrade, March 5 -6, 2009

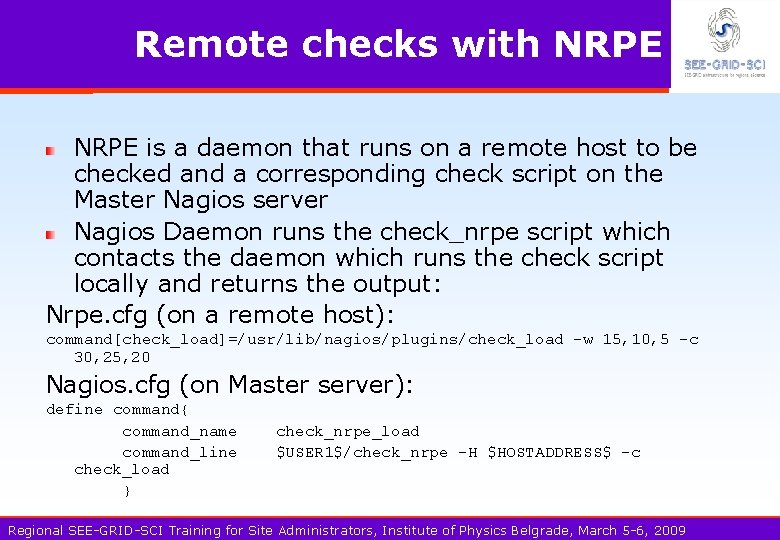
Remote checks with NRPE is a daemon that runs on a remote host to be checked and a corresponding check script on the Master Nagios server Nagios Daemon runs the check_nrpe script which contacts the daemon which runs the check script locally and returns the output: Nrpe. cfg (on a remote host): command[check_load]=/usr/lib/nagios/plugins/check_load -w 15, 10, 5 -c 30, 25, 20 Nagios. cfg (on Master server): define command{ command_name command_line check_load } check_nrpe_load $USER 1$/check_nrpe -H $HOSTADDRESS$ -c Regional SEE-GRID-SCI Training for Site Administrators, Institute of Physics Belgrade, March 5 -6, 2009

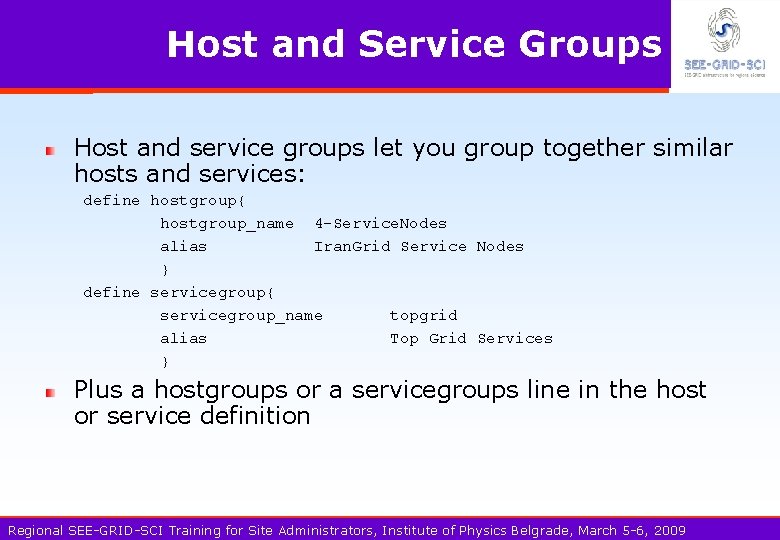
Host and Service Groups Host and service groups let you group together similar hosts and services: define hostgroup{ hostgroup_name 4 -Service. Nodes alias Iran. Grid Service Nodes } define servicegroup{ servicegroup_name topgrid alias Top Grid Services } Plus a hostgroups or a servicegroups line in the host or service definition Regional SEE-GRID-SCI Training for Site Administrators, Institute of Physics Belgrade, March 5 -6, 2009

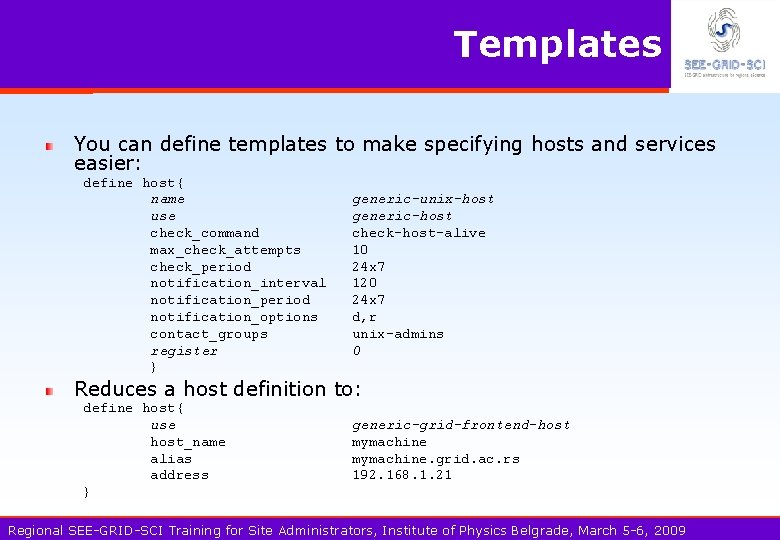
Templates You can define templates to make specifying hosts and services easier: define host{ name use check_command max_check_attempts check_period notification_interval notification_period notification_options contact_groups register } generic-unix-host generic-host check-host-alive 10 24 x 7 120 24 x 7 d, r unix-admins 0 define host{ use host_name alias address } generic-grid-frontend-host mymachine. grid. ac. rs 192. 168. 1. 21 Reduces a host definition to: Regional SEE-GRID-SCI Training for Site Administrators, Institute of Physics Belgrade, March 5 -6, 2009

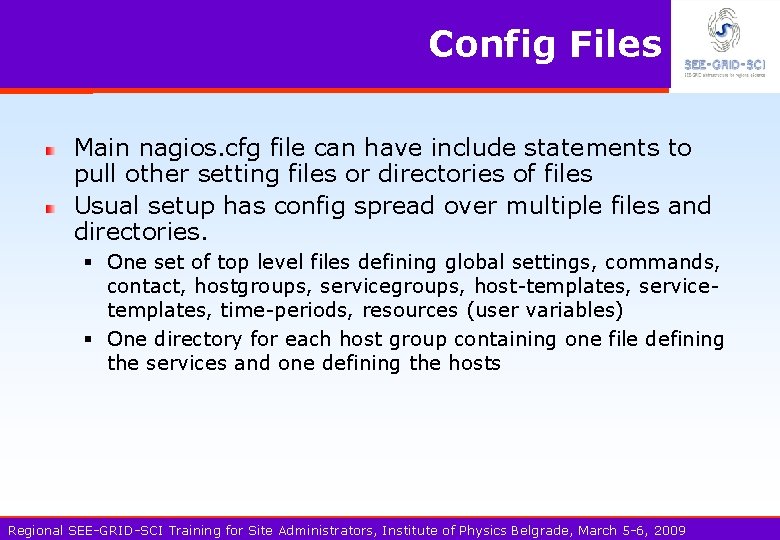
Config Files Main nagios. cfg file can have include statements to pull other setting files or directories of files Usual setup has config spread over multiple files and directories. § One set of top level files defining global settings, commands, contact, hostgroups, servicegroups, host-templates, servicetemplates, time-periods, resources (user variables) § One directory for each host group containing one file defining the services and one defining the hosts Regional SEE-GRID-SCI Training for Site Administrators, Institute of Physics Belgrade, March 5 -6, 2009

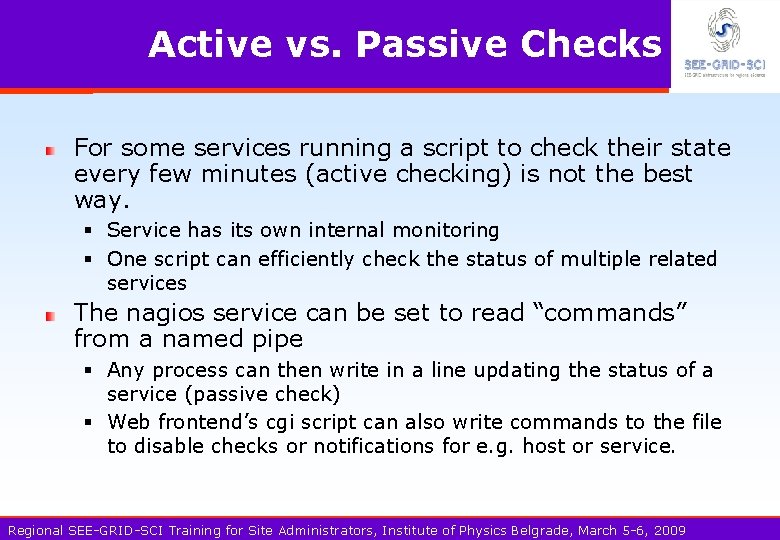
Active vs. Passive Checks For some services running a script to check their state every few minutes (active checking) is not the best way. § Service has its own internal monitoring § One script can efficiently check the status of multiple related services The nagios service can be set to read “commands” from a named pipe § Any process can then write in a line updating the status of a service (passive check) § Web frontend’s cgi script can also write commands to the file to disable checks or notifications for e. g. host or service. Regional SEE-GRID-SCI Training for Site Administrators, Institute of Physics Belgrade, March 5 -6, 2009

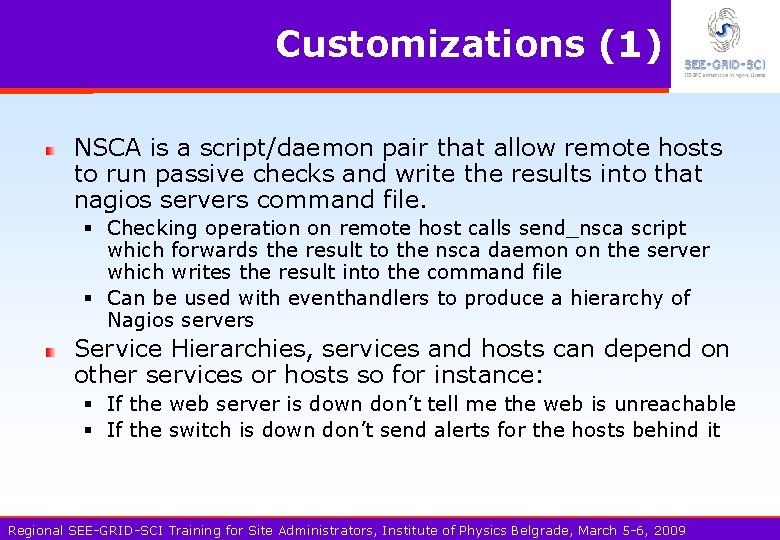
Customizations (1) NSCA is a script/daemon pair that allow remote hosts to run passive checks and write the results into that nagios servers command file. § Checking operation on remote host calls send_nsca script which forwards the result to the nsca daemon on the server which writes the result into the command file § Can be used with eventhandlers to produce a hierarchy of Nagios servers Service Hierarchies, services and hosts can depend on other services or hosts so for instance: § If the web server is down don’t tell me the web is unreachable § If the switch is down don’t send alerts for the hosts behind it Regional SEE-GRID-SCI Training for Site Administrators, Institute of Physics Belgrade, March 5 -6, 2009

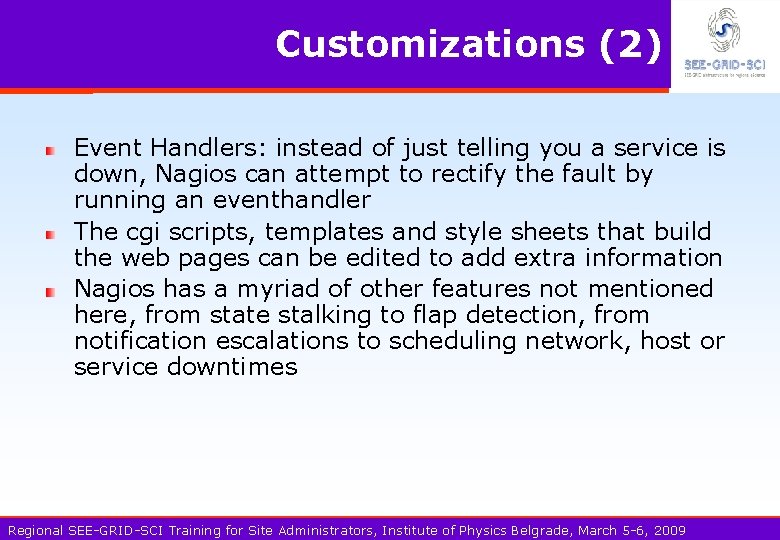
Customizations (2) Event Handlers: instead of just telling you a service is down, Nagios can attempt to rectify the fault by running an eventhandler The cgi scripts, templates and style sheets that build the web pages can be edited to add extra information Nagios has a myriad of other features not mentioned here, from state stalking to flap detection, from notification escalations to scheduling network, host or service downtimes Regional SEE-GRID-SCI Training for Site Administrators, Institute of Physics Belgrade, March 5 -6, 2009

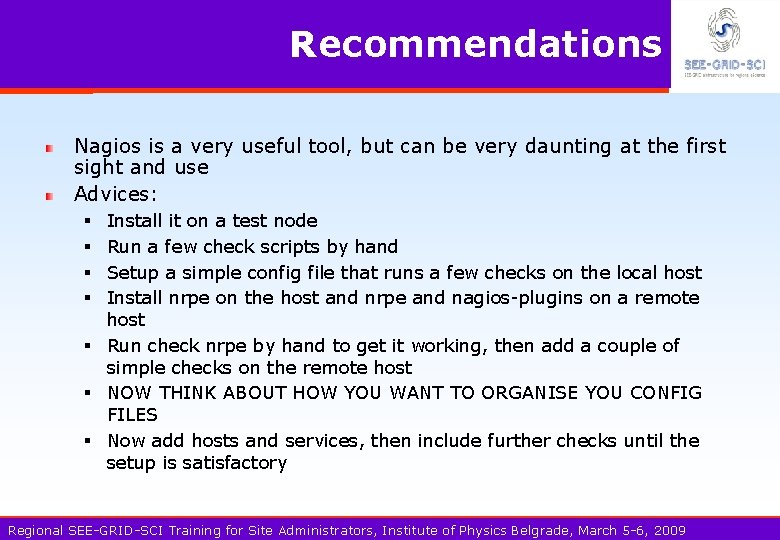
Recommendations Nagios is a very useful tool, but can be very daunting at the first sight and use Advices: Install it on a test node Run a few check scripts by hand Setup a simple config file that runs a few checks on the local host Install nrpe on the host and nrpe and nagios-plugins on a remote host § Run check nrpe by hand to get it working, then add a couple of simple checks on the remote host § NOW THINK ABOUT HOW YOU WANT TO ORGANISE YOU CONFIG FILES § Now add hosts and services, then include further checks until the setup is satisfactory § § Regional SEE-GRID-SCI Training for Site Administrators, Institute of Physics Belgrade, March 5 -6, 2009

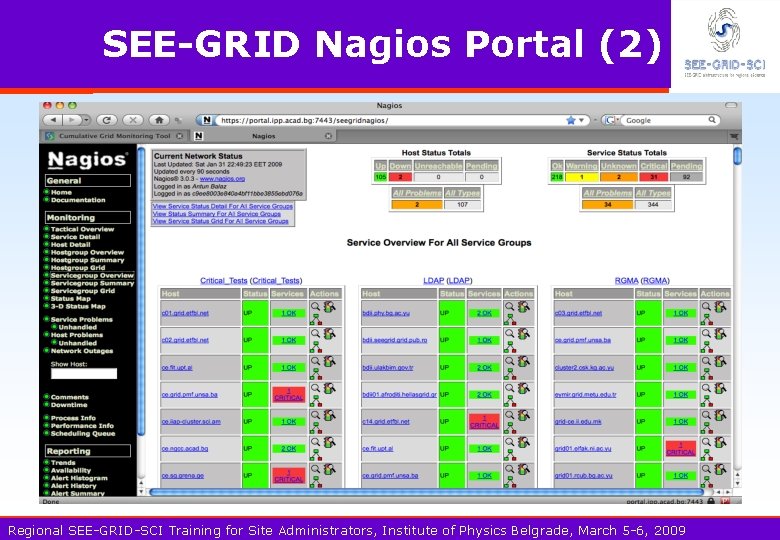
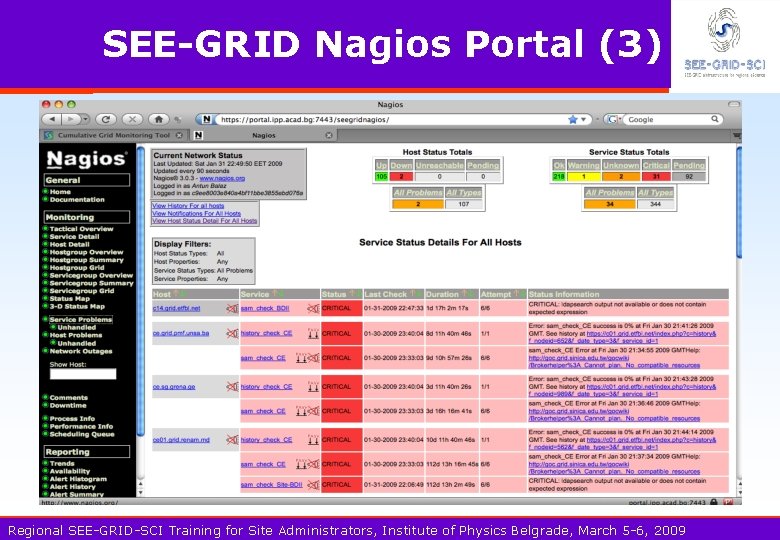
Nagios-based Grid Monitoring of EGEE resources in Central Europe § core services since mid 2006 § http: //nagios. ce-egee. org Regional SEE-GRID-SCI Training for Site Administrators, Institute of Physics Belgrade, March 5 -6, 2009

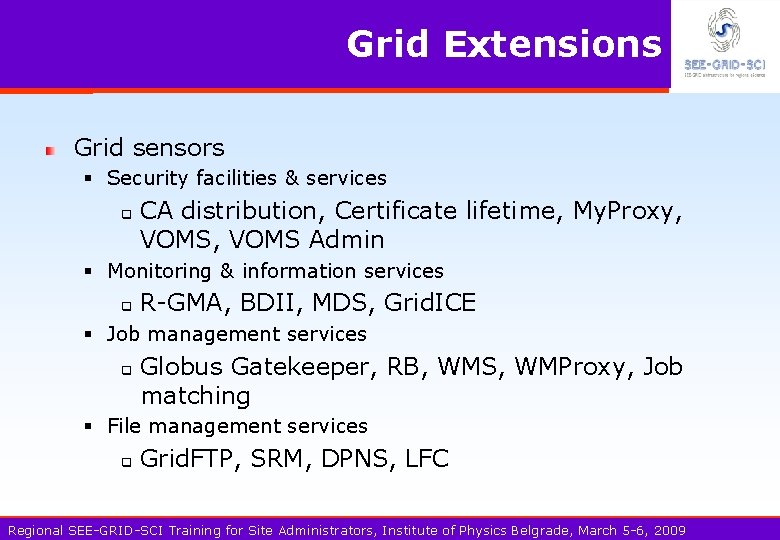
Grid Extensions Grid sensors § Security facilities & services q CA distribution, Certificate lifetime, My. Proxy, VOMS Admin § Monitoring & information services q R-GMA, BDII, MDS, Grid. ICE § Job management services q Globus Gatekeeper, RB, WMS, WMProxy, Job matching § File management services q Grid. FTP, SRM, DPNS, LFC Regional SEE-GRID-SCI Training for Site Administrators, Institute of Physics Belgrade, March 5 -6, 2009


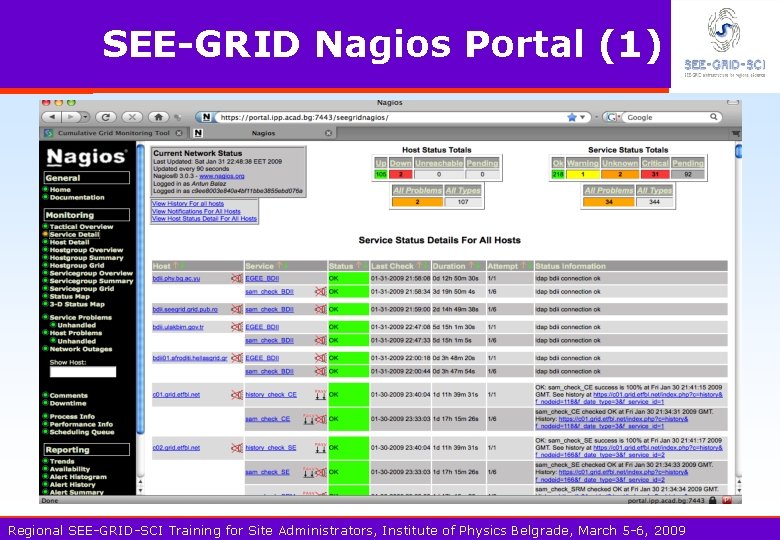
SEE-GRID Nagios Portal (1) Regional SEE-GRID-SCI Training for Site Administrators, Institute of Physics Belgrade, March 5 -6, 2009

SEE-GRID Nagios Portal (2) Regional SEE-GRID-SCI Training for Site Administrators, Institute of Physics Belgrade, March 5 -6, 2009

SEE-GRID Nagios Portal (3) Regional SEE-GRID-SCI Training for Site Administrators, Institute of Physics Belgrade, March 5 -6, 2009

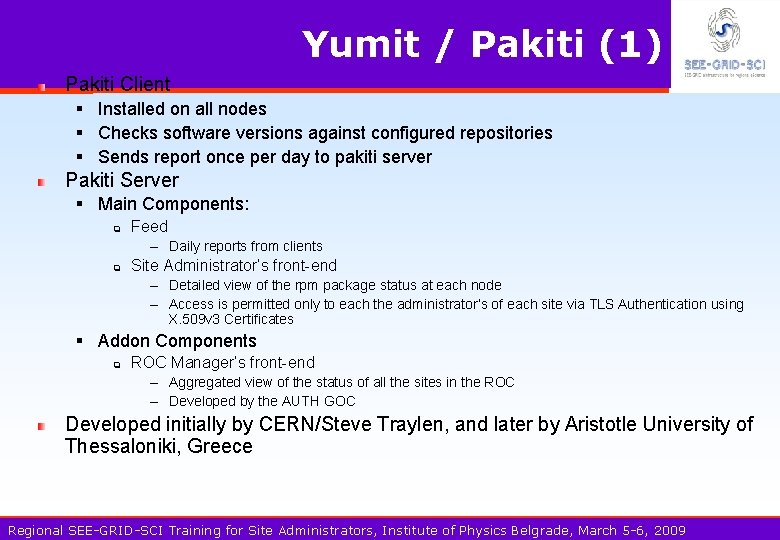
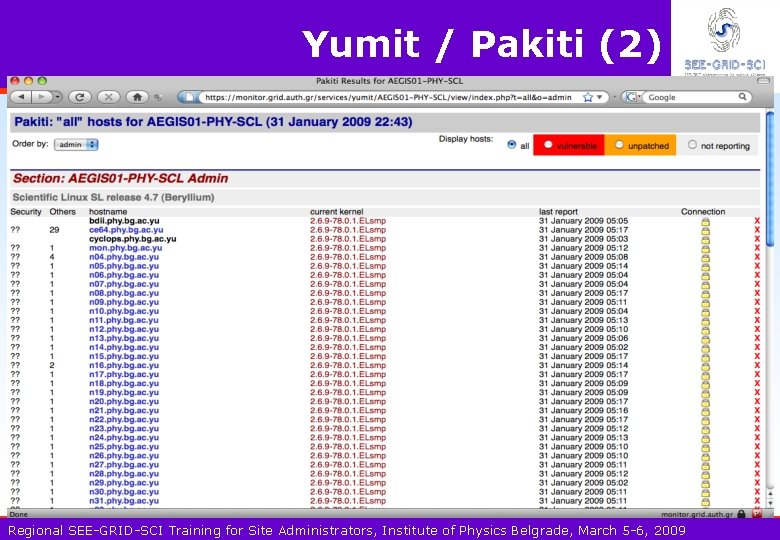
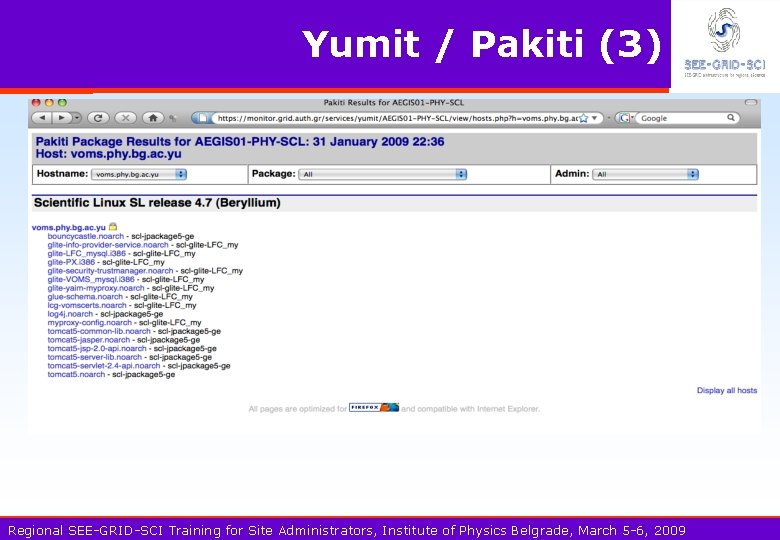
Yumit / Pakiti (1) Pakiti Client § Installed on all nodes § Checks software versions against configured repositories § Sends report once per day to pakiti server Pakiti Server § Main Components: q Feed – Daily reports from clients q Site Administrator’s front-end – Detailed view of the rpm package status at each node – Access is permitted only to each the administrator’s of each site via TLS Authentication using X. 509 v 3 Certificates § Addon Components q ROC Manager’s front-end – Aggregated view of the status of all the sites in the ROC – Developed by the AUTH GOC Developed initially by CERN/Steve Traylen, and later by Aristotle University of Thessaloniki, Greece Regional SEE-GRID-SCI Training for Site Administrators, Institute of Physics Belgrade, March 5 -6, 2009

Yumit / Pakiti (2) Regional SEE-GRID-SCI Training for Site Administrators, Institute of Physics Belgrade, March 5 -6, 2009

Yumit / Pakiti (3) Regional SEE-GRID-SCI Training for Site Administrators, Institute of Physics Belgrade, March 5 -6, 2009

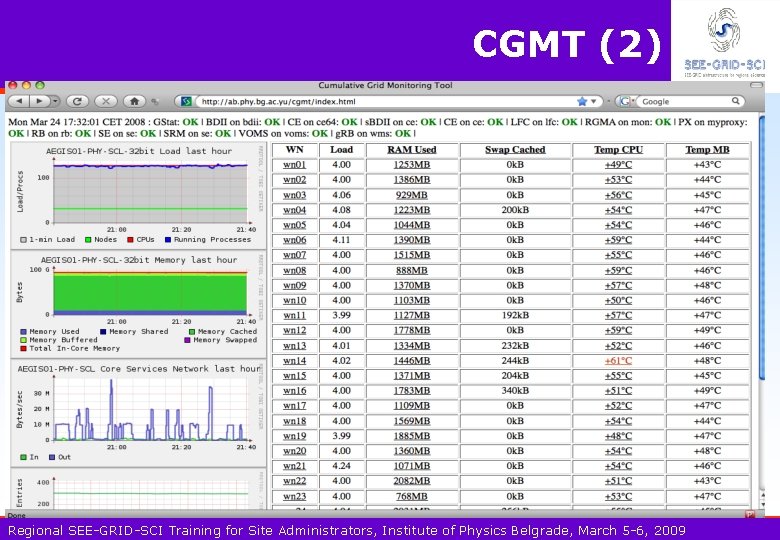
CGMT (1) Cumulative Grid Monitoring Tool developed by the Scientific Computing Laboratory of the Institute of Physics Belgrade Collects information from other monitoring tools Provides also information on temperatures of hosts (CPU and MB) Soon to be replaces by the Cyclops tool, which is currently being developed Regional SEE-GRID-SCI Training for Site Administrators, Institute of Physics Belgrade, March 5 -6, 2009

CGMT (2) Regional SEE-GRID-SCI Training for Site Administrators, Institute of Physics Belgrade, March 5 -6, 2009

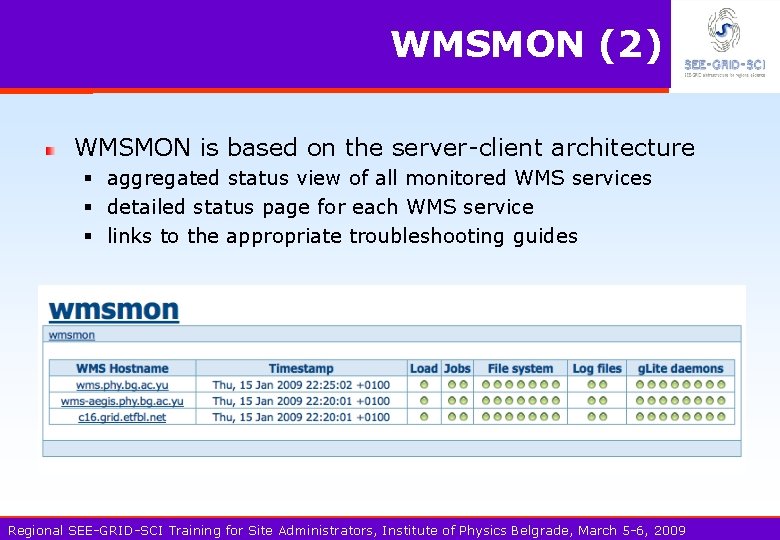
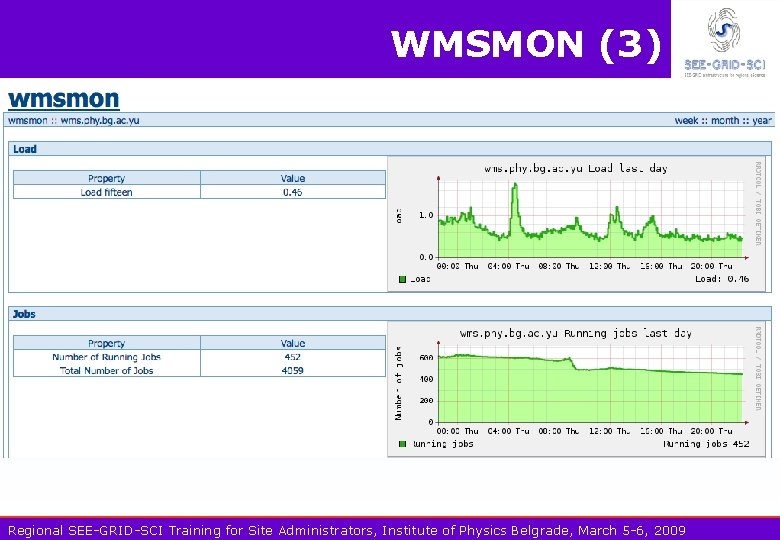
WMSMON (1) Computing resources discovery and management in the g. Lite environment is done by the WMS Current implementation of Grid Service Availability Monitoring framework does not include direct probes of WMSMON - newly developed g. Lite WMS monitoring tool by the Scientific Computing Laboratory of the Institute of Physics Belgrade § site independent g. Lite WMS monitoring § centralized g. Lite WMS monitoring § uniform g. Lite WMS monitoring Regional SEE-GRID-SCI Training for Site Administrators, Institute of Physics Belgrade, March 5 -6, 2009

WMSMON (2) WMSMON is based on the server-client architecture § aggregated status view of all monitored WMS services § detailed status page for each WMS service § links to the appropriate troubleshooting guides Regional SEE-GRID-SCI Training for Site Administrators, Institute of Physics Belgrade, March 5 -6, 2009

WMSMON (3) Regional SEE-GRID-SCI Training for Site Administrators, Institute of Physics Belgrade, March 5 -6, 2009

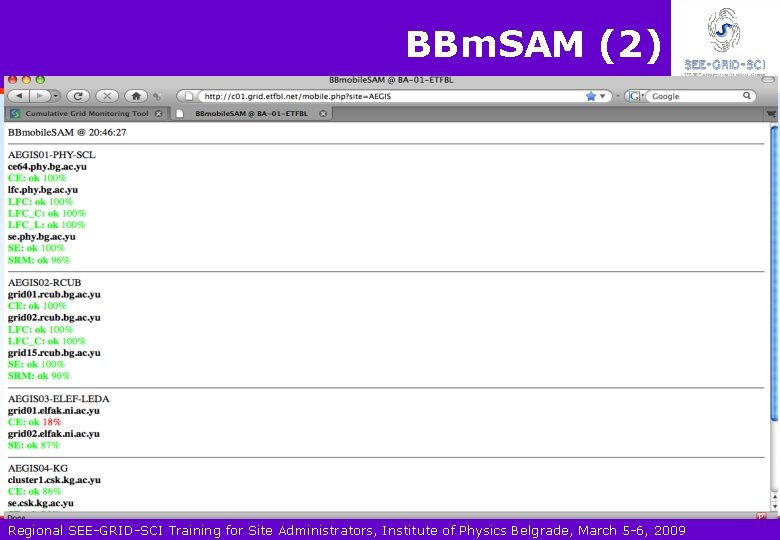
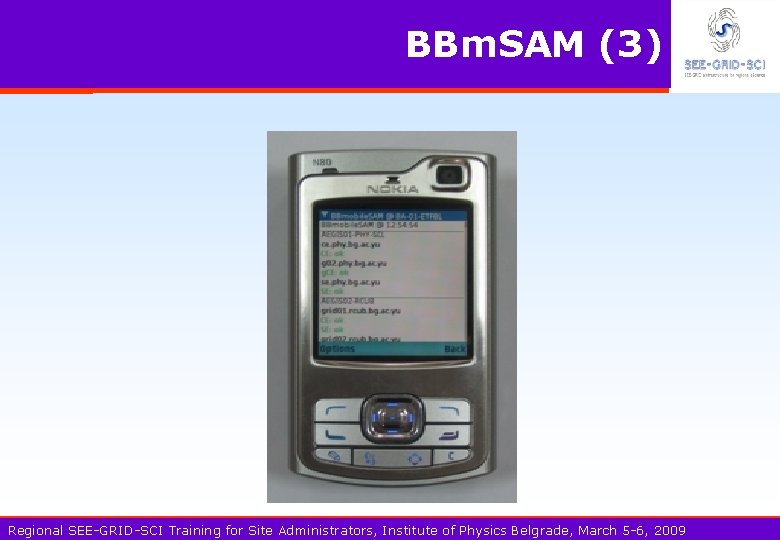
BBm. SAM (1) BBm. SAM portal § Created for SLA monitoring q q Generating site availability statistics according to several criteria Overview (HTML) and full dump (CSV) of data possible § Extended into full SAM portal Availability for last 24 h period for all sites/services q Latest results per service q History for nodes/services BBmobile. SAM q § Optimized for small-screen devices and low bandwidth § Possible filtering of sites § Possible three levels of details Developed by the University of Banjaluka, Bosnia and Herzegovina Regional SEE-GRID-SCI Training for Site Administrators, Institute of Physics Belgrade, March 5 -6, 2009

BBm. SAM (2) Regional SEE-GRID-SCI Training for Site Administrators, Institute of Physics Belgrade, March 5 -6, 2009

BBm. SAM (3) Regional SEE-GRID-SCI Training for Site Administrators, Institute of Physics Belgrade, March 5 -6, 2009

CLI scripts Shell scripts are very powerful tools Monitoring of queue systems and other services Direct active and passive probes Many Ganglia and Nagios probes/checks Initially developed as shell scripts by sys admins Regional SEE-GRID-SCI Training for Site Administrators, Institute of Physics Belgrade, March 5 -6, 2009

Summary Monitoring of computing resources is essential § Ensures availability and quality of service § Prevents (or provides early diagnosis of) problems § Gives insights into infrastructure bottlenecks and helps in improving and customizing cluster design A vast set of monitoring tools exist § Deployment of at least one tool is necessary if you have more than a few nodes § Integration of interfaces of various tools is difficult task § Messaging systems could provide major simplification for monitoring integration frameworks Development efforts should be shared / coordinated § New developments more useful if they fit to existing tools Regional SEE-GRID-SCI Training for Site Administrators, Institute of Physics Belgrade, March 5 -6, 2009