Respiratory Monitoring Dr Arthur ChunWing LAU Associate Consultant


 would be expected to lower Pa. O")


 •")


 • a) shifts the oxygen dissociation curve")

, i. e. similar to")


 state to the")


 • a unique")
 pulse oximeter, Masimo Corp. (Irvine, CA)")
. • The")


")


 occlusion pressure (P 0. 1 ), (B) respiratory frequency (f), and")


 n 1. 2. 3. 4. The commercially available RIP device,")

 with different")


 n n Seldom evaluated Important in patients with inc MV")

 • On Sep 25, 2006, MAQUET")


- Slides: 70
Respiratory Monitoring Dr Arthur Chun-Wing LAU Associate Consultant Department of Intensive Care PYNEH 28 Sep 2007
Gas exchange n n Pulse oximetry Capnometry Continuous blood gas analysis Transcutaneous monitoring (PTCO 2 and PTCCO 2)
Question Which patient is more hypoxemic, and why? n n Patient p. H Pa. CO 2 Pa. O 2 Sa. O 2 Hb A 7. 48 34 85 95 7 B 7. 32 74 55 85 15 Answer: A (Patient A, with the higher Pa. O 2 but the lower hemoglobin content, is more hypoxemic) • Patient A: Arterial oxygen content = 7 x 1. 36 x. 95 + 0. 0031 x 85 = 9. 3 ml O 2/dl • Patient B: Arterial oxygen content = 15 x 1. 36 x. 85 + 0. 0031 x 55 = 17. 5 ml O 2/dl
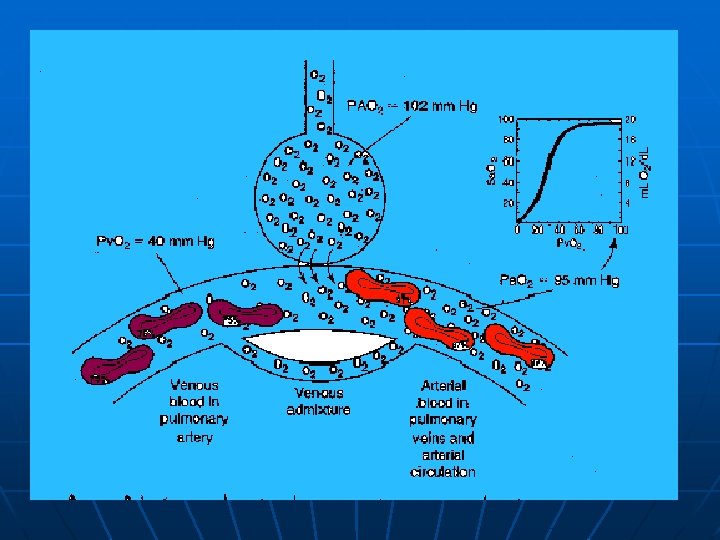
Arterial oxygen content n n n Ca. O 2 = Total oxygen content in the arterial blood in ml O 2/d. L (N: 18 – 21) (Hgb x 1. 36 x Sa. O 2) Oxygen bound to Hb • Sp. O 2: measured by pulse oximeter • Sa. O 2: calculated from Pa. O 2 + (0. 0031 x Pa. O 2) Oxygen dissolved in plasma • negligible amount • Measured by electrode
Question n Which of the following situation(s) would be expected to lower Pa. O 2? 1. 2. 3. 4. 5. n anemia CO poisoning Abnormal hemoglobin that holds oxygen with half the affinity of normal hemoglobin Abnormal hemoglobin that holds oxygen with twice the affinity of normal hemoglobin lung disease with intra-pulmonary shunting. Answer: only 5 • • 1 affects only content, not oxygen saturation or PO 2. 2 through 4 affect only oxygen saturation and content, not PO 2
Important • Neither the quantity nor quality of hemoglobin should affect the amount of dissolved oxygen, and hence should not affect the Pa. O 2. • Pa. O 2 is not a function of hemoglobin content or of its characteristics, but only of the alveolar PO 2 and the lung architecture (alveolar-capillary interface).
How to measure oxygen saturation 1. 2. 3. 4. Calculated from p. O 2: as in most automated blood gas analyzers (Clark electrodes) 1. calculated from the measured parameters p. O 2 and p. H, on the basis of standard oxygen-dissociation curves 2. Assumption: there is an otherwise normal hemoglobin dissociation curve, also provided that nothing else is binding to the Hb except O 2 Differential spectrophotometry: as in oximeter Tonometry 1. process of exposing a liquid to an ambient gas phase in such a way that each gas in the gaseous phase partitions to an equilibrium between the liquid and gas phases. 2. For QC samples, checking linearity of electrodes, or for various hemoglobin studies. Transcutaneous monitors 1. rely on the oxygen content of capillary blood 2. measured by heating skin locally to dilate capillaries 3. agrees well with arterial blood p. O 2 when tissue perfusion is adequate, but not in states of hypoperfusion
Pulse Oximetry
What is oxygen saturation % n Numerator • oxygenated Hemoglobin • carboxyhemoglobin (usu not present) • methemoglobin (usu not present) n Denominator • total oxygenated and deoxygenated hemoglobin
Based on two physical principles 1. Photoplethysmography: “pulse” n to distinguish pulsatile arterial blood from venous blood 2. Spectrophotometry: “oximeter” n to distinguish oxyhemoglobin (oxy. Hb) and deoxyhemoglobin (deoxy. Hb)
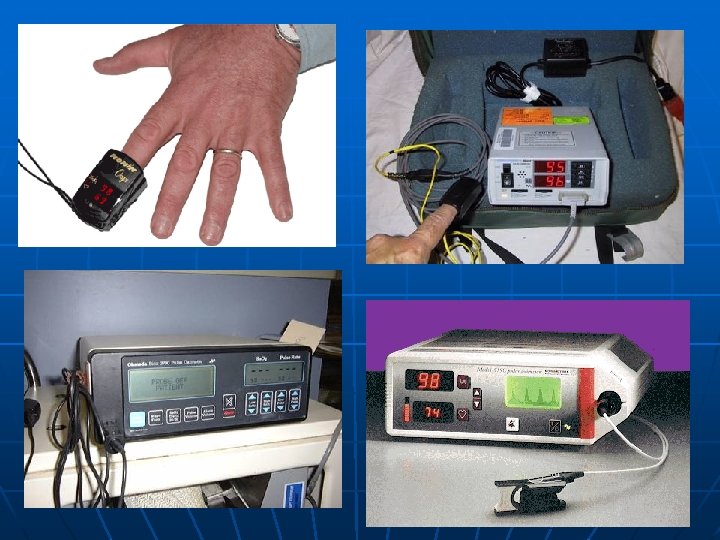
Typical pulse oximeter sensing configuration on a finger Probes for fingers and ear lobes are commonly used
Two light-emitting diodes Emit light of the following wavelengths 1. 660 nm (red) • 2. 940 nm (infrared) • n n Absorbed more by dexoy. Hb Absorbed more by oxy. Hb Ratio of absorbencies is calibrated against direct measurements of arterial oxygen saturation (Sa. O 2) Numeric value of the red-to-infrared ratio (R/IR) is converted to Sp. O 2
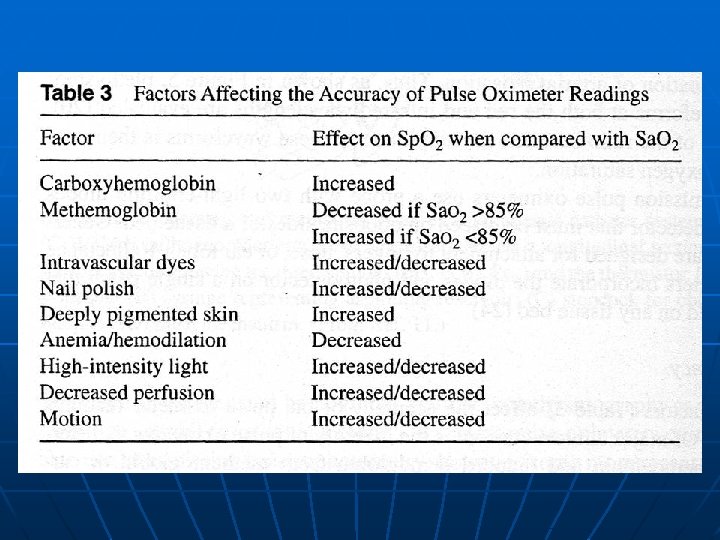
Bias +/- precision of Sp. O 2 varies with levels of actual Sa. O 2 n n Accuracy varies widely because of different algorithms employed Prudent to assume that Sp. O 2 is over-estimating Sa. O 2, and to take some action whenever Sp. O 2 falls below 93% Bias (differenc e) Precision (SD) >=90 1. 7% % 1. 2% <90% 5. 1% % 2. 7% Jubran & Tobin. Chest 1990
van Oostrom JH and Melker RJ. Anesth Analg 2004; 98: 1354 – 8
Question n Carbon monoxide (>= 1 answers) • a) shifts the oxygen dissociation curve to the left b) lowers the Pa. O 2 c) lowers the arterial oxygen content d) is elevated in the blood of cigarette smokers Correct responses are a, c and d. Carbon monoxide does not lower the Pa. O 2
CO poisoning > 200 x affinity for Hb than O 2
Carboxyhemoglobin • COHb absorption spectrum is at 940 nm (IR), i. e. similar to that of oxy. Hb • Therefore, read by the oximeter as if it were oxy. Hb (does not affect the reading) • For example n Sp. O 2 95% can represent true Sa. O 2 of 85% +10% COHb
Question n Blood gas checked in room air: Pa. O 2 is 77 mm Hg (10. 3 k. Pa) Below are three values for arterial oxygen saturation from this patient: 1. 95%, calculated from Pa. O 2 value 2. 98%, from pulse oximeter 3. 85%, from co-oximeter Question: • Which value is the most reliable? This patient actually had 10% carboxy-hemoglobin and 2% methemoglobin
Answer n Co-oximeter directly measure oxyhemoglobin, carboxyhemoglobin and methemoglobin, using four wavelengths of light • Calculated Sa. O 2 is only reliable if nothing else but oxygen is binding to hemoglobin, which you can't know from just the Pa. O 2.
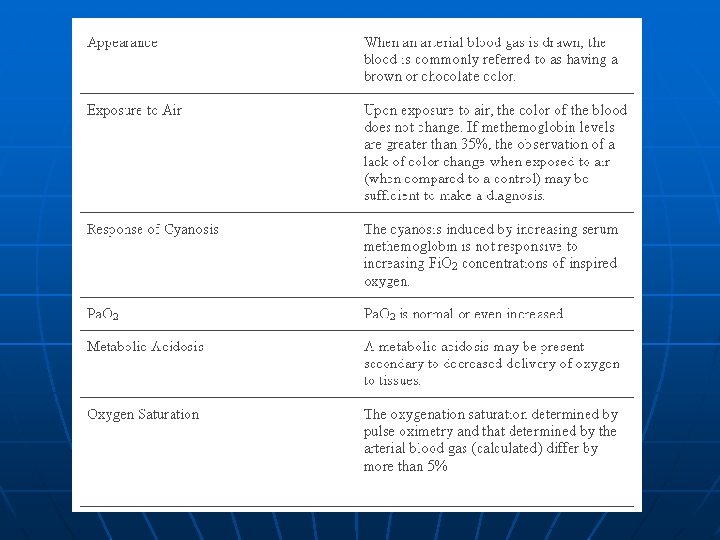
Methemoglobinemia n n n Met. Hb depresses the Sp. O 2 reading non-linearly • Absorbs R light (660 nm) similar to that by deoxy. Hb • Absorbs IR light (940 nm) to a greater extent than of both oxy. Hb and deoxy. Hb Net result: Met. Hb causes the Sp. O 2 to migrate toward 85%, further increases in [met. Hb] do not lower the Sp. O 2 any further For example: • True high Sa. O 2 (>85%) condition: Met. Hb results in a falsely low Sp. O 2 • True low Sa. O 2 (<85%) condition: Met. Hb results in a falsely high Sp. O 2
Etiology Fe within Hb is oxidized from the ferrous (Fe 2+) state to the ferric (Fe 3+) state n Effects: n • formation of methemoglobin • inability to transport oxygen and carbon dioxide • brownish discoloration of the blood
Causes of Met. Hb n Acquired: • Exposure to Nitrites, Aniline dyes, Silver nitrate, Nitroprusside, Antimalarials; • Local anesthetics (Benzocaine, prilocaine, and lidocaine, particularly when applied to mucosa, such as during bronchoscopy, or after repeated cutaneous exposure to eutectic mixture of lidocaine-prilocaine (EMLA(R) cream) over a short period of time; • Nitric and nitrous oxides; • Vegetables (eg, spinach, beets, carrots) inadequately cooked or contaminated with bacteria n Hereditary: deficiency of NADH cytochrome b 5 reductase or NADPH-flavin reductase or the presence of hemoglobin M.
The patient had been wrongly given sodium nitrite instead of the herbal Natrii. Sulfas (chiefly Na. PO 4) as a laxative for clearing heat and decreasing edema.
Low perfusion-resistant pulse oximeter n Masimo Signal Extraction Technology (Masimo SET) • a unique method of measuring signals accurately and reliably in the presence of patient motion and low perfusion • employs 5 parallel processing engines
Radical Signal Extraction Technology (SET) pulse oximeter, Masimo Corp. (Irvine, CA)
Rad-57 portable pulse CO-oximeter, manufactured and entered by Masimo Corp. (Irvine, CA). • The Rad-57 is the world’s first pulse CO-oximeter. • Masimo Rainbow SET® technology analyzes 7+ wavelengths of light to accurately measure carboxyhemoglobin (Sp. CO®) and methemoglobin (Sp. Met™) percent levels in the blood noninvasively and continuously
Rainbow technology uses 7+ wavelengths of light to continuously and noninvasively measure carboxyhemoglobin (Sp. CO®) and methemoglobin (Sp. Met™) Perfusion Index (PI) with trending capability indicates arterial pulse signal strength and may be used as a diagnostic tool during low perfusion. Pleth Variability Index (PVI): captures vital thoracic pressure changes that may compromise normal cardiac function affecting systemic circulation Accurate on cyanotic patients. Signal IQ® waveform for signal identification and quality indication during excessive motion and low signal to noise situations.
Transcutaneous monitoring n n n Measures O 2 and CO 2 diffusing through the skin Mainly used in infants (NICU, PICU) Relis on the oxygen content of capillary blood agrees well with arterial blood p. O 2 when tissue perfusion is adequate, but not in states of hypoperfusion measured by heating skin locally to dilate capillaries The heat emitted by the electrode may cause areas of redness on the skin. Hence, the site of placement of the sensor needs to be changed regularly.
Continuous blood gas monitoring n n A fiber optic sensor with three sensing elements for monitoring p. H, PCO 2, and PO 2 plus a thermocouple for measuring temperature. Length: 30 cm; diameter <0. 5 mm, dead space 6/10, 000 of a milliliter A Y connector on the sensor allows simultaneous continuous blood pressure monitoring and enables intermittent withdrawal of blood samples and infusions. Performance in the clinical setting was not as satisfactory, especially for PO 2 values. (Ganter M and Zollinger A. Br J Anaesth 2003) Diametrics Paratrend 7+ sensor for adults
Capnography
Capnography n n Measurement of CO 2 in expired gas Analyzers utilize • Infrared (employed in most intensive care units) • mass or Raman spectra technology • photoacoustic spectra technology
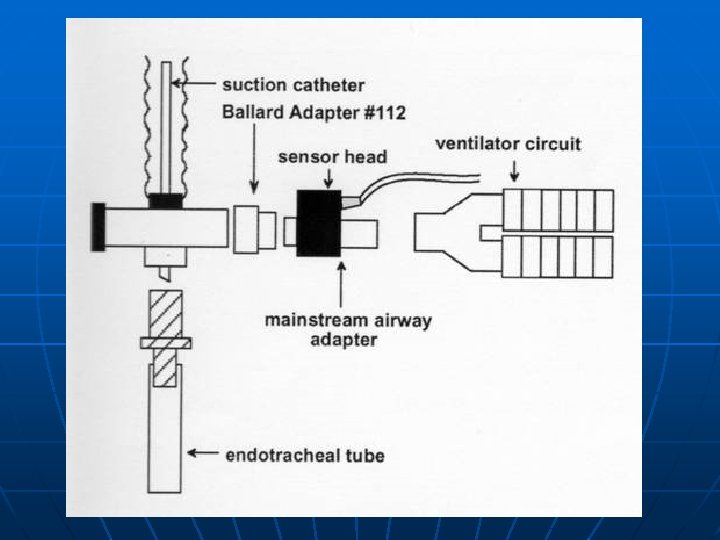
Mainstream or sidestream analyzers n Mainstream analyzer • sampling window inside the ventilator circuit for CO 2 measurement n Sidestream analyzer • aspirates gas from the ventilator circuit, and the analysis occurs away from the ventilator circuit
Mainstream CO 2 sensor n n n During exhalation, exhaled gas passes directly over the sensor Designed primarily for intubated patients Difficult to use in nonintubated patients because 1. it requires a mouthpiece or mask that patients in respiratory distress find uncomfortable 2. In addition, when a mask is used, any supplemental oxygen must be delivered at a flow rate of greater than 6 Lpm to ensure the patient does not rebreathe CO 2 that can accumulate in the mask at lower oxygen flow rates. 3. extra weight of the sensor dragging on the endotracheal tube
Sidestream n n In sidestream capnography, a sample of exhaled gas is aspirated from the patient’s airway interface into the monitor, which houses the sensor. Designed for use in both intubated and nonintubated patients. Prone to obstruction with moisture. Microstream technology is a unique low-flow (50 cc/min) system that permits precise measurement of CO 2 levels without problems of dilution or moisture accumulation.
Normal capnogram Expiration: 1. A or phase 1: Carbon dioxide cleared from the anatomic dead space 2. B or phase 2: dead space and alveolar carbon dioxide 3. C or phase 3: alveolar plateau 4. D or phase 4: end-tidal carbon dioxide tension (PETCO 2): normal range of ETCO 2 is 35 – 45 mm Hg. Inspiration n Inhaled PCO 2 is zero (the amount in inhaled air is negligible)
DISLODGED ETT: Loss of waveform, Loss of ETCO 2 reading CPR: “Square box” waveform; baseline CO 2 = 0; ETCO 2 = 10 -15 mm Hg (possibly higher) with adequate CPR Management: Change rescuers if ETCO 2 drops < 10 ROSC: As in CPR, but ETCO 2 rises above 10 -15 mm Hg Management: Check for pulse
“ SHARKFIN” (Slanting and prolonged phase 2 and increased slope of phase 3 ) with/without prolonged expiration = Bronchospasm (asthma, COPD, allergic rxn) Esophageal intubation: Small CO 2 spikes Hypoventilation: low RR, gradually increases ETCO 2 values > 45 mm. Hg with normal base line RISING BASELINE = Patient is rebreathing CO 2: Rebreathing producing gradual elevation of base line and ETCO 2 values Management: Check equipment for adequate oxygen inflow, allow intubated patient more time to exhale
Onset of hyperventilation: results in gradual lowering of ETCO 2 values. Sustained hyperventilation: high RR; shortened waveform; baseline ETCO 2 = 0; ETCO 2 < 35 mm Hg PATIENT BREATHING AROUND ET TUBE: angled, sloping downstroke on waveform Adult: Broken cuff or tube is too small Pediatric: tube is too small
Common indications n n INTUBATED APPLICATIONS: • Verification of ETT placement • ETT surveillance during transport • CPR: compression efficacy, early sign of ROSC, survival predictor NON-INTUBATED APPLICATIONS: • Bronchospasm: asthma, COPD, anaphylaxis • Hypoventilation: drugs, stroke, CHF, post-ictal • Shock & circulatory compromise • Hyperventilation syndrome: biofeedback monitor
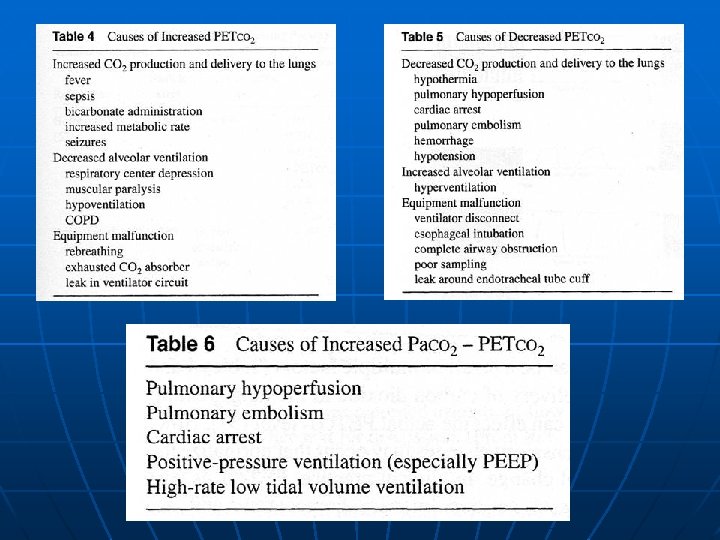
Estimation of Pa. CO 2 n n n In health: Pet. CO 2<= PACO 2 <= Pa. CO 2 • In healthy subjects, Pa. CO 2 - Pet. CO 2 is 1 to 5 mm. Hg • Correlation coefficients between Pet. CO 2 and Pa. CO 2 are 0. 69 to 0. 92 In patients with lung disease and ventilation-perfusion (VQ) imbalance • Pa. CO 2 - Pet. CO 2 is much higher because of increased physiologic dead space Once the difference between the two values is established, and providing the patient remains clinically stable, the Pet. CO 2 may be followed in lieu of the Pa. CO 2.
Limitations n n Composition of the respiratory gas mixture • High concentrations of either or both oxygen or nitrous oxide may affect the capnogram • When a gas that the mass spectrometer cannot detect (such as helium) is present, the reported values of CO 2 are incorrectly elevated in proportion to the concentration of helium present. High breathing frequencies • exceed the response capabilities of the capnograph. The presence of Freon (used as a propellant in metered dose inhalers) • artificially increase the CO 2 reading of mass spectrometers ( ie, to show an apparent increase in [CO 2]) • A similar effect has not yet been demonstrated with Raman or infrared spectrometers. Contamination of the monitor or sampling system by secretions or condensate, a sample tube of excessive length, a sampling rate that is too high, or obstruction of the sampling chamber can lead to unreliable results.
Respiratory Neuromuscular function Airway Occlusion Pressure n Breathing Pattern n Maximal Inspiratory Airway Pressure (MIP) n. Maximal Expiratory Pressure (MEP) n. Transdiaphragmatic pressure n
Airway Occlusion Pressure n n n = Negative pressure generated 0. 1 sec following onset of inspiration against an briefly and surreptitiously occluded airway Measured by inserting a shutter in the ventilator's inspiratory line as near as possible to the patient, and recording airway pressure tracing at the Y piece by maintaining occlusion only for the first 200 to 300 ms of inspiration Why first 100 ms? • chosen because a normal subject requires at least 150 ms to sense the occlusion and react against it
P 0. 1 measurement
Properties n n Unaffected by properties of the respiratory system Does not require scaling to patient size Normal values: 1 cm. H 2 O A measure of neural respiratory drive (central drive) • P 0. 1 is maintained following curare-induced muscular weakness • However, may be reduced in the presence of severe inspiratory muscle weakness when capability to produce pressure is profoundly impaired (consider the P 0. 1/MIP ratio in such case)
Uses n Predicts weaning failure • “High” levels of P 0. 1 (i. e. more negative than – 4 to -6 cm. H 2 O) are associated with increased respiratory effort and indicate an inability to breath independently with success • lower values of P 0. 1 are associated with effective weaning. n closely correlated with the work of breathing
Eight patients recovering from acute respiratory failure of various causes P 0. 1 changed significantly with lower PSV levels when contraction of the SCM muscles occurred P 0. 1 did not change significantly with high levels of PSV Perrigault PO, Thorax 1999; 54: 119– 123
Variations in (A) occlusion pressure (P 0. 1 ), (B) respiratory frequency (f), and (C) tidal volume (VT) with contraction of the sternocleidomastoid (SCM) muscle. SCM- = the lowest PSV level for each patient without SCM activity SCM+ = the first PSV level at which SCM activity occurred. 1. P 0. 1 was the only parameter significantly modified when SCM muscle activity was present. Horizontal lines indicate mean values. 2. VT, Ti, and f did not change significantly at low levels of PSV 10 to PSV 5 3. When no activity of these muscles was detected the P 0. 1 values were always lower than 2. 9 cm H 2 O Perrigault PO, Thorax 1999; 54: 119– 123
Breathing Pattern Tidal volume, Respiratory frequency, Ti, Ttot, rib cage and abdominal motion n Measured by n • Wright spirometer (VT, f) • Respiratory inductive plethysmography (RIP)
Wright spirometer
Respiratory inductive plethysmography (RIP) n 1. 2. 3. 4. The commercially available RIP device, Respitrace (Ambulatory Monitoring) rib cage sensor bands abdominal sensor bands the oscillator the signal demodulator • For accurate volumetric measurements using RIP, it is assumed that the cross-sectional area within the rib cage and the abdomen coil, respectively, reflects all of the changes occuring within the respective lung compartment, and further that the lung volume change is the sum of the volume changes of the two compartments. • Under optimal situations lung volume can be approximated with an error less than 10%, less accurate in lateral decubitus and obesity
Breathing patterns parameters n n f/VT ratio = rapid shallow breathing index • Measured during the first minute after transition to spontaneous T-piece breathing • >100 breaths/min/L suggests that a trial of weaning is unlikely to be successful VT/Ti • Reflection of central respiratory drive • In patients who failed a weaning trial, VT/Ti increased significantly from the start to the end of the trial
Table 2 Variation in breathing pattern and occlusion pressure (P 0. 1) with different levels of pressure support (PS) ventilation Perrigault PO, Thorax 1999; 54: 119– 123
Maximal Inspiratory Airway Pressure n n Defined as the most negative pressure generated during a maximal inspiratory against an occluded airway (for 15 – 20 secs) Evaluation of inspiratory muscle strength Usually measured after a forced expiration to residual volume (some suggest FRC, in order to mimic spontaneous ventilation) Normal values: -100 cm. H 2 O
Uses n to assess weaning feasibility • more negative than -30 cm H 2 O predicts weaning success • less negative than -20 cm H 2 O predicts weaning failure • should always be considered in conjunction with other variables • used in conjunction with P 0. 1 measurement (P 0. 1/MIP) for increasing the specificity and sensitivity n to evaluate the respiratory effects of neuromuscular disease
Limitations n n Difficult to obtain in uncooperative patients Not very reliable in predicting weaning success
Maximal expiratory pressure (MEP) n n Seldom evaluated Important in patients with inc MV or airflow obstruction in whom expiration is an active process Performed from TLC Normal 150 cm. H 2 O
Transdiaphragmatic pressure n n Pdi = Pg – Pes Having the patient make a maximal inspiratory effort from FRC against an occluded airway Intersubject variability Pdi < 25 cm. H 20 suggests severe diaphragmatic weakness
SERVO-i ventilator with NAVA (neurally adjusted ventilatory assist) • On Sep 25, 2006, MAQUET Critical Care announced the launch of NAVA (Neurally Adjusted Ventilatory Assist) at the 19 th Annual Congress of the European Society of Intensive Care Medicine.
NAVA • NAVA senses activity in the diaphragm and responds by providing the requested level of ventilatory assist. • The Edi signal is obtained by an electrode array mounted close to the distal tip of the Edi catheter. • This catheter can also serve as a conventional nasogastric feeding tube.
Benefits 1. Improved synchrony and patient comfort n In NAVA the ventilator is cycled-on as soon as neural inspiration starts. Moreover, the level of assistance provided during inspiration is determined by the patient’s own respiratory center demand. The same applies for the cyclingoff phase - the ventilator cycles off inspiration the instant it is alerted to the onset of neural expiration. By utilizing the Edi signal, maintenance of synchrony between the patient and the ventilator is improved. 2. Lung protection n With NAVA the patient's own respiratory demands determine the level of assistance. NAVA gives the opportunity to avoid over or under assistance of the patient. 3. Unique monitoring capability n The Edi signal is a new unique parameter in mechanical ventilation. It can be used as a diagnostic tool to monitor the electrical activity of the diaphragm (Edi). The Edi curve and its associated value can thus be used as a powerful monitoring tool in all ventilation modes, providing information on Respiratory Drive, Volume requirements and the effect of the ventilatory settings, and to gain indications for sedation and weaning. 4. Decision support for unloading and extubation n The Edi signal can be used as an indicator to set the support level from the ventilator, and to optimize unloading. As the patient’s condition improves, Edi amplitude decreases, resulting in reduction in ventilator-delivered pressure. This pressure drop is an indicator to consider weaning and extubation.
Breathing workload Work of breathing Pressure-Time Product Tension-time Index Oxygen consumption/Energy cost of breathing Respiratory Mechanics • Primary measurements • Pao, Pes, Flow, auto-PEEP) • Derived measurements • Static compliance, Dynamic compliance, Pressure-volume curves, Resistance Also refer to lecture on “Waveform analysis on Mechanical Ventilation”
Thank you