Putting Kafka into Overdrive Todd Palino Linked In















- Slides: 68

Putting Kafka into Overdrive Todd Palino (Linked. In) & Gwen Shapira (Confluent)

Us Todd Palino Gwen Shapira Staff SRE @ Linked. In Committer @ Burrow Previously: System Architect @ Confluent Committer @ Apache Kafka Previously: Systems Engineer @ Verisign Find me: tpalino@gmail. com @bonkoif Software Engineer @ Cloudera Senior Consultant @ Pythian Find me: gwen@confluent. io @gwenshap

There’s a Book on That! Early Access available now Get a signed copy: ● Today at 6: 20 PM @ O’Reilly Booth ● Tomorrow at 1: 00 PM @ Confluent Booth (#838)

You • SRE / Dev. Ops • Developer • Know some things about Kafka

Kafka So, we are done, right? • High Throughput • Scalable • Low Latency • Real-time • Centralized • Awesome

When it comes to critical production systems – Never trust a vendor. 6

Our favorite conversation: Kafka is super slow. Sometimes messages take over a second to show up.

Or… I can only push 20 k messages per second? You have got to be kidding me.

We want to know… • Is this normal? What should we expect? • What are good hardware / configuration to use to avoid 3 am calls? • Can we tell if Kafka is slow before users call? • What can developers do to get best performance? • How can developers and SREs work together to troubleshoot performance issues?

Strong Foundations Building a Kafka cluster from the hardware up

What’s Important To You? • Message Retention - Disk size • Message Throughput - Network capacity • Producer Performance - Disk I/O • Consumer Performance - Memory

Go Wide • RAIS - Redundant Array of Inexpensive Servers • Kafka is well-suited to horizontal scaling • Also helps with CPU utilization • Kafka needs to decompress and recompress every message batch • KIP-31 will help with this by eliminating recompression • Don’t co-locate Kafka

Disk Layout • RAID • Can survive a single disk failure (not RAID 0) • Provides the broker with a single log directory • Eats up disk I/O • JBOD • Gives Kafka all the disk I/O available • Broker is not smart about balancing partitions • If one disk fails, the entire broker stops • Amazon EBS performance works!

Operating System Tuning • Filesystem Options • EXT or XFS • Using unsafe mount options • Virtual Memory • Swappiness • Dirty Pages • Networking

Java • Only use JDK 8 now • Keep heap size small • Even our largest brokers use a 6 GB heap • Save the rest for page cache • Garbage Collection - G 1 all the way • Basic tuning only • Watch for humongous allocations

Monitoring the Foundation • CPU Load • Network inbound and outbound • Filehandle usage for Kafka • Disk • Free space - where you write logs, and where Kafka stores messages • Free inodes • I/O performance - at least average wait and percent utilization • Garbage Collection

Broker Ground Rules • Tuning • Stick (mostly) with the defaults • Set default cluster retention as appropriate • Default partition count should be at least the number of brokers • Monitoring • Watch the right things • Don’t try to alert on everything • Triage and Resolution • Solve problems, don’t mask them

Too Much Information! • Monitoring teams hate Kafka • Per-Topic metrics • Per-Partition metrics • Per-Client metrics • Capture as much as you can • Many metrics are useful while triaging an issue • Clients want metrics on their own topics • Only alert on what is needed to signal a problem

Broker Monitoring • Bytes In and Out, Messages In • Why not messages out? • Partitions • Count and Leader Count • Under Replicated and Offline • Threads • Network pool, Request pool • Max Dirty Percent • Requests • Rates and times - total, queue, local, and send

Topic Monitoring • Bytes In, Bytes Out • Messages In, Produce Rate, Produce Failure Rate • Fetch Rate, Fetch Failure Rate • Partition Bytes • Quota Throttling • Log End Offset • Why bother? • KIP-32 will make this unnecessary • Provide this to your customers for them to alert on

How To Have a Life Avoiding the 3 AM calls

All The Best Ops People. . . • Know more of what is happening than their customers

All The Best Ops People. . . • Know more of what is happening than their customers • Are proactive

All The Best Ops People. . . • Know more of what is happening than their customers • Are proactive • Fix bugs, not work around them

All The Best Ops People. . . • Know more of what is happening than their customers • Are proactive • Fix bugs, not work around them This applies to our developers too!

Anticipating Trouble • Trend cluster utilization and growth over time

Anticipating Trouble • Trend cluster utilization and growth over time • Use default configurations for quotas and retention to require customers to talk to you

Anticipating Trouble • Trend cluster utilization and growth over time • Use default configurations for quotas and retention to require customers to talk to you • Monitor request times • If you are able to develop a consistent baseline, this is early warning

Under Replicated Partitions • Count of number of partitions which are not fully replicated within the cluster • Also referred to as “replica lag” • Primary indicator of problems within the cluster

Broker Performance Checks • Are all the brokers in the cluster working? • Are the network interfaces saturated? • Reelect partition leaders • Rebalance partitions in the cluster • Spread out traffic more (increase partitions or brokers) • Is the CPU utilization high? (especially iowait) • Is another process competing for resources? • Look for a bad disk • Are you still running 0. 8? • Do you have really big messages?

Appropriately Sizing Topics • Many theories on how to do this correctly

Appropriately Sizing Topics • Many theories on how to do this correctly • The answer is “it depends”

Appropriately Sizing Topics • Many theories on how to do this correctly • The answer is “it depends” • Questions to answer • How many brokers do you have in the cluster? • How many consumers do you have? • Do you have specific partition requirements?

Appropriately Sizing Topics • Many theories on how to do this correctly • The answer is “it depends” • Questions to answer • How many brokers do you have in the cluster? • How many consumers do you have? • Do you have specific partition requirements? • Keeping partition sizes manageable

Appropriately Sizing Topics • Many theories on how to do this correctly • The answer is “it depends” • Questions to answer • How many brokers do you have in the cluster? • How many consumers do you have? • Do you have specific partition requirements? • Keeping partition sizes manageable • Multiple tiers makes this more interesting • Don’t have too many partitions

Kafka’s Fine, It’s a Client Problem

Kafka’s Fine, It’s a Client Problem • Even so, don’t just throw it over the fence

The Clients Because Todd only sees 50% of the picture

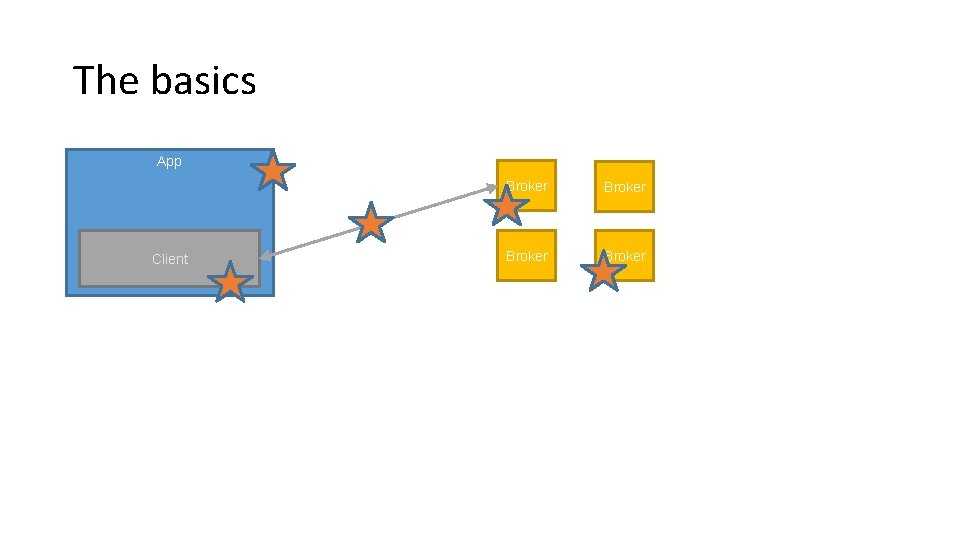
The basics App Client Broker

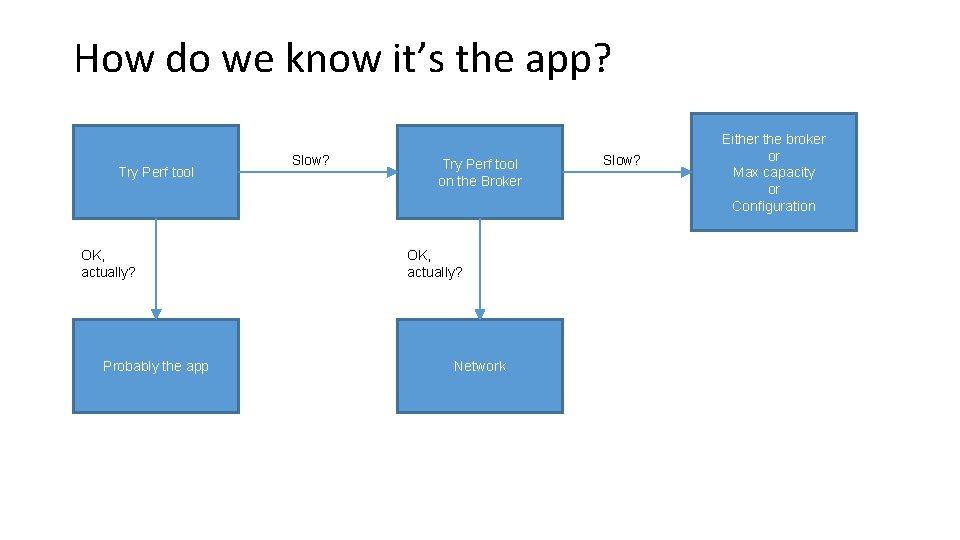
How do we know it’s the app? Try Perf tool OK, actually? Probably the app Slow? Try Perf tool on the Broker OK, actually? Network Slow? Either the broker or Max capacity or Configuration

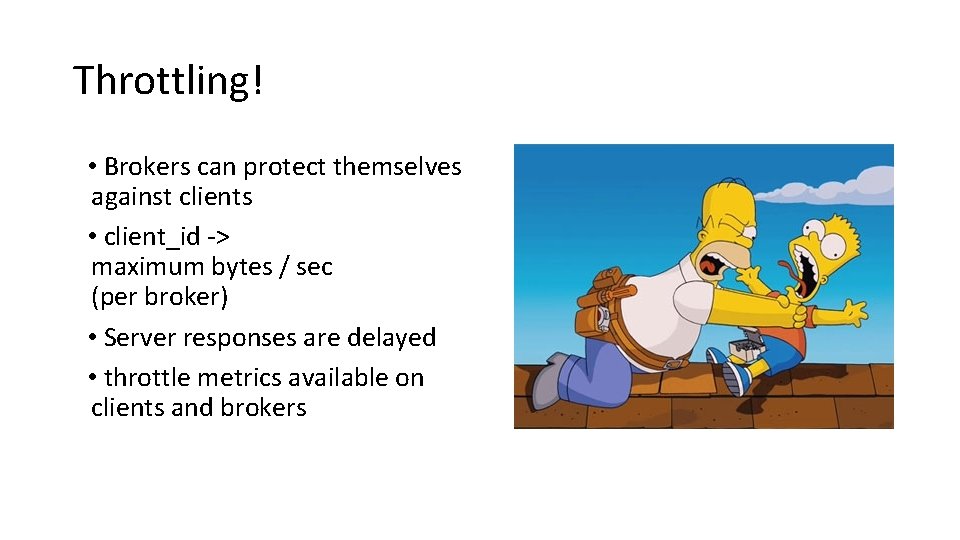
Throttling! • Brokers can protect themselves against clients • client_id -> maximum bytes / sec (per broker) • Server responses are delayed • throttle metrics available on clients and brokers

Producer

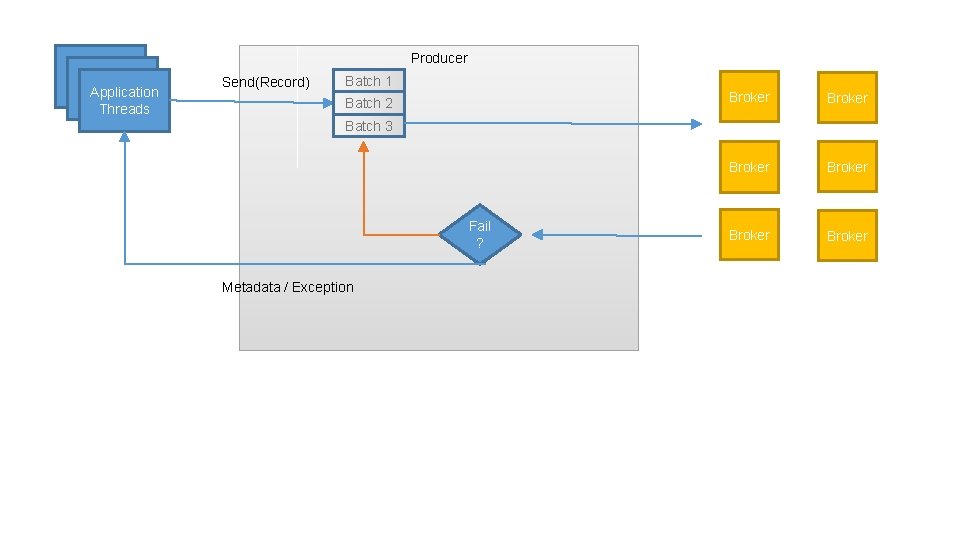
Producer Application Threads Send(Record) Batch 1 Batch 2 Broker Broker Batch 3 Fail ? Metadata / Exception

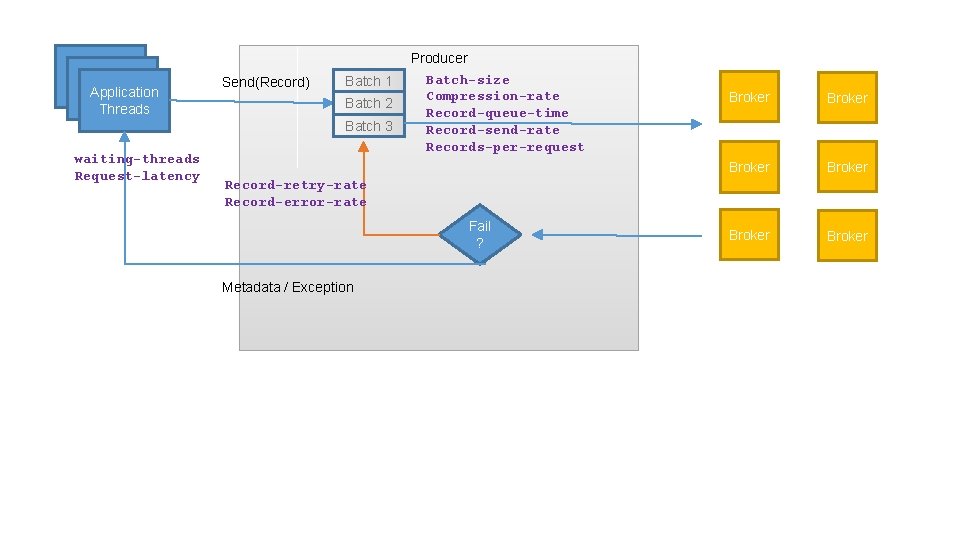
Application Threads Send(Record) Batch 1 Batch 2 Batch 3 waiting-threads Request-latency Producer Batch-size Compression-rate Record-queue-time Record-send-rate Records-per-request Broker Broker Record-retry-rate Record-error-rate Fail ? Metadata / Exception

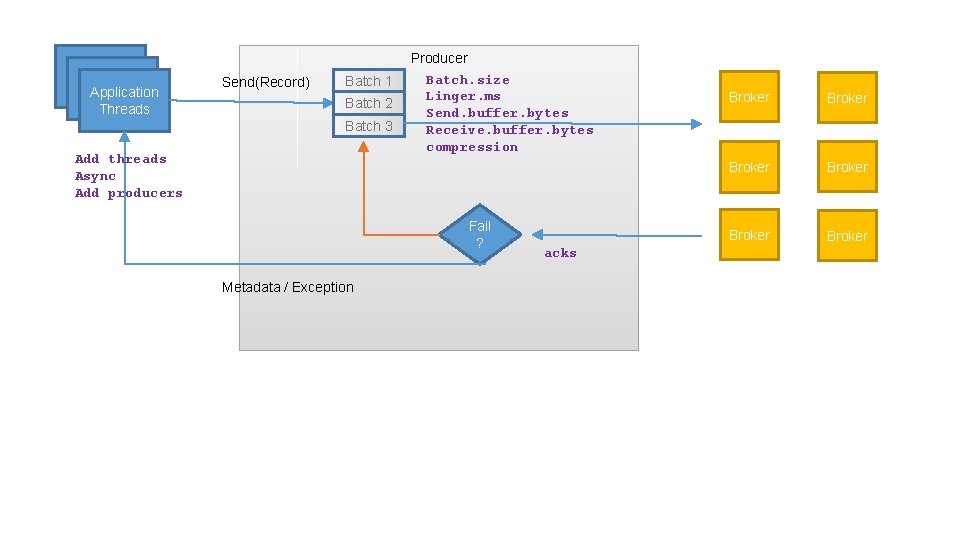
Application Threads Send(Record) Batch 1 Batch 2 Batch 3 Add threads Async Add producers Producer Batch. size Linger. ms Send. buffer. bytes Receive. buffer. bytes compression Fail ? Metadata / Exception acks Broker Broker

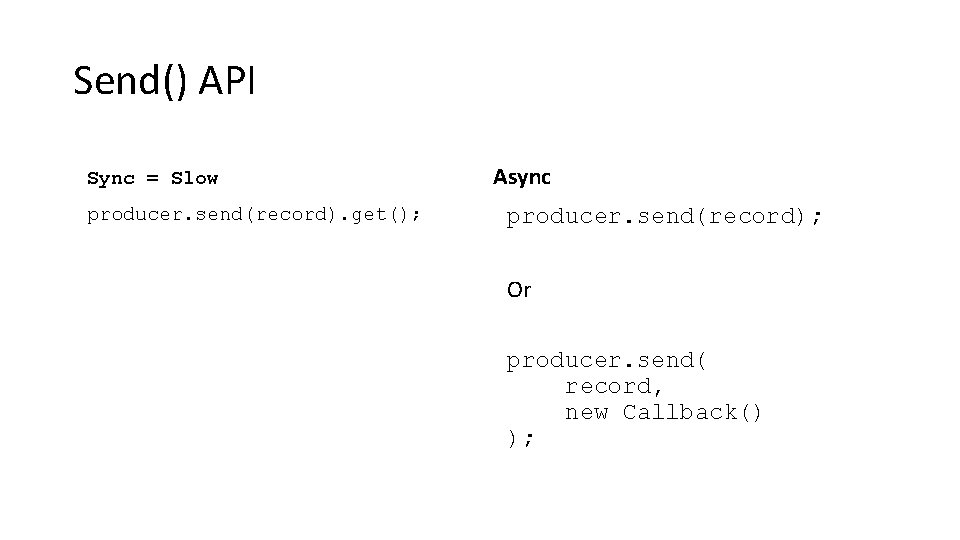
Send() API Sync = Slow producer. send(record). get(); Async producer. send(record); Or producer. send( record, new Callback() );

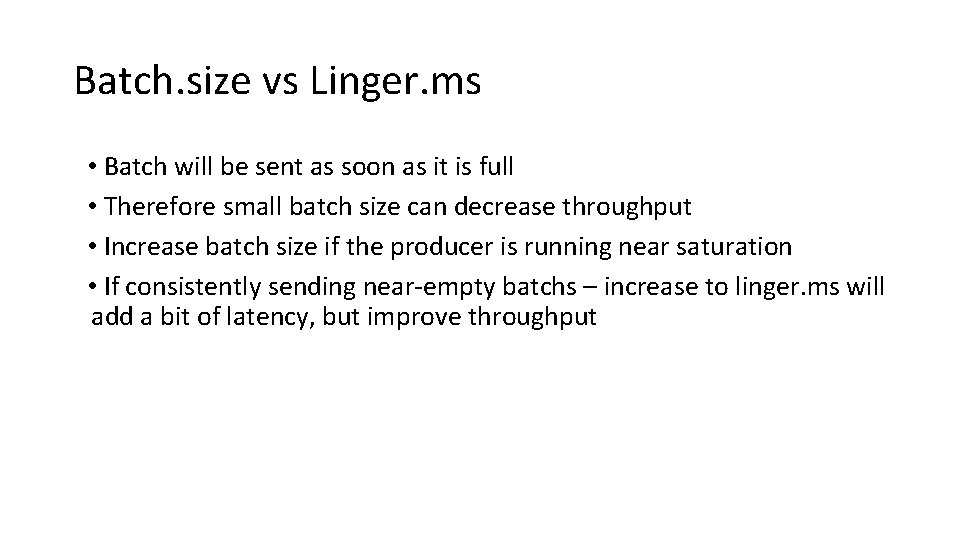
Batch. size vs Linger. ms • Batch will be sent as soon as it is full • Therefore small batch size can decrease throughput • Increase batch size if the producer is running near saturation • If consistently sending near-empty batchs – increase to linger. ms will add a bit of latency, but improve throughput

Consumer

My Consumer is not just slow – it is hanging! • There are no messages available (try perf consumer) • Next message is too large • Perpetual rebalance • Not polling enough • Multiple consumers in same group in same thread

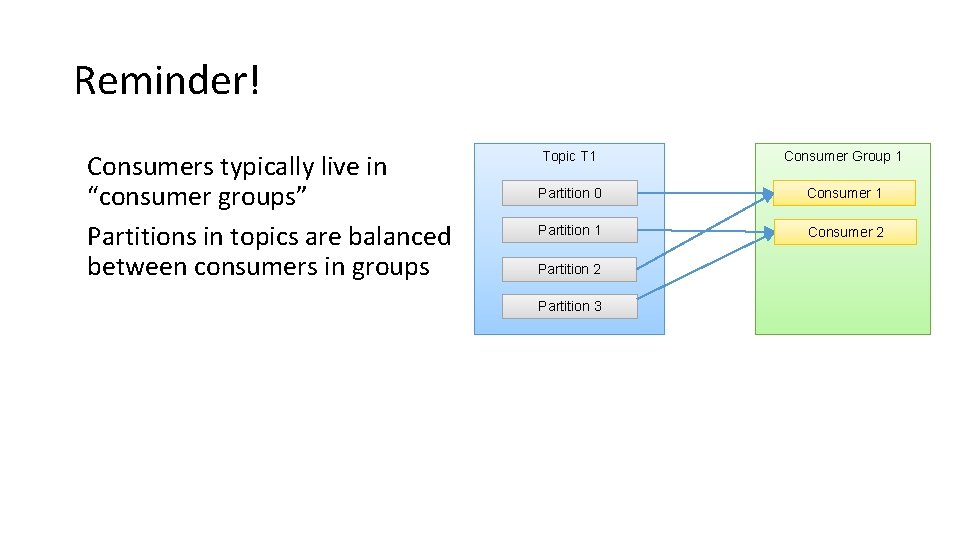
Reminder! Consumers typically live in “consumer groups” Partitions in topics are balanced between consumers in groups Topic T 1 Consumer Group 1 Partition 0 Consumer 1 Partition 1 Consumer 2 Partition 3

Rebalances are the consumer performance killer Consumers must keep polling Or they die. When consumers die, the group rebalances. When the group rebalances, it does not consume.

Min. fetch. bytes vs. max. wait • What if the topic doesn’t have much data? • “Are we there yet? ” “and now? ” • Reduce load on broker by letting fetch requests wait a bit for data • Add latency to increase throughput • Careful! Don’t fetch more than you can process!

Commits take time • Commit less often • Commit async

Add partitions • Consumer throughput is often limited by target • i. e. you can only write to HDFS so fast (and it aint fast) • My SLA is 1 GB/s but single-client HDFS writes are 20 MB/s • If each consumer writes to HDFS – you need 50 consumers • Which means you need 50 partitions • Except sometimes adding partitions is a bitch • So do the math first

I need to get data from Dallas to AWS • Put the consumer far from Kafka • Because failure to pull data is safer than failure to push • Tune network parameters in Client, Kafka and both OS • Send buffer -> bandwidth X delay • Receive buffer • Fetch. min. bytes This will maximize use of bandwidth. Note that cheap AWS nodes have low bandwidth

Monitor • records-lag-max • Burrow is useful here • fetch-rate • fetch-latency • records-per-request / bytes-per-request Apologies on behalf of Kafka community. We forgot to document metrics for the new consumer

Wrapping Up

One Ecosystem • Kafka can scale to millions of messages per second, and more • Operations must scale the cluster appropriately • Developers must use the right tuning and go parallel

One Ecosystem • Kafka can scale to millions of messages per second, and more • Operations must scale the cluster appropriately • Developers must use the right tuning and go parallel • Few problems are owned by only one side • Expanding partitions often requires coordination • Applications that need higher reliability drive cluster configurations

One Ecosystem • Kafka can scale to millions of messages per second, and more • Operations must scale the cluster appropriately • Developers must use the right tuning and go parallel • Few problems are owned by only one side • Expanding partitions often requires coordination • Applications that need higher reliability drive cluster configurations • Either we work together, or we fail separately

Would You Like to Know More? • Kafka Summit is April 26 th in San Francisco • • Reliability guarantees in Kafka (Gwen) Some "Kafkaesque" Days in Operations (Joel Koshy) More Datacenters, More Problems (Todd) Many more talks. . . • Apache. Con Big Data is May 9 - 12 in Vancouver • Streaming Data Integration at Scale (Ewen Cheslack-Postava) • Kafka at Peak Performance (Todd) • Building a Self-Serve Kafka Ecosystem (Joel Koshy)

Rebalances are the consumer performance killer

Appendix More Information for later

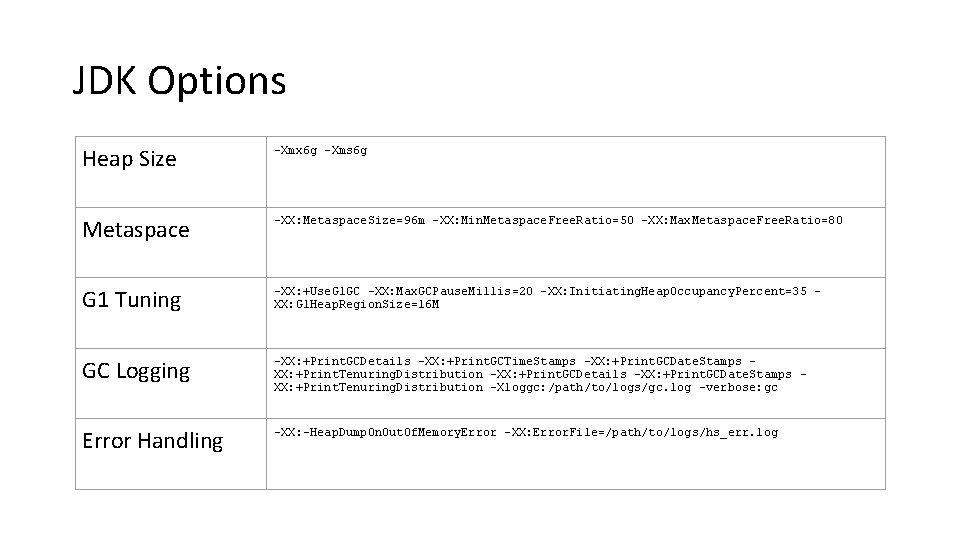
JDK Options Heap Size -Xmx 6 g -Xms 6 g Metaspace -XX: Metaspace. Size=96 m -XX: Min. Metaspace. Free. Ratio=50 -XX: Max. Metaspace. Free. Ratio=80 G 1 Tuning -XX: +Use. G 1 GC -XX: Max. GCPause. Millis=20 -XX: Initiating. Heap. Occupancy. Percent=35 XX: G 1 Heap. Region. Size=16 M GC Logging -XX: +Print. GCDetails -XX: +Print. GCTime. Stamps -XX: +Print. GCDate. Stamps XX: +Print. Tenuring. Distribution -XX: +Print. GCDetails -XX: +Print. GCDate. Stamps XX: +Print. Tenuring. Distribution -Xloggc: /path/to/logs/gc. log -verbose: gc Error Handling -XX: -Heap. Dump. On. Out. Of. Memory. Error -XX: Error. File=/path/to/logs/hs_err. log

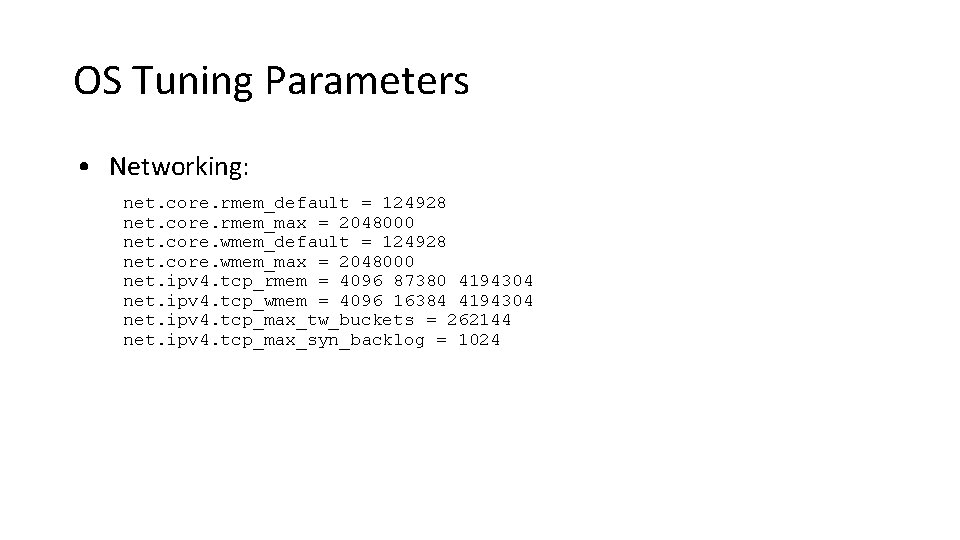
OS Tuning Parameters • Networking: net. core. rmem_default = 124928 net. core. rmem_max = 2048000 net. core. wmem_default = 124928 net. core. wmem_max = 2048000 net. ipv 4. tcp_rmem = 4096 87380 4194304 net. ipv 4. tcp_wmem = 4096 16384 4194304 net. ipv 4. tcp_max_tw_buckets = 262144 net. ipv 4. tcp_max_syn_backlog = 1024

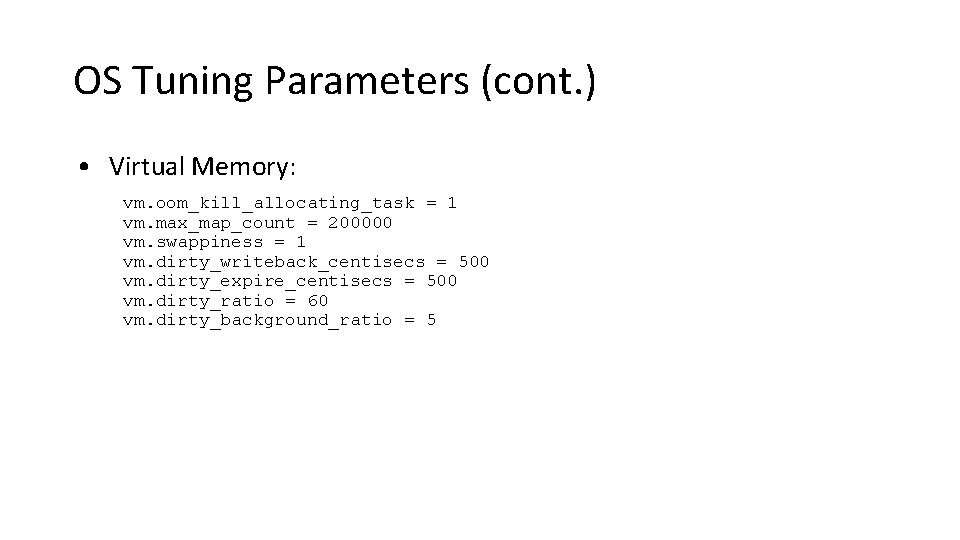
OS Tuning Parameters (cont. ) • Virtual Memory: vm. oom_kill_allocating_task = 1 vm. max_map_count = 200000 vm. swappiness = 1 vm. dirty_writeback_centisecs = 500 vm. dirty_expire_centisecs = 500 vm. dirty_ratio = 60 vm. dirty_background_ratio = 5

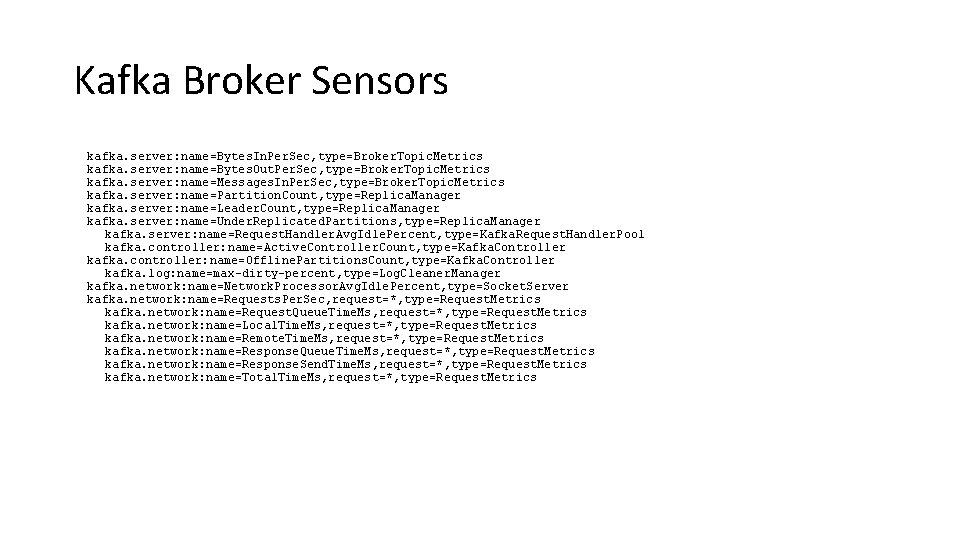
Kafka Broker Sensors kafka. server: name=Bytes. In. Per. Sec, type=Broker. Topic. Metrics kafka. server: name=Bytes. Out. Per. Sec, type=Broker. Topic. Metrics kafka. server: name=Messages. In. Per. Sec, type=Broker. Topic. Metrics kafka. server: name=Partition. Count, type=Replica. Manager kafka. server: name=Leader. Count, type=Replica. Manager kafka. server: name=Under. Replicated. Partitions, type=Replica. Manager kafka. server: name=Request. Handler. Avg. Idle. Percent, type=Kafka. Request. Handler. Pool kafka. controller: name=Active. Controller. Count, type=Kafka. Controller kafka. controller: name=Offline. Partitions. Count, type=Kafka. Controller kafka. log: name=max-dirty-percent, type=Log. Cleaner. Manager kafka. network: name=Network. Processor. Avg. Idle. Percent, type=Socket. Server kafka. network: name=Requests. Per. Sec, request=*, type=Request. Metrics kafka. network: name=Request. Queue. Time. Ms, request=*, type=Request. Metrics kafka. network: name=Local. Time. Ms, request=*, type=Request. Metrics kafka. network: name=Remote. Time. Ms, request=*, type=Request. Metrics kafka. network: name=Response. Queue. Time. Ms, request=*, type=Request. Metrics kafka. network: name=Response. Send. Time. Ms, request=*, type=Request. Metrics kafka. network: name=Total. Time. Ms, request=*, type=Request. Metrics

Kafka Broker Sensors - Topics kafka. server: name=Bytes. In. Per. Sec, type=Broker. Topic. Metrics, topics=* kafka. server: name=Bytes. Out. Per. Sec, type=Broker. Topic. Metrics, topics=* kafka. server: name=Messages. In. Per. Sec, type=Broker. Topic. Metrics, topics=* kafka. server: name=Total. Produce. Requests. Per. Sec, type=Broker. Topic. Metrics, topic=* kafka. server: name=Failed. Produce. Requests. Per. Sec, type=Broker. Topic. Metrics, topic=* kafka. server: name=Total. Fetch. Requests. Per. Sec, type=Broker. Topic. Metrics, topic=* kafka. server: name=Failed. Fetch. Requests. Per. Sec, type=Broker. Topic. Metrics, topic=* kafka. log: type=Log, name=Log. End. Offset, topic=*, partition=*