Performance Analysis of the NGST Yardstick Concept via
- Slides: 33
Performance Analysis of the NGST “Yardstick” Concept via Integrated Modeling Gary Mosier, Keith Parrish, Michael Femiano NASA Goddard Space Flight Center David Redding, Andrew Kissil, Miltiadis Papalexandris Jet Propulsion Laboratory Larry Craig, Tim Page, Richard Shunk NASA Marshall Space Flight Center August 2000 1
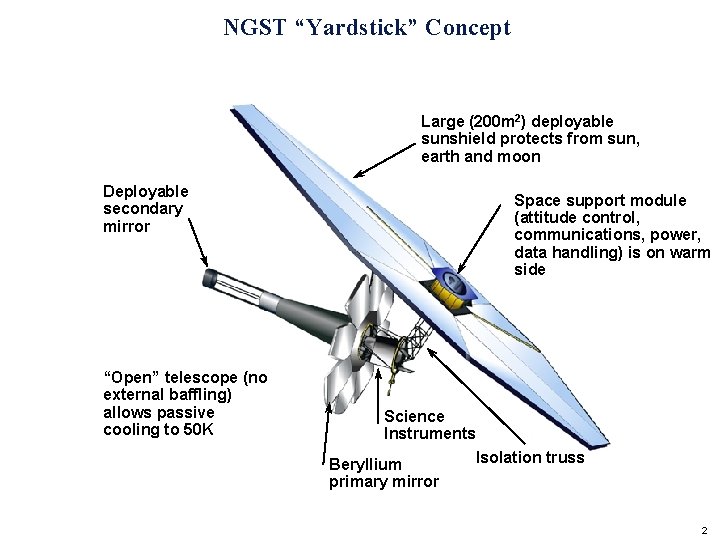
NGST “Yardstick” Concept Large (200 m 2) deployable sunshield protects from sun, earth and moon Deployable secondary mirror “Open” telescope (no external baffling) allows passive cooling to 50 K Space support module (attitude control, communications, power, data handling) is on warm side Science Instruments Beryllium primary mirror Isolation truss 2
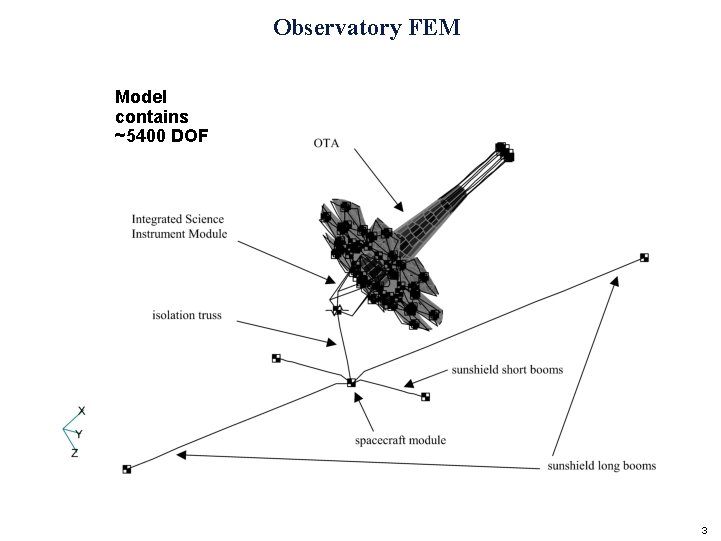
Observatory FEM Model contains ~5400 DOF 3
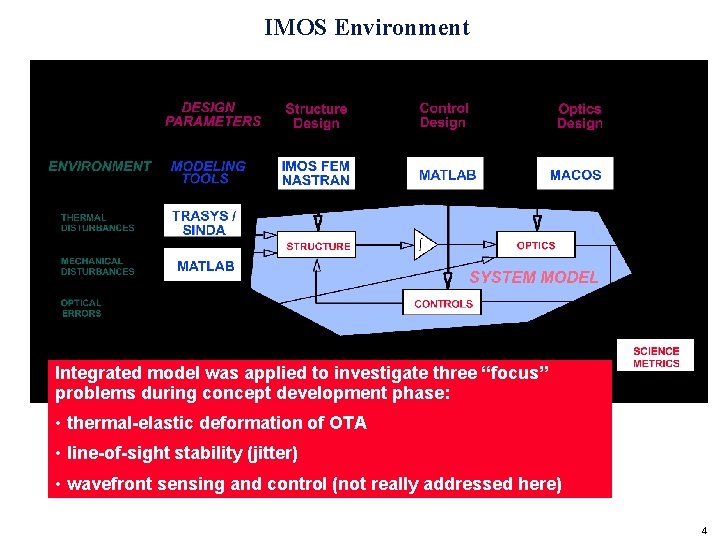
IMOS Environment Integrated model was applied to investigate three “focus” problems during concept development phase: • thermal-elastic deformation of OTA • line-of-sight stability (jitter) • wavefront sensing and control (not really addressed here) 4
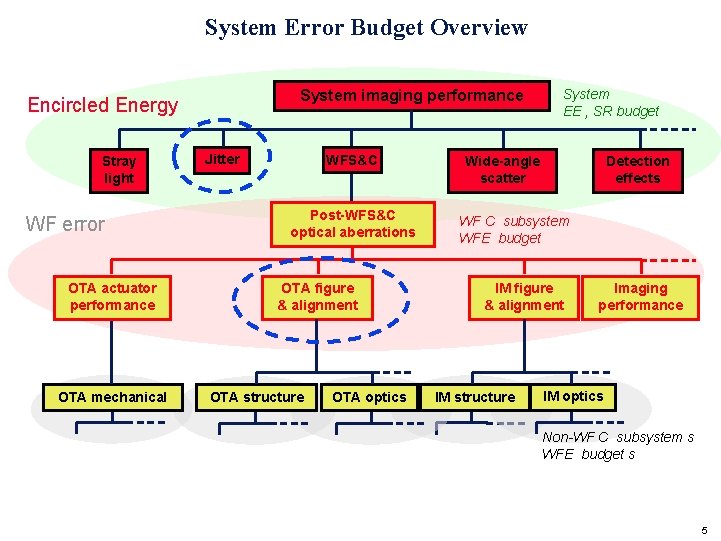
System Error Budget Overview System imaging performance Encircled Energy Stray light WF error OTA actuator performance OTA mechanical Jitter WFS&C Post-WFS&C optical aberrations OTA figure & alignment OTA structure OTA optics System EE , SR budget Wide-angle scatter Detection effects WF C subsystem WFE budget IM figure & alignment IM structure Imaging performance IM optics Non-WF C subsystem s WFE budget s 5
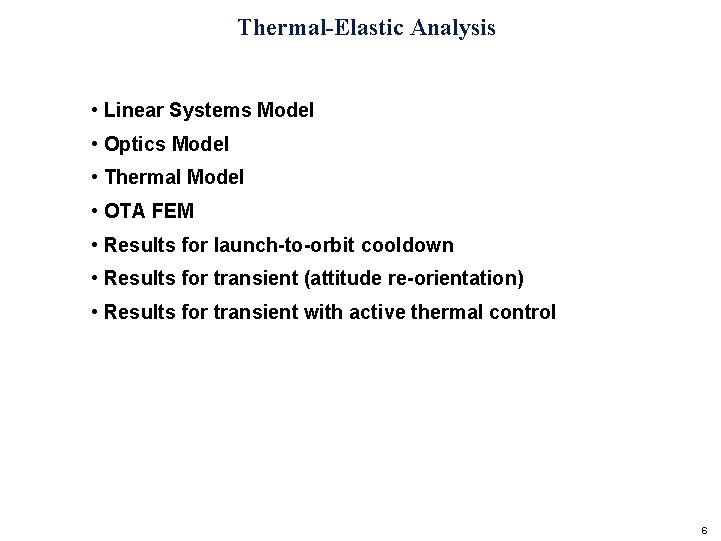
Thermal-Elastic Analysis • Linear Systems Model • Optics Model • Thermal Model • OTA FEM • Results for launch-to-orbit cooldown • Results for transient (attitude re-orientation) • Results for transient with active thermal control 6
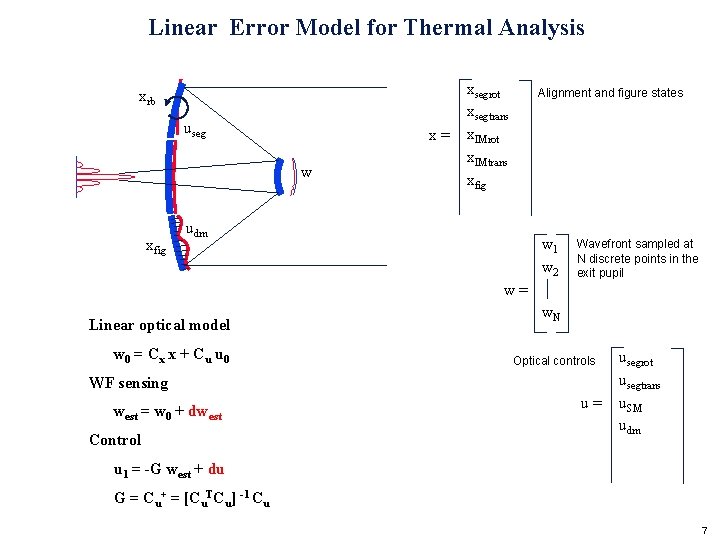
Linear Error Model for Thermal Analysis xrb useg w xfig xsegrot xsegtrans x = x. IMrot x. IMtrans xfig Alignment and figure states udm w 1 w 2 Wavefront sampled at N discrete points in the exit pupil w = Linear optical model w 0 = Cx x + C u u 0 WF sensing west = w 0 + dwest Control w. N usegrot usegtrans u = u. SM udm Optical controls u 1 = -G west + du G = Cu+ = [Cu. TCu] -1 Cu 7
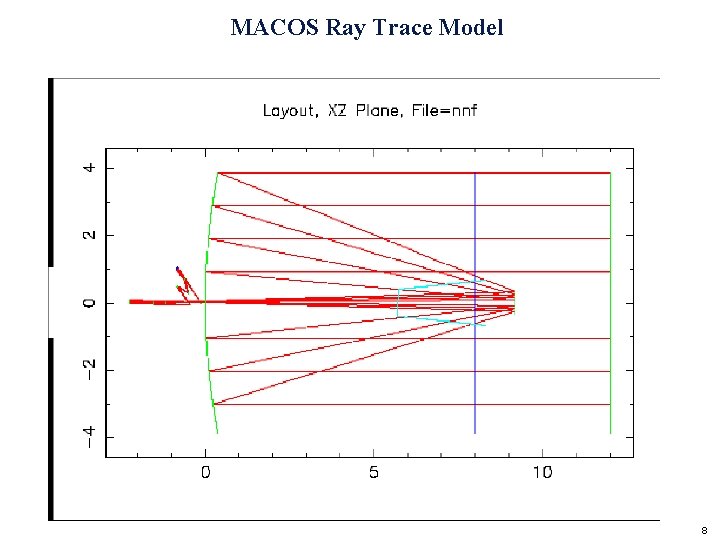
MACOS Ray Trace Model 8
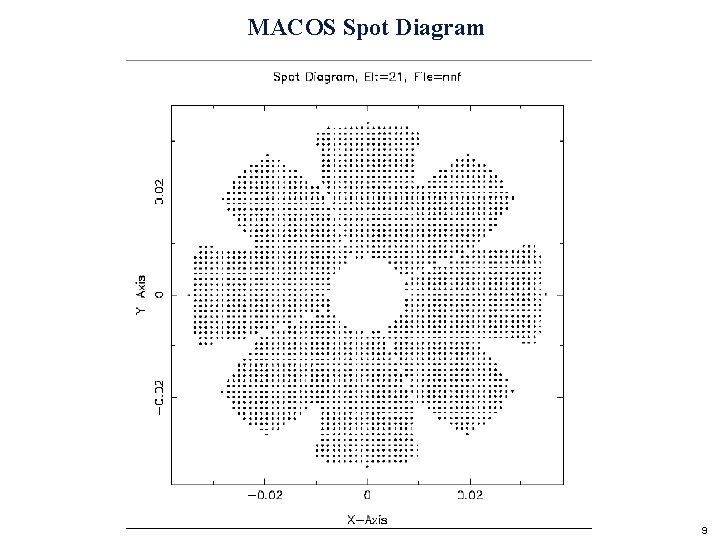
MACOS Spot Diagram 9
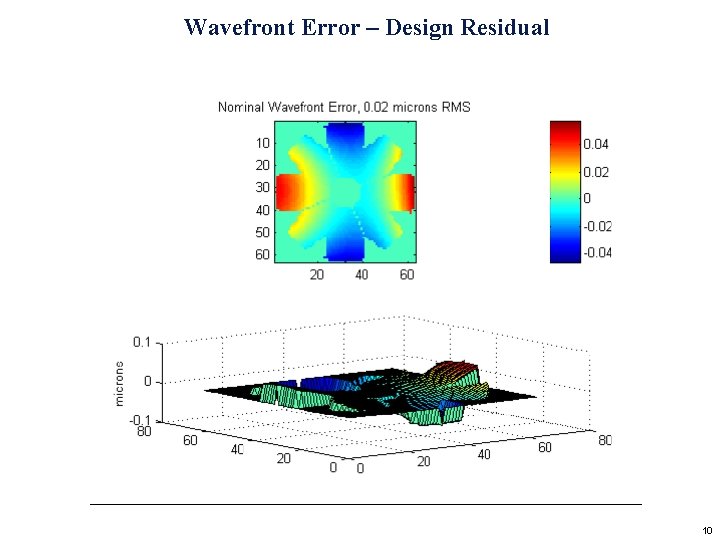
Wavefront Error – Design Residual 10
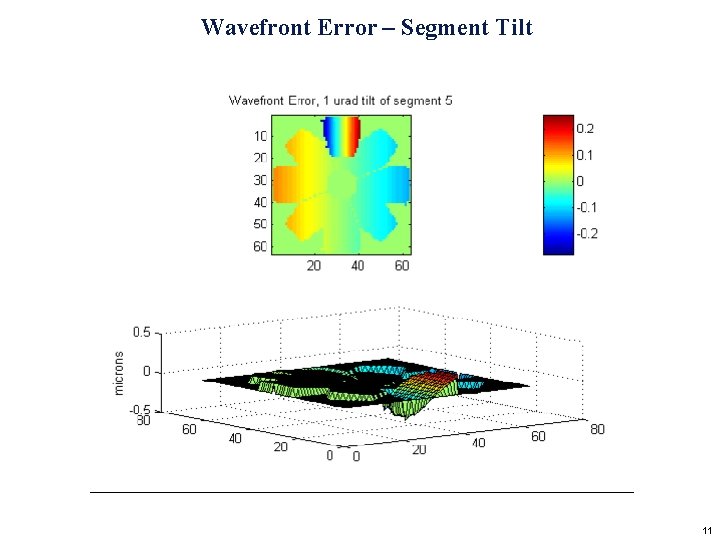
Wavefront Error – Segment Tilt 11
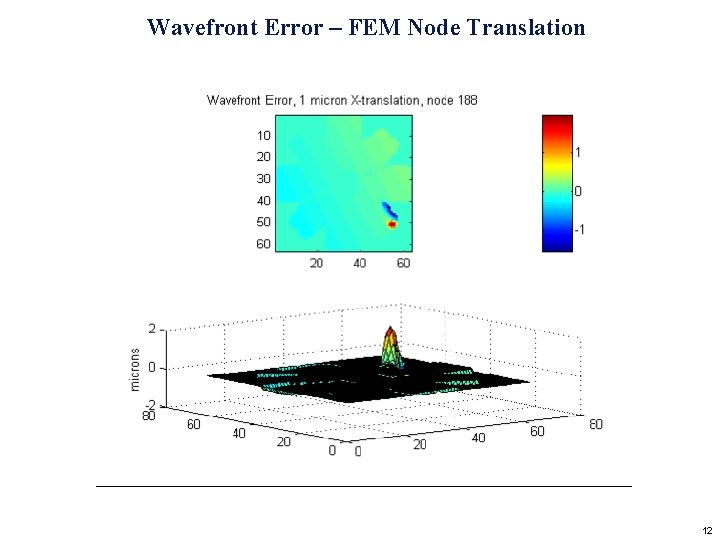
Wavefront Error – FEM Node Translation 12
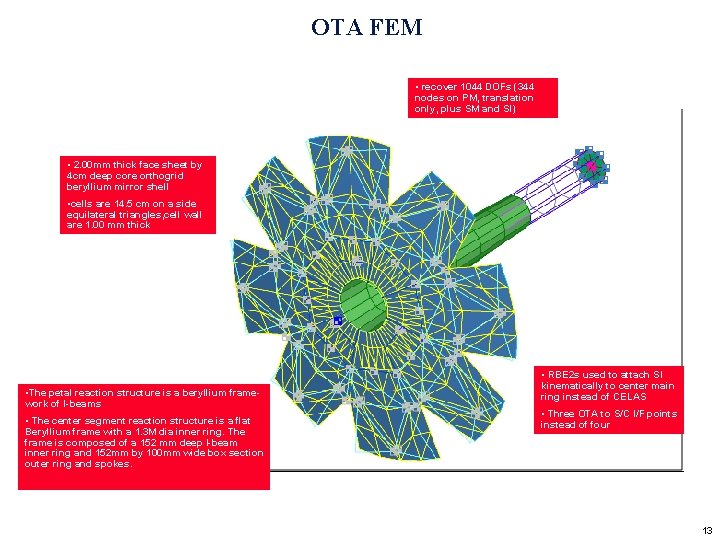
OTA FEM • recover 1044 DOFs (344 nodes on PM, translation only, plus SM and SI) • 2. 00 mm thick face sheet by 4 cm deep core orthogrid beryllium mirror shell • cells are 14. 5 cm on a side equilateral triangles, cell wall are 1. 00 mm thick • The petal reaction structure is a beryllium framework of I-beams • The center segment reaction structure is a flat Beryllium frame with a 1. 3 M dia inner ring. The frame is composed of a 152 mm deep I-beam inner ring and 152 mm by 100 mm wide box section outer ring and spokes. • RBE 2 s used to attach SI kinematically to center main ring instead of CELAS • Three OTA to S/C I/F points instead of four 13
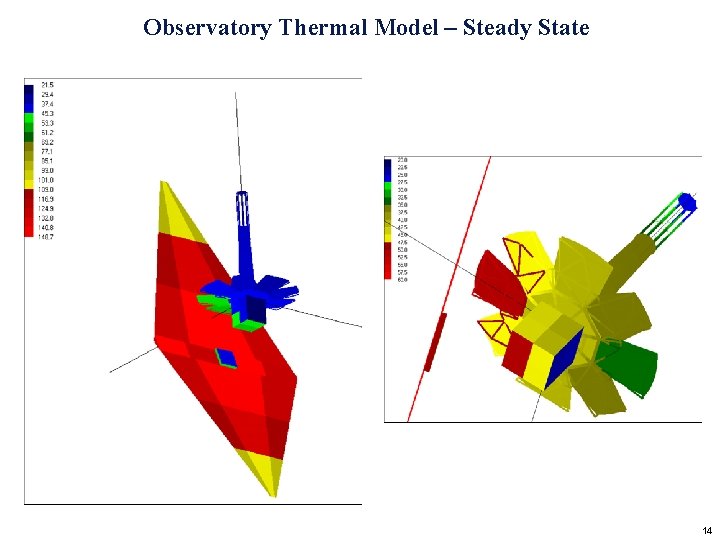
Observatory Thermal Model – Steady State 14
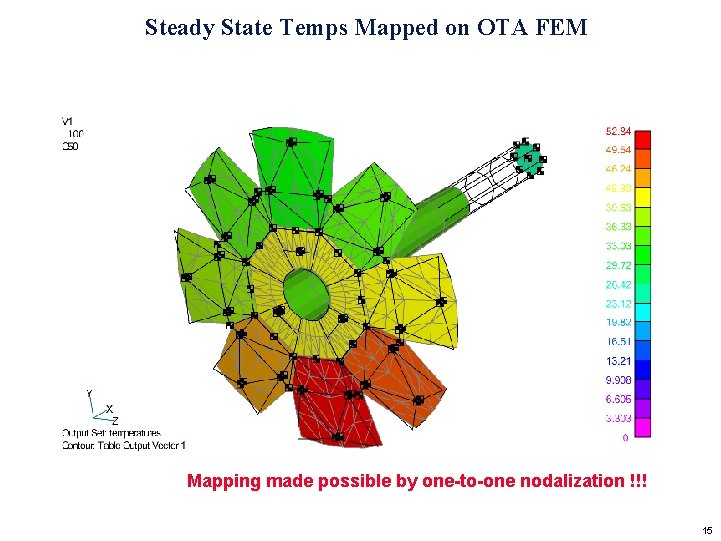
Steady State Temps Mapped on OTA FEM Mapping made possible by one-to-one nodalization !!! 15
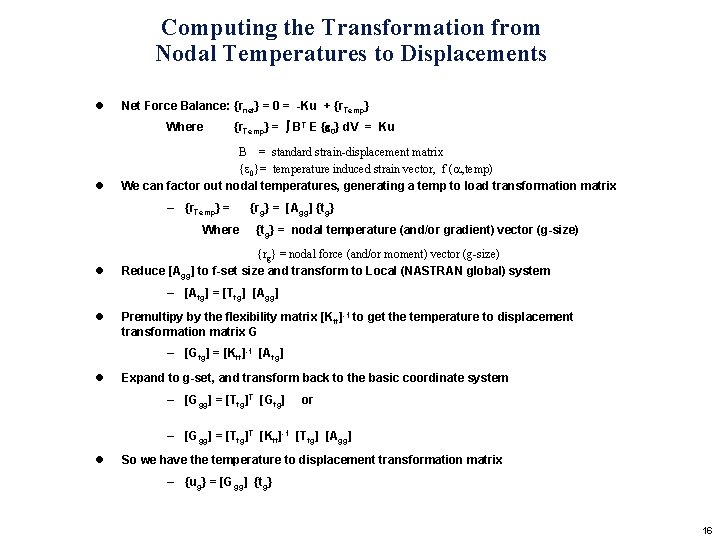
Computing the Transformation from Nodal Temperatures to Displacements l Net Force Balance: {rnet} = 0 = -Ku + {r. Temp} Where l {r. Temp} = BT E { 0} d. V = Ku B = standard strain-displacement matrix { 0}= temperature induced strain vector, f ( , temp) We can factor out nodal temperatures, generating a temp to load transformation matrix – {r. Temp} = Where l {rg} = [Agg] {tg} = nodal temperature (and/or gradient) vector (g-size) {rg} = nodal force (and/or moment) vector (g-size) Reduce [Agg] to f-set size and transform to Local (NASTRAN global) system – [Afg] = [Tfg] [Agg] l Premultipy by the flexibility matrix [Kff]-1 to get the temperature to displacement transformation matrix G – [Gfg] = [Kff]-1 [Afg] l Expand to g-set, and transform back to the basic coordinate system – [Ggg] = [Tfg]T [Gfg] or – [Ggg] = [Tfg]T [Kff]-1 [Tfg] [Agg] l So we have the temperature to displacement transformation matrix – {ug} = [Ggg] {tg} 16
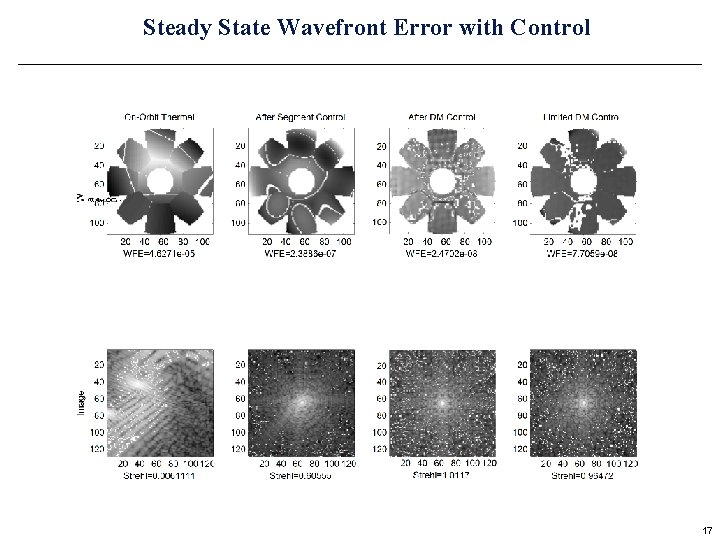
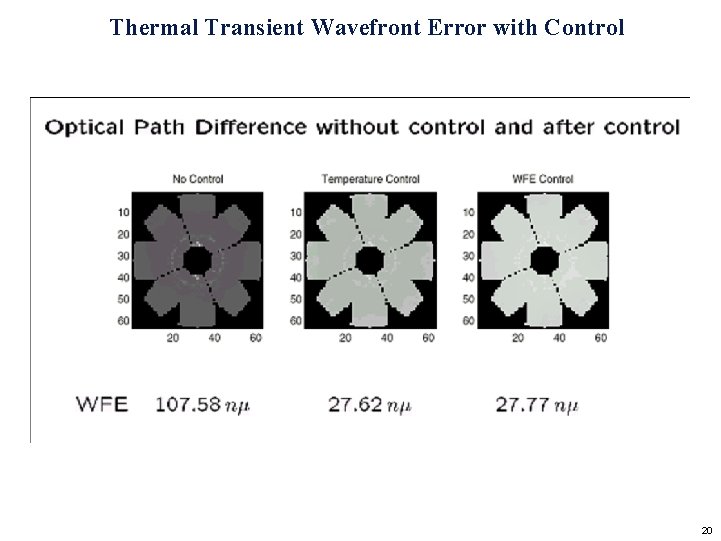
Steady State Wavefront Error with Control 17
Thermal Transient following 22. 5 degree slew • Initial attitude has sun normal to sunshield • Final attitude is 22. 5 degree pitch away from sun • Thermal equilibrium takes DAYS to reach Cold Petal (space-side) DT = -0. 8 K Hot Petal (sun-side) DT = -1. 3 K 18
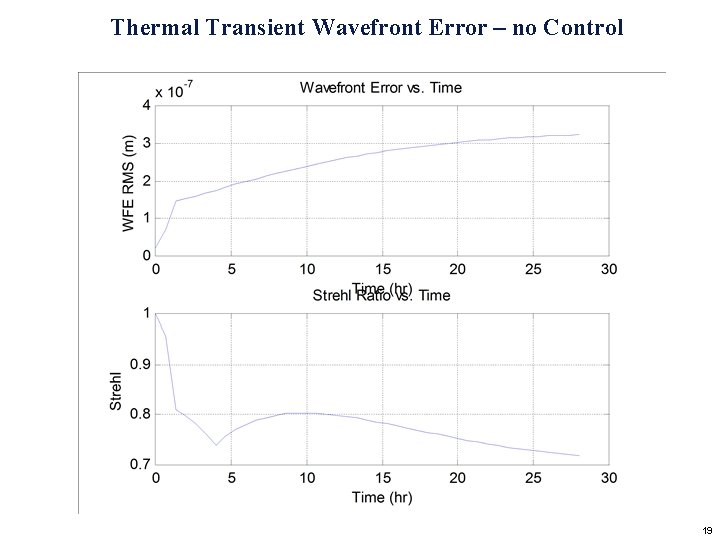
Thermal Transient Wavefront Error – no Control 19
Thermal Transient Wavefront Error with Control 20
Jitter Analysis • Pointing Control Architecture • Linear Systems Model • Disturbance Model • Compensation Model • Results for parametric studies 21
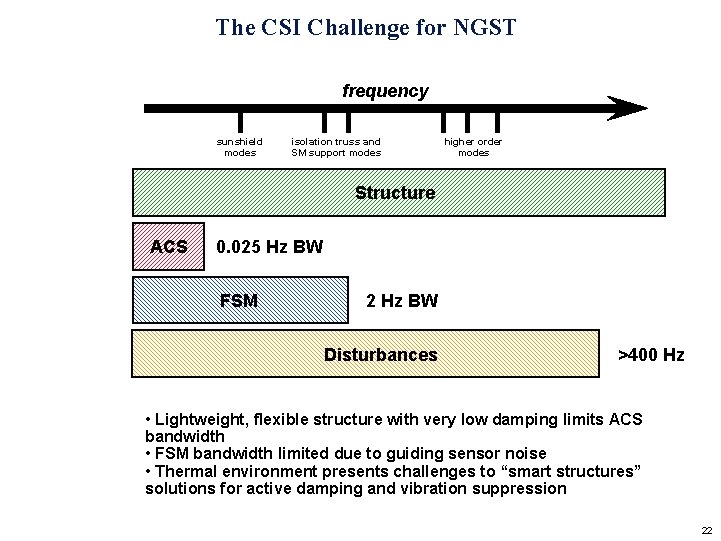
The CSI Challenge for NGST frequency sunshield modes isolation truss and SM support modes higher order modes Structure ACS 0. 025 Hz BW FSM 2 Hz BW Disturbances >400 Hz • Lightweight, flexible structure with very low damping limits ACS bandwidth • FSM bandwidth limited due to guiding sensor noise • Thermal environment presents challenges to “smart structures” solutions for active damping and vibration suppression 22
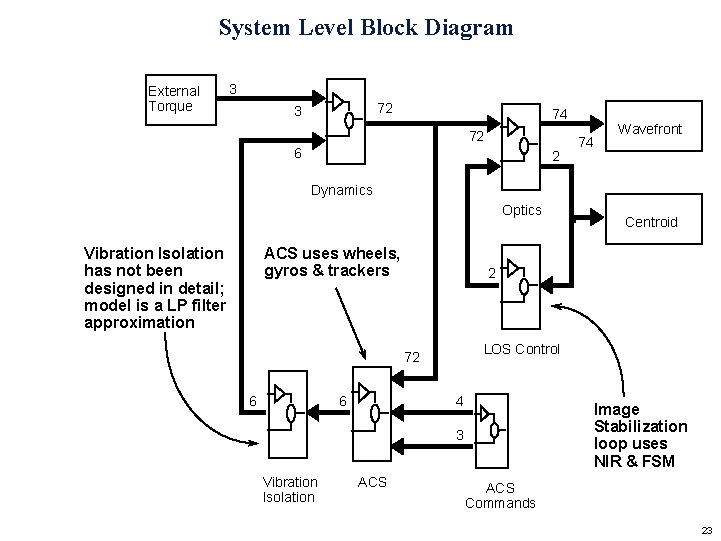
System Level Block Diagram External Torque 3 72 3 74 72 6 2 74 Wavefront Dynamics Optics Vibration Isolation has not been designed in detail; model is a LP filter approximation ACS uses wheels, gyros & trackers 2 LOS Control 72 6 6 4 Image Stabilization loop uses NIR & FSM 3 Vibration Isolation ACS Centroid ACS Commands 23
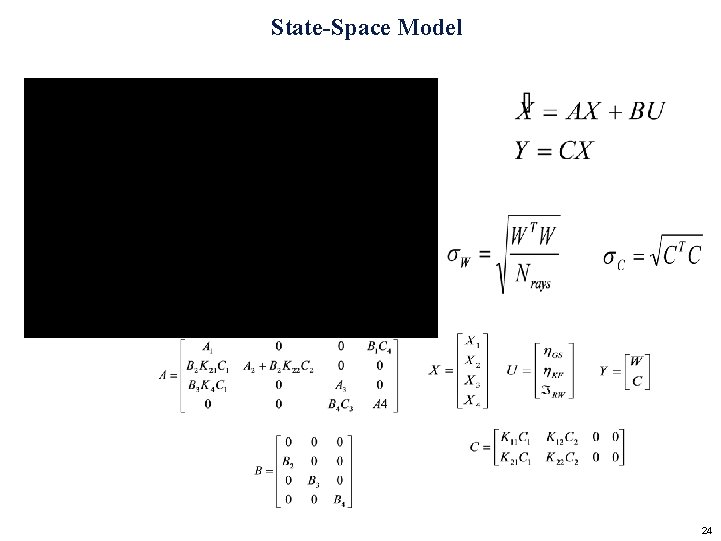
State-Space Model 24
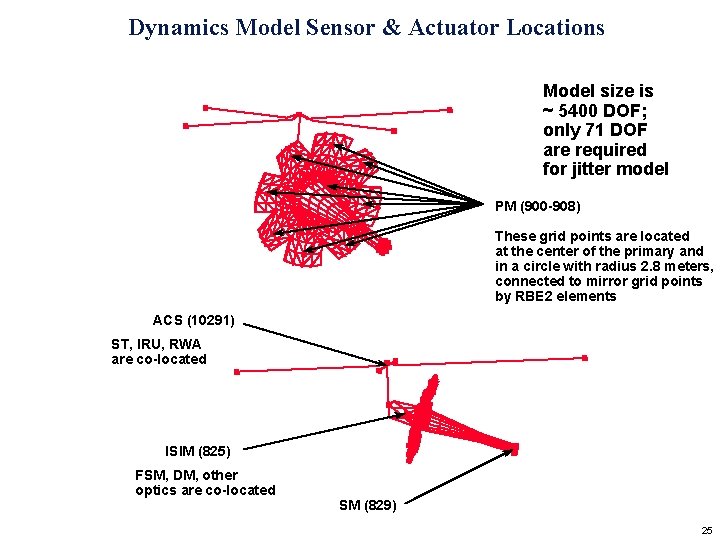
Dynamics Model Sensor & Actuator Locations Model size is ~ 5400 DOF; only 71 DOF are required for jitter model PM (900 -908) These grid points are located at the center of the primary and in a circle with radius 2. 8 meters, connected to mirror grid points by RBE 2 elements ACS (10291) ST, IRU, RWA are co-located ISIM (825) FSM, DM, other optics are co-located SM (829) 25
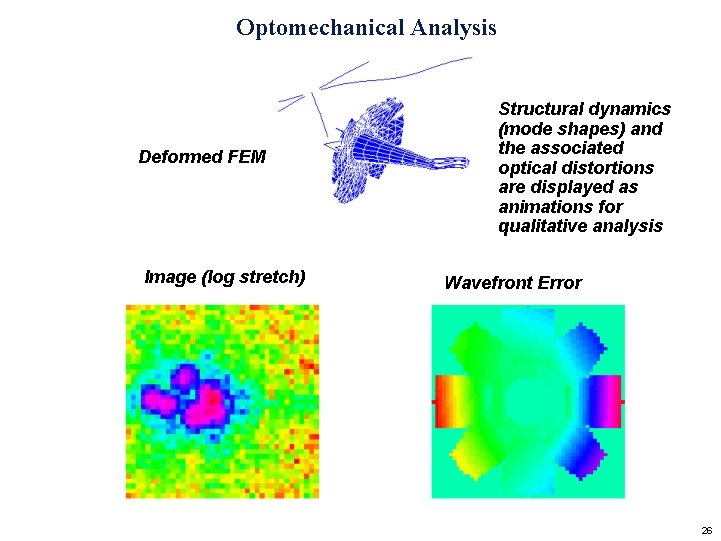
Optomechanical Analysis Deformed FEM Image (log stretch) Structural dynamics (mode shapes) and the associated optical distortions are displayed as animations for qualitative analysis Wavefront Error 26
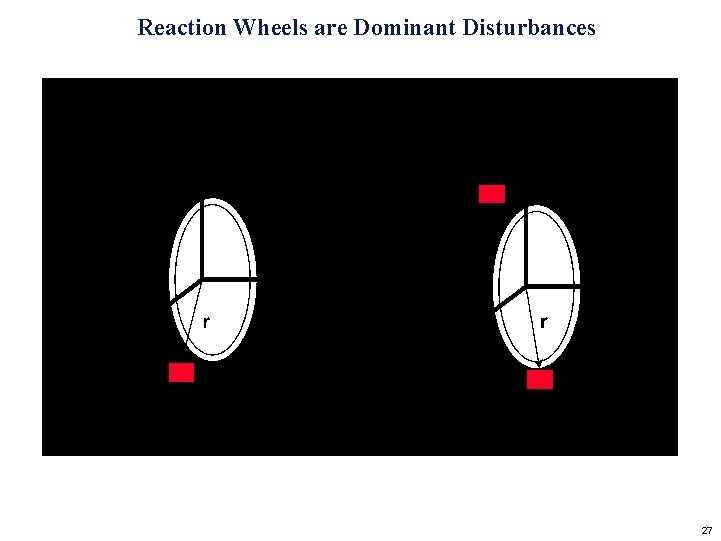
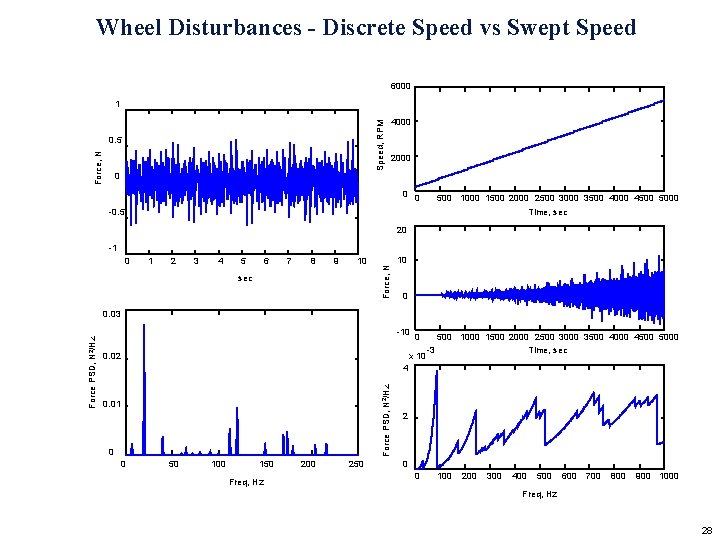
Reaction Wheels are Dominant Disturbances 27
Wheel Disturbances - Discrete Speed vs Swept Speed 6000 Speed, RPM 1 Force, N 0. 5 4000 2000 0 500 1000 1500 2000 2500 3000 3500 4000 4500 5000 -0. 5 Time, sec 20 0 1 2 3 4 5 6 7 8 9 10 sec Force, N -1 10 0 -10 0. 02 0 x 10 500 1000 1500 2000 2500 3000 3500 4000 4500 5000 -3 Time, sec 4 Force PSD, N 2/Hz 0. 03 0. 01 0 0 50 100 150 Freq, Hz 200 250 2 0 0 100 200 300 400 500 600 700 800 900 1000 Freq, Hz 28
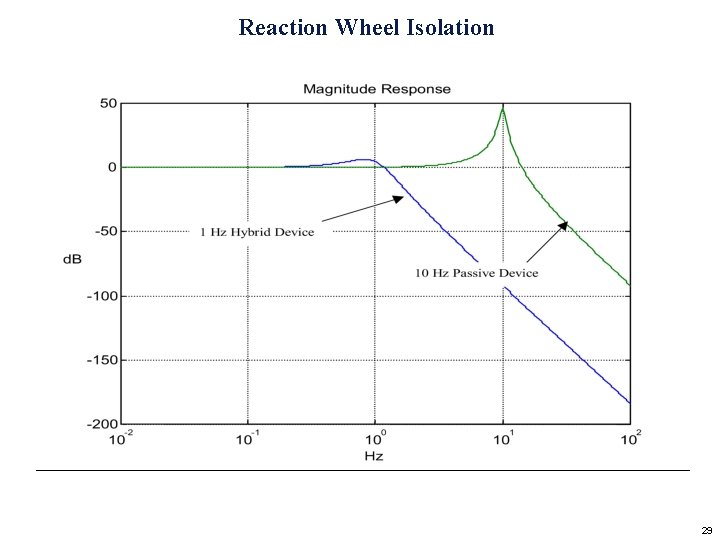
Reaction Wheel Isolation 29
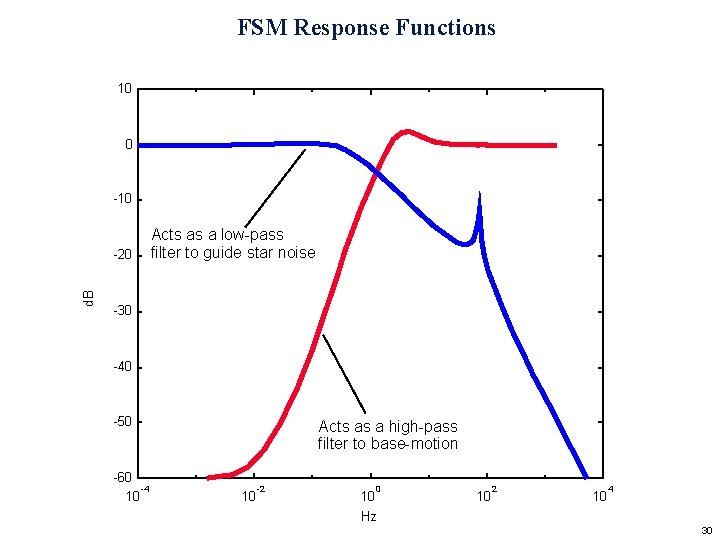
FSM Response Functions 10 0 -10 d. B -20 Acts as a low-pass filter to guide star noise -30 -40 -50 -60 -4 10 Acts as a high-pass filter to base-motion 10 -2 0 10 Hz 10 2 10 4 30
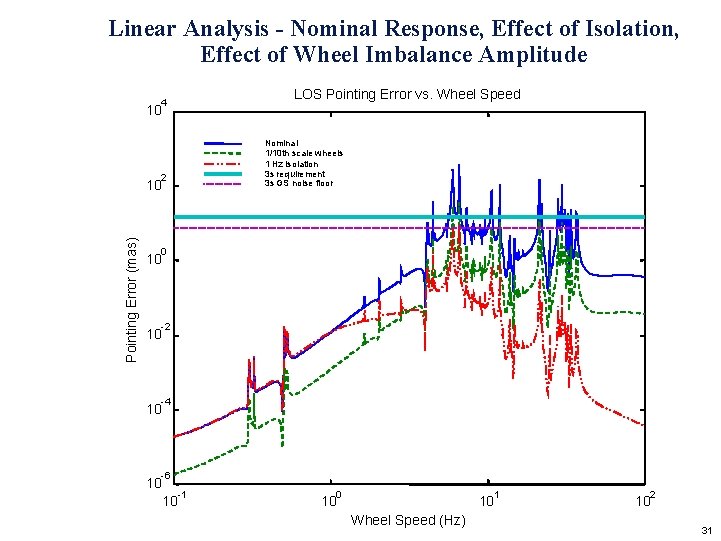
Linear Analysis - Nominal Response, Effect of Isolation, Effect of Wheel Imbalance Amplitude LOS Pointing Error vs. Wheel Speed 4 10 Nominal 1/10 th scale wheels 1 Hz isolation 3 s requirement 3 s GS noise floor 2 Pointing Error (mas) 10 0 10 -2 10 -4 10 -6 10 -1 10 0 1 10 10 Wheel Speed (Hz) 2 10 31
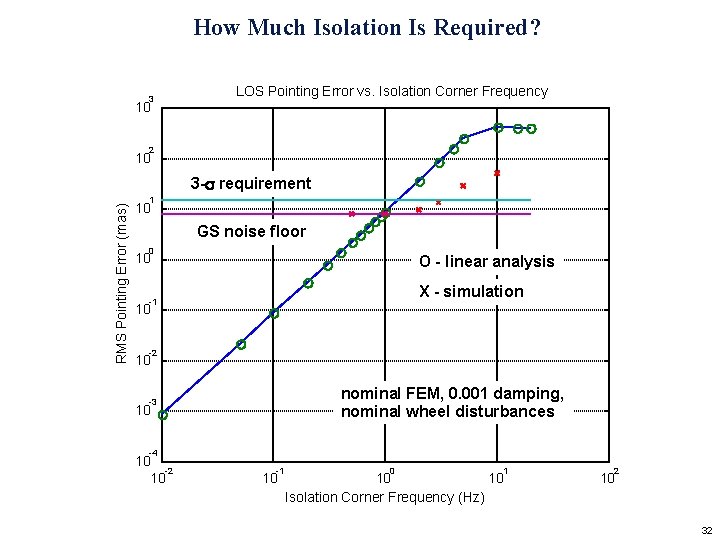
How Much Isolation Is Required? 3 LOS Pointing Error vs. Isolation Corner Frequency 10 2 10 RMS Pointing Error (mas) 3 -s requirement 1 10 GS noise floor 0 10 O - linear analysis X - simulation -1 10 -2 10 nominal FEM, 0. 001 damping, nominal wheel disturbances -3 10 -4 10 -2 10 -1 10 0 1 10 10 Isolation Corner Frequency (Hz) 2 10 32
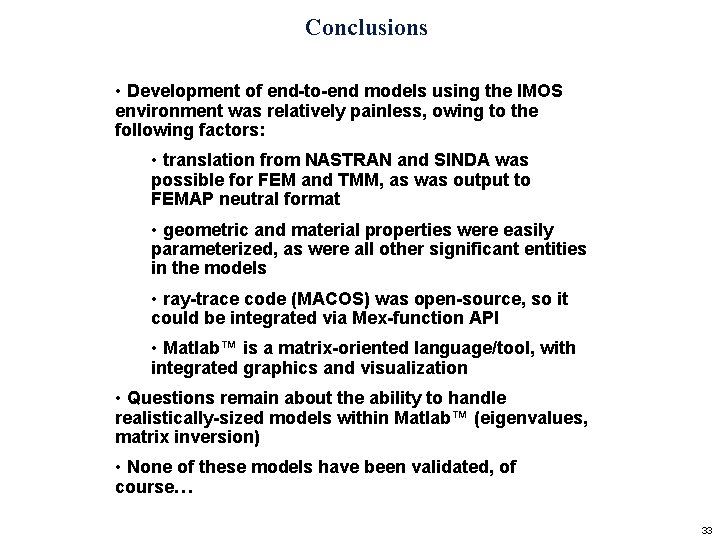
Conclusions • Development of end-to-end models using the IMOS environment was relatively painless, owing to the following factors: • translation from NASTRAN and SINDA was possible for FEM and TMM, as was output to FEMAP neutral format • geometric and material properties were easily parameterized, as were all other significant entities in the models • ray-trace code (MACOS) was open-source, so it could be integrated via Mex-function API • Matlab™ is a matrix-oriented language/tool, with integrated graphics and visualization • Questions remain about the ability to handle realistically-sized models within Matlab™ (eigenvalues, matrix inversion) • None of these models have been validated, of course… 33