Locus plural loci The site on a chromosome

: The site")


 Pred. 2 (>300)")

 v Results")


 to assess for levels of")


 and nucleotide diversity")


 Savigniorrhipis acoreensis FLORES island When individual fragments are")

 between single")

 Sancus acoreensis SMG SMA TER-FR 1 The pooling")


 Pinalitus oromii FLO-FR 1 When individual islands or")

- Slides: 46
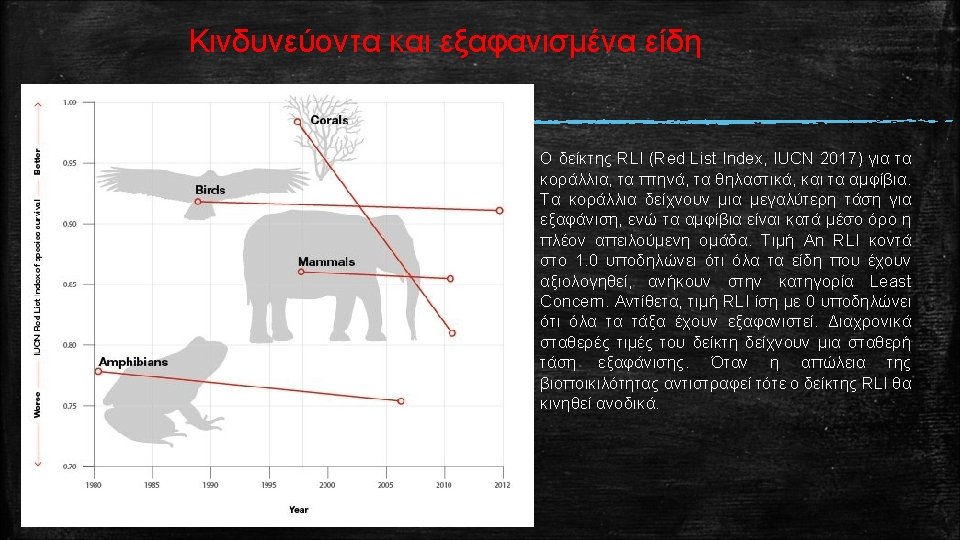
Ορολογία που χρησιμοποιείται για την περιγραφή της γενετικής ποικιλότητας Locus (plural loci): The site on a chromosome at which a particular gene is located. The nucleotide sequence at a locus may code for a particular structure or function, e. g. the segment of DNA coding for the alcohol dehydrogenase enzyme is a separate locus from those coding for haemoglobins. Molecular loci, such as microsatellites (see below), are simply segments of DNA that may have no functional products. Alleles: Different variants of the nucleotide sequence at the same locus (gene) on homologous chromosomes, e. g. A 1, A 2, A 3, A 4, etc. Genotype: The combination of alleles present at a locus in an individual, e. g. A 1 A 1, A 1 A 2 or A 2 A 2. Genotypes are heterozygous (A 1 A 2) or homozygous (A 1 A 1 or A 2 A 2). Genome: The complete genetic material of a species, or individual; the entire DNA nucleotide sequence, including all of the loci and all of the chromosomes. Homozygote: An individual with two copies of the same allele at a locus, e. g. A 1 A 1. Heterozygote: An individual with two different alleles at a locus, e. g. A 1 A 2. Allele frequency: The relative frequency of a particular allele in a population (often referred to as gene frequency). For example, if a population of a diploid species has 8 A 1 A 1 individuals and 2 A 1 A 2 individuals, then there are 18 copies of the A 1 allele and 2 of the A 2 allele. Thus, the A 1 allele has a frequency of 0. 9 and the A 2 allele a
Ορολογία που χρησιμοποιείται για την περιγραφή της γενετικής ποικιλότητας Polymorphic locus: The presence in a species of two or more alleles at a locus, e. g. A 1 and A 2. Polymorphic loci are usually defined as having the most frequent allele at a frequency of less than 0. 99, or less than 0. 95 (to minimize problems with different sample sizes). Monomorphic locus: A locus in a population is monomorphic if it has only one allele present, e. g. A 1. All individuals are homozygous for the same allele. Lacking genetic diversity. Proportion of loci polymorphic (P) Number of polymorphic loci / total number of loci sampled. For example, if 3 of 10 sampled loci are polymorphic, and 7 are monomorphic, P = 3 /10 = 0. 3 Average heterozygosity (H): Sum of the proportions of heterozygotes at all loci / total number of loci sampled. For example, if the proportions of individuals heterozygous at 10 loci in a population are 0. 2, 0. 4, 0. 1, 0, 0, 0, and 0, then H = (0. 2 + 0. 4 + 0. 1 + 0 + 0) /10 = 0. 07. Typically, expected heterozygosities (see below) are reported, as they are less sensitive to sample size than observed heterozygosities. In random mating populations, observed and expected heterozygosities are usually similar. Allelic diversity (A): average number of alleles per locus. For example, if the number of alleles at 10 loci are 2, 3, 2, 1, 1, 1 and 1, then A = (2 + 3 + 2 + 1 + 1) /10 = 1. 4. Co-dominance: Situation where all genotypes can be distinguished from phenotypes i. e. A 1 A 1, A 2 A 2, A 1 A 2 can be distinguished. This contrasts dominance where the phenotypes of some genotypes are indistinguishable.
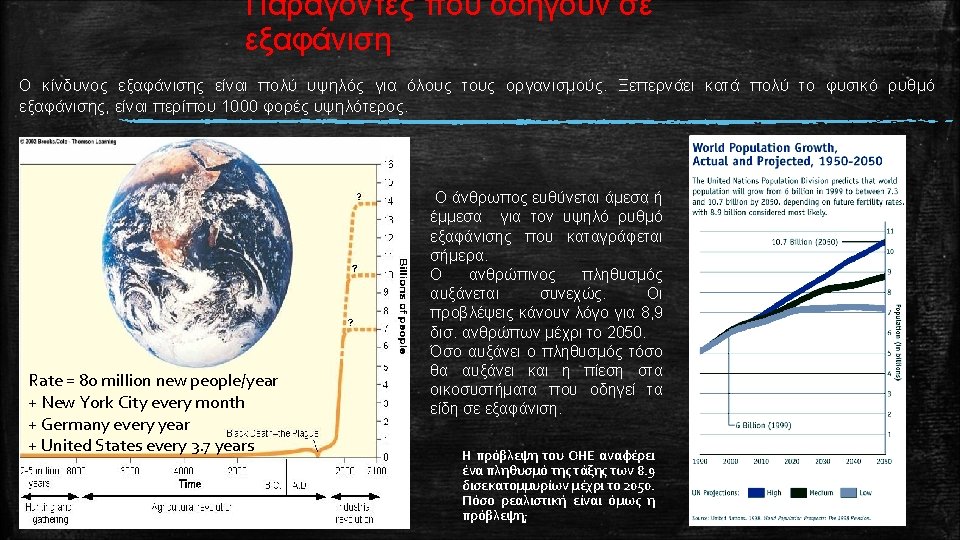
EXTINCTION DEBT ON OCEANIC ISLANDS • Proposed a method for the estimation of the extinction “debt” in a significantly degraded and fragmented natural setting. The method considered both the organisms and the island’s features. • Archipelago of focus: Azores (the natural setting served perfectly the question posed) • Organisms of focus: spiders, coleoptera, hemiptera (forest specialist species) • Applied biogeographic analyses (species area relationships in past and present areas occupied by the forest) The native forest’s area from 1440 till present. The process was simultaneous throughout the Azorean islands
EXTINCTION DEBT ON OCEANIC ISLANDS Working hypothesis If species loss has not yet been completed and is still progressing then the extinction debt has not yet been paid. In this case the best fitting (species-area) model should be among the ones using past forest areas Results The best fitting models (for all groups of organisms considered) were those incorporating the forests’ areas during 1440 and 1700. The “debt” is long overdue!
EXTINCTION DEBT ON OCEANIC ISLANDS Total area R 2=0. 79 R 2=0. 80 >300 m R 2=0. 85 >500 m Current forest area n. s. R 2=0. 72 n. s. R 2=0. 73 n. s. R 2=0. 82 n. s.
EXTINCTION DEBT ON OCEANIC ISLANDS Anticipated extinctions Coleoptera Pred. 1 (ALL) Pred. 2 (>300) Species loss Spiders Pred. 1 (ALL) Pred. 2 (>300) Species loss Hemiptera Pred. 1 (ALL) Pred. 2 (>300) Species loss Graciosa 2 0 0 100% 3 0 0 100% Corvo 1 0 0 100% 0 0 0 - 2 0 0 100% Flores 8 0. 91 2. 69 89 -67% 11 1. 65 2. 22 85 -80% 5 2. 11 2. 30 58 -54% Faial 4 0. 18 0. 75 95 -81% 8 0. 45 1. 33 94 -83% 5 1. 13 77% Pico 14 0. 46 1. 29 97 -91% 10 1. 11 2. 38 91 -80% 4 1. 80 1. 79 55% São Jorge 4 0. 20 0. 81 95 -80% 11 0. 53 1. 46 95 -87% 6 1. 23 1. 21 80% 1. 54 4. 63 11 2. 25 5. 22 79. 553% 8 2. 40 2. 96 Island Terceira 10 85 -54% 54 -49% São Miguel 17 0. 42 2. 11 98 -88% 11 0. 66 2. 32 94 -79% 6 1. 28 1. 43 79 -76% Santa Maria 14 0. 10 1. 17 99 -92% 7 0. 08 0. 77 99 -89% 3 0. 46 0. 48 85 -84% More than 50% of the species of each island is • Coleoptera: 54 -100% expected to go extinct due to the • Spiders: 53 -100% fragmentation/destruction of the native forest • Hemiptera: 49 -100%.
Dept. of Ecology & Systematics, University of Athens Assist. Prof. Parmakelis A. Azorean Biodiversity Group, University of the Azores Prof. Borges P. Dr. Triantis K. Oxford University Centre for the Environment Prof. Whittaker R. Within the frame of the funded project we set out to explore the levels of genetic diversity of representatives of the groups anticipated to go extinct Project: Predicting extinctions on islands: a multi-scale assessment FCT- PTDC/BIA-BEC/100182/2008
STUDY REGION v Azores island complex (7 out of the 9 islands) v Results presented are a part of the wider study involving seven Azorean endemic arthropod species
SAMPLING METHODS AND LOCALITIES üSpecimens collected from 7 islands of the group ü Two sampling methods: Pitfall traps and canopy beating § Pitfall traps in 150 m transects placed every 15 m § Three dominant plant species ü Samples stored in ethanol until further processing
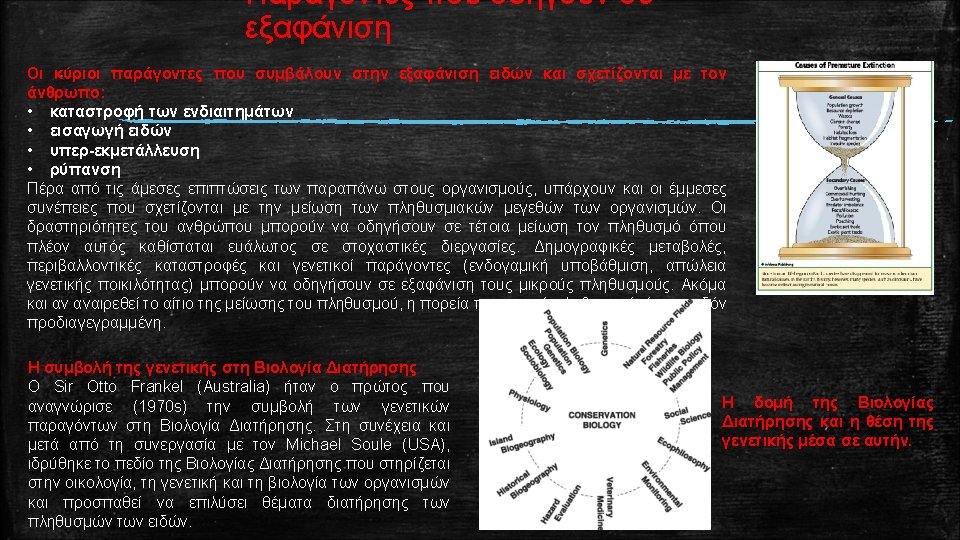
STUDY REGION ISLAND B ISLAND A Fragment A 1 Fragment A 2 Fragment B 1 Fragment B 2 cts Transe ISLAND C Fragment C 1 Pitfall trap Fragment C 2 5 m Transect
List of species (identified based on past ecological data) to assess for levels of genetic diversity Main species Coleoptera MF 77 Pseudechinosoma nodosum Hustache Metophthalmus occidentalis Israelson MF 73 MF 244 Alestrus dolosus (Crotch 1867) Araneae MF 312 Acorigone acoreensis (Wunderlich) MF 134 Gibbaranea occidentalis Wunderlich MF 208 Lasaeola oceanica Simon MF 50 Lepthyphantes acoreensis Wunderlich MF 39 Pisaura acoreensis Wunderlich MF 4 Porrhomma borgesi Wunderlich MF 5 Rugathodes acoreensis Wunderlich MF 179 Sancus acoreensis (Wunderlich) MF 181 Savigniorrhipis acoreensis Wunderlich Hemiptera MF 8 Aphrodes hamiltoni Quartau & Borges MF 137 Pinalitus oromii J. Ribes MF 557 Strophingia harteni Hodkinson Extra species Drouetius spp. MF 222 Trechus terrabravensis Cedrorum azoricus Tarphius spp. MF 2 Tenuiphantes miguelensis Family Habitat Curculionidae Lathridiidae Elateridae Soil Canopy Linyphiidae Araneidae Theridiidae Linyphiidae Pisauridae Linyphiidae Theridiidae Tetragnathidae Linyphiidae Soil Canopy Canopy Cicadellidae Miridae Psyllidae Soil Canopy
GENERAL IDEA Ø Extinction risk is strongly related to the population size, and its genetic diversity Ø Estimate genetic diversity in order to: a) have an insight into the evolutionary dynamic of the species and b) to estimate population size trend (constant, decline-growth) Ø Cross-check population status using the estimates based on ecological data with those based on the genetic data
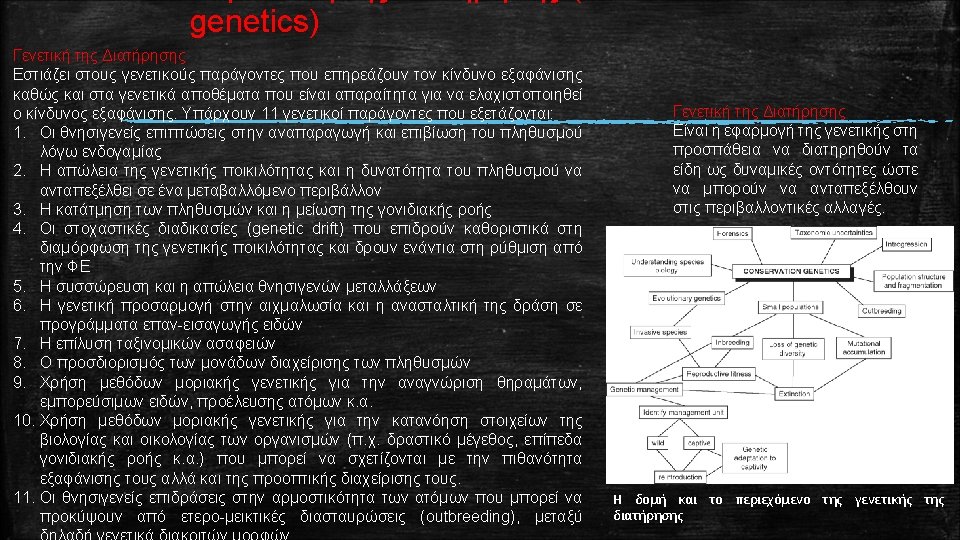
BRIEF THEORETICAL BACKGROUND Conservation and the genetics of populations Why we assess the impact of extent habitat loss with mt. DNA molecular markers? Ø mt. DNA is relatively easy to work with Ø Individuals usually possess many mitochondria that share a single predominant mt. DNA sequence Ø Small size, conserved arrangements of genes Ø High mutation rate Ø Lack of recombination Genetic threats
SPECIES TARGETED Species MF 77 MF 73 MF 244 MF 312 MF 134 MF 208 MF 50 MF 39 MF 4 MF 5 MF 179 MF 181 MF 8 MF 137 MF 557 Coleoptera Pseudechinosoma nodosum Hustache Metophthalmus occidentalis Israelson Alestrus dolosus (Crotch 1867) Araneae Acorigone acoreensis (Wunderlich) Gibbaranea occidentalis Wunderlich Lasaeola oceanica Simon Lepthyphantes acoreensis Wunderlich Pisaura acoreensis Wunderlich Porrhomma borgesi Wunderlich Rugathodes acoreensis Wunderlich Sancus acoreensis (Wunderlich) Savigniorrhipis acoreensis Wunderlich Hemiptera Aphrodes hamiltoni Quartau & Borges Pinalitus oromii J. Ribes Strophingia harteni Hodkinson Extra species Drouetius spp. MF 222 Trechus terrabravensis Cedrorum azoricus Tarphius spp. MF 2 Tenuiphantes miguelensis Family Habitat Curculionidae Soil Lathridiidae Elateridae Soil Canopy Linyphiidae Araneidae Theridiidae Linyphiidae Pisauridae Linyphiidae Theridiidae Tetragnathidae Linyphiidae Soil Canopy Canopy Cicadellidae Miridae Psyllidae Soil Canopy
METHODS GENETIC DATA ANALYSES • Analysis of polymorphisms [Haplotypic diversity (Hd) and nucleotide diversity (Pi or π)] • Neutrality tests (are populations deviating from constant population sizes? Constant population size vs. growth-decline) • Mismatch or segregating sites distributions (general trend of demographic fluctuation, constant size vs. growth-decline) • Bayesian Skyline plots (historical demographic fluctuations using coalescent simulations) Bayesian Skyline plots Mismatch distributions DATASETS PRESENTED • Savignorrhipis acoreensis COI+16 S r. RNA sequences • Sancus acoreensis COI sequences • Pinalitus oromii COI sequences
Analysis of polymorphisms Savigniorrhipis acoreensis • Haplotypic and nucleotide diversity are very low in all fragments and islands • Fragments in each island share haplotypes • There two cases of islands sharing haplotypes (FLO/SMG and (PIC/TER)
Isolation indices Savigniorrhipis acoreensis • The fragments of each island do not seem to be isolated from each other • However, different islands are isolated from each other • An exception to the above is the island pairs FLO/SMG and TER/PIC
Neutrality tests and mismatch/segregating sites distributions Savigniorrhipis acoreensis All neutrality tests performed (Tajima, Fu Fs) produced either a negative or a positive value (depending on the island fragment) but the statistical significance was negligible. This is due to the low levels of divergence exhibited by the sequences - Negative values of tests indicate expansion (following a bottleneck, or selective sweep), whereas positive values indicate population decline • The segregating sites distribution fit for the observed data in TER-FR 1 is in favor of a decline-growth trend of the population size of the fragment • The results were similar for most of the fragments • The low levels of polymorphism recorded in this species is not permitting a valid test of this trend TER-FR 1
Bayesian Skyline Plots (time in My) Savigniorrhipis acoreensis FLORES island When individual fragments are considered, population expansion is marginally detected 95% confidence intervals the PAST Archipelago Increase of population size The pooling of all sequences originating from the island group, indicates a significant expansion trend for the population of Savignorrhipis acoreensis
Analysis of polymorphisms Sancus acoreensis • Polymorphism levels are adequate • Islands maintain high numbers of unique haplotypes • Sharing of haplotypes is extensive and involves fragments and islands
Isolation indices The Fst values indicate extensive geneflow (or ancestral haplotypes sharing) between single island fragments as well as islands Sancus acoreensis
Neutrality tests and mismatch/segregating sites distributions Sancus acoreensis • All neutrality tests performed (Tajima, Fu Fs) produced in most cases a negative value. For some fragments the statistical significance was high. • The fragments’ statistics are reflecting expanding populations (after a bottleneck effect) in some fragments - Negative values of tests indicate expansion (following a bottleneck, or selective sweep), whereas positive values indicate population decline. Statistically significant results are presented in bold characters • The mismatch distribution fit for the observed data in PIC-FR 1 is in favor of a decline-growth trend of the population size of the fragment • In conjunction with the neutrality tests above this is in favor of an expanding population • The results were similar for most of the fragments PIC-FR 1
Bayesian Skyline Plots (time in My) Sancus acoreensis SMG SMA TER-FR 1 The pooling of all sequences originating from the island group, indicates that Sancus acoreensis did show a significant expansion trend in the past but now seems to be stable. Archipelago When individual islands or fragments are considered, population decline or growth is evident in some of them and in congruence with the neutrality tests
Analysis of polymorphisms Pinalitus oromii • Polymorphism is of intermediate level • Islands maintain intermediate numbers of unique haplotypes • Sharing of haplotypes is minimal between islands and low between fragments as well
Isolation indices Pinalitus oromii • The Fst values indicate extensive gene flow (or ancestral haplotypes sharing) between single island fragments • Islands appear to be significantly isolated
Neutrality tests and mismatch/segregating sites distributions Pinalitus oromii • All neutrality tests performed (Tajima, Fu Fs) produced in most cases a negative value. For some fragments the statistical significance was moderate to marginal. • Some of the fragments are indicating expanding populations (after a bottleneck effect) - Negative values of tests indicate expansion (following a bottleneck, or selective sweep), whereas positive values indicate population decline. Statistically significant results are presented in bold characters • The mismatch distribution fit for the observed data in FLO-FR 1 is in favor of a decline-growth trend of the population size of the fragment • In conjunction with the neutrality tests above this is in favor of an expanding population • The results were similar for most of the fragments FLO-FR 1
Bayesian Skyline Plots (time in My) Pinalitus oromii FLO-FR 1 When individual islands or fragments are considered, constant populations cannot be rejected. This is in congruence with the marginal or moderate significance of the neutrality tests TER
CONCLUSIONS BASED ON THE POPULATION GENETICS ANALYSES • Each species shows a different pattern in the diversity levels of the various spatial scales • Each species shows different levels of isolation between islands • Species seem to have responded differently in the fragmentation of their natural habitats • There are species that show extremely low levels of genetic diversity in all spatial scales (e. g. Savignorrhipis acoreensis) • There are species that maintain significant levels of genetic diversity in all spatial scales (e. g. Sancus acoreensis) • Fragmentation does not necessarily have to have a negative effect on the species genetic diversity. It could be that some species’ genetic diversity is amplified due to the structuring of their populations caused by fragmentation • Fluctuations in population sizes are recorded in all species and are traced in the past before the fragmentation events • We now have a pretty good picture of species that would worth to be examined with the use of microsatellites/AFLPs to infer the pattern at a finer spatial and temporal scale