Lecture 24 Chapter 18 Continued Spoilage Rework and
- Slides: 109
Lecture 24 Chapter 18 -Continued Spoilage, Rework and Scrap Readings Chapter 18, Cost Accounting, Managerial Emphasis, 14 th edition by Horengren 1
Learning Objectives Compute the predetermined overhead rate and apply overhead to products in a standard cost system. Compute and interpret the fixed overhead budget and volume variances. Accounting for spoilage under different methods of inventory systems and standard costing Accounting for rework in different situations under different costing methods Accounting for Scrap in different situations under different costing method Examples of spoilage 2
Accounting for Spoilage Costs Spoilage represents the amount of resources that go into the process, but DO NOT result in finished product. Managers face key problems related to spoilage: 1. Identifying whether it exists. 2. Determining whether it can be eliminated. 3. Deciding whether eliminating it is worthwhile. 4. Determining the cost of spoilage. The 5 -step approach discussed earlier can be modified by including spoilage
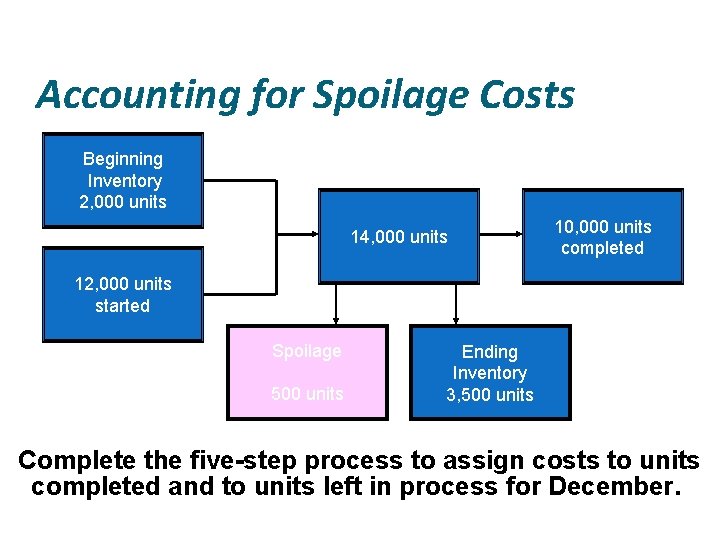
Accounting for Spoilage Costs Normal spoilage occurs as a part of the regular operations of an efficient process. Abnormal spoilage is the result of unusual operating problems. Abnormal spoilage is in addition to normal spoilage, and is recorded as a loss of the period. We will illustrate the spoilage using the December data for Spirit Beverages, but without the transferred-in costs.
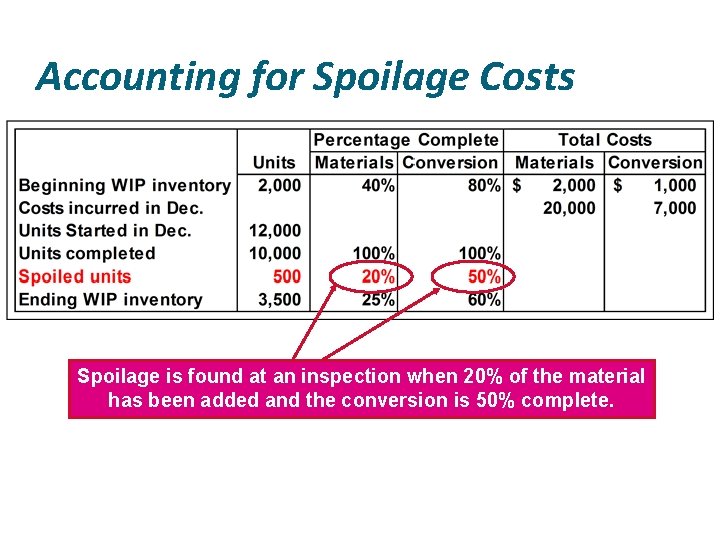
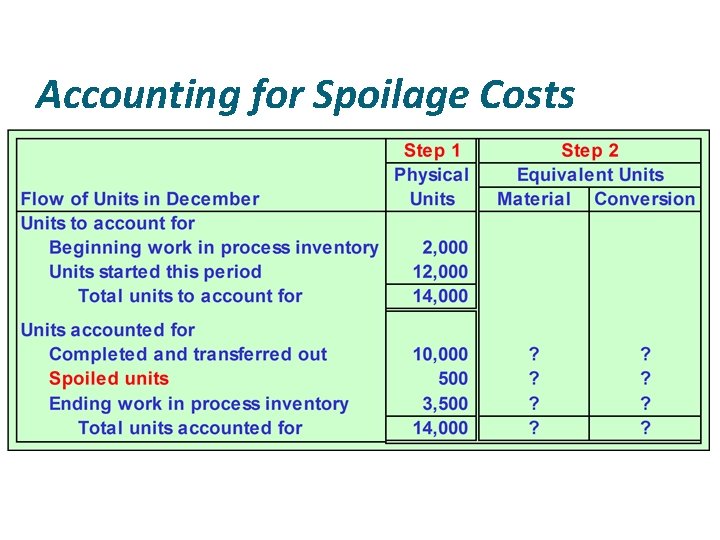
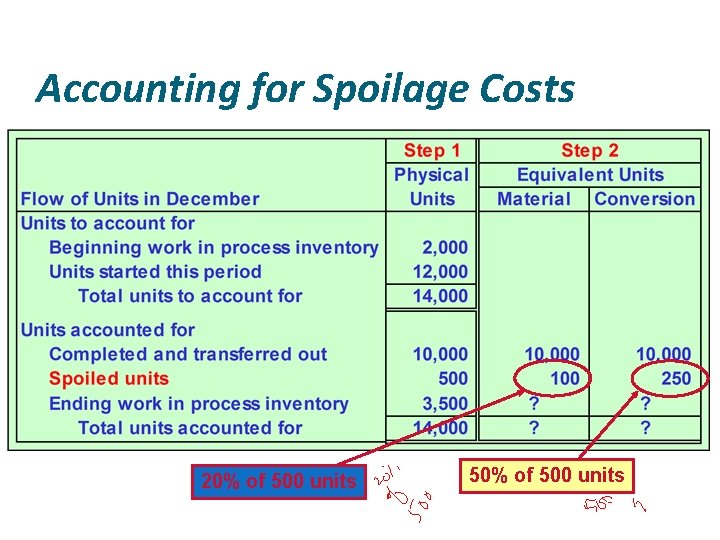
Accounting for Spoilage Costs Spoilage is found at an inspection when 20% of the material has been added and the conversion is 50% complete.
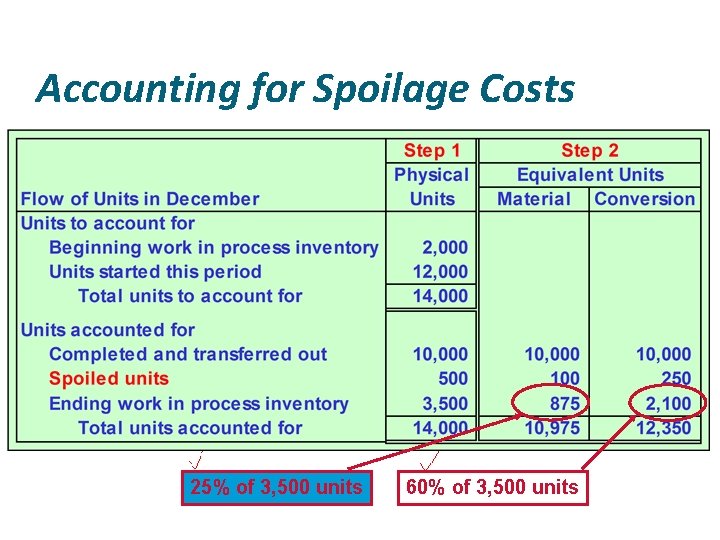
Accounting for Spoilage Costs Beginning Inventory 2, 000 units 14, 000 units 10, 000 units completed 12, 000 units started Spoilage 500 units Ending Inventory 3, 500 units Complete the five-step process to assign costs to units completed and to units left in process for December.
Accounting for Spoilage Costs
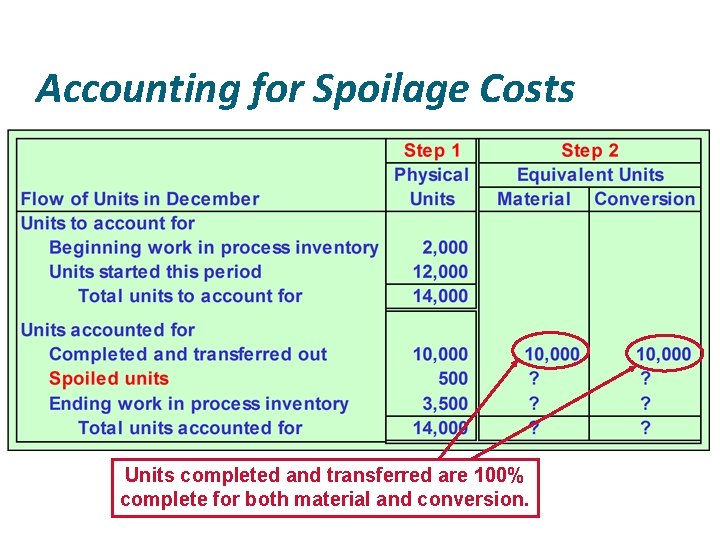
Accounting for Spoilage Costs Units completed and transferred are 100% complete for both material and conversion.
Accounting for Spoilage Costs 20% of 500 units 50% of 500 units
Accounting for Spoilage Costs 25% of 3, 500 units 60% of 3, 500 units
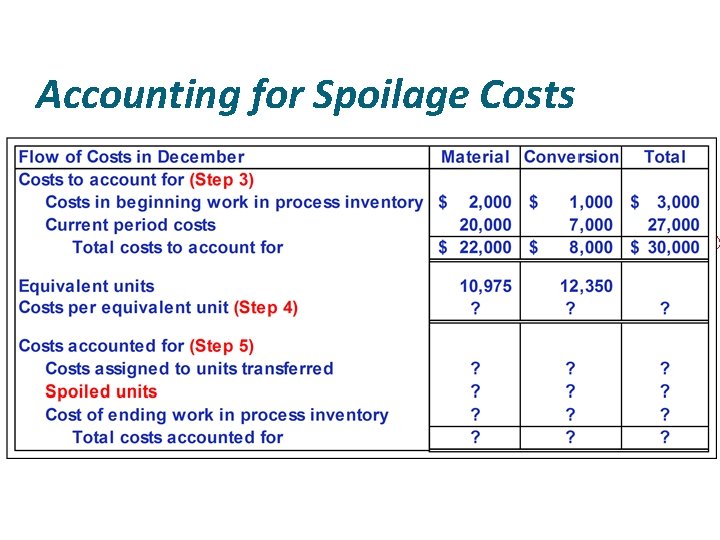
Accounting for Spoilage Costs
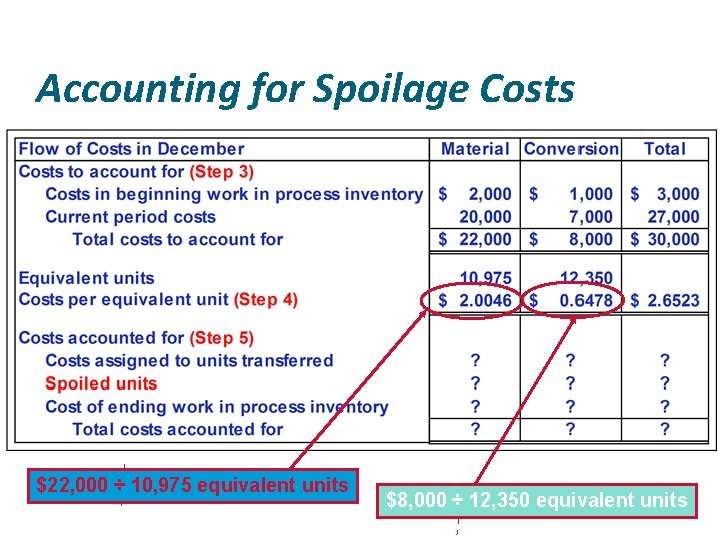
Accounting for Spoilage Costs $22, 000 ÷ 10, 975 equivalent units $8, 000 ÷ 12, 350 equivalent units
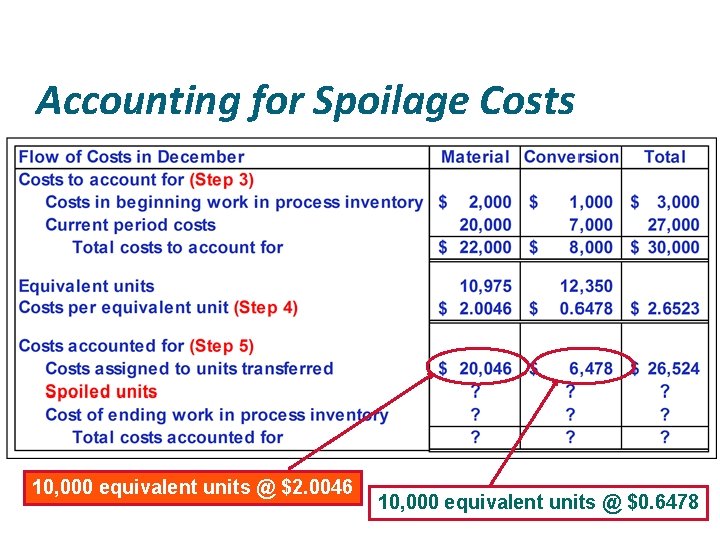
Accounting for Spoilage Costs 10, 000 equivalent units @ $2. 0046 10, 000 equivalent units @ $0. 6478
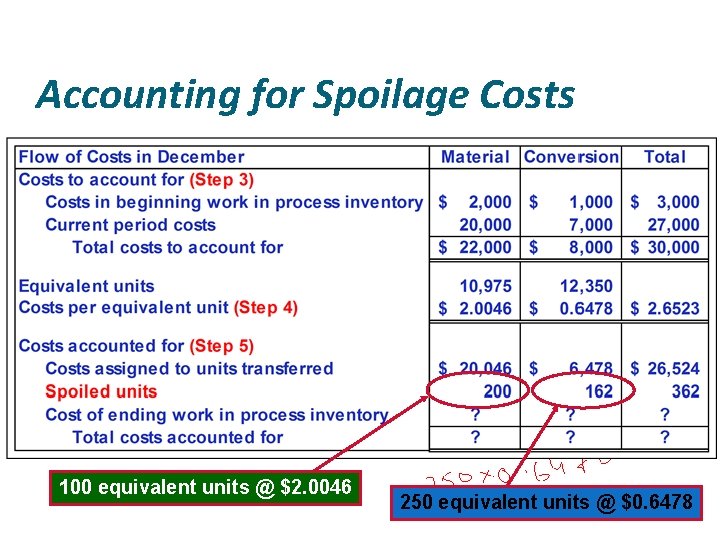
Accounting for Spoilage Costs 100 equivalent units @ $2. 0046 250 equivalent units @ $0. 6478
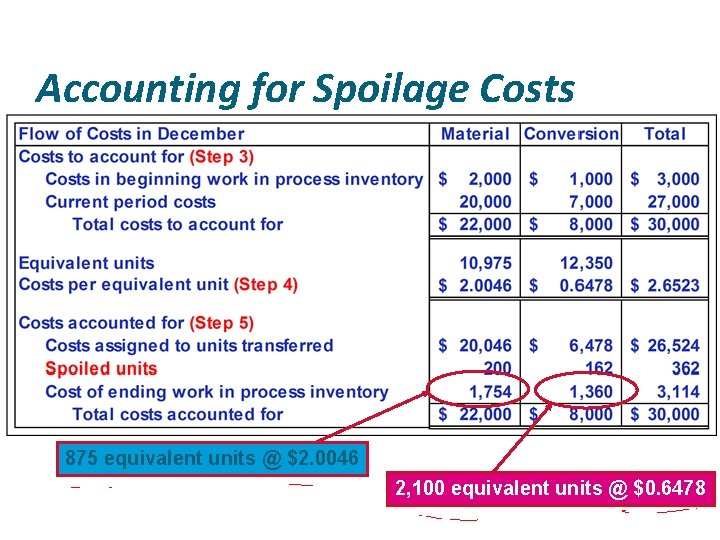
Accounting for Spoilage Costs 875 equivalent units @ $2. 0046 2, 100 equivalent units @ $0. 6478
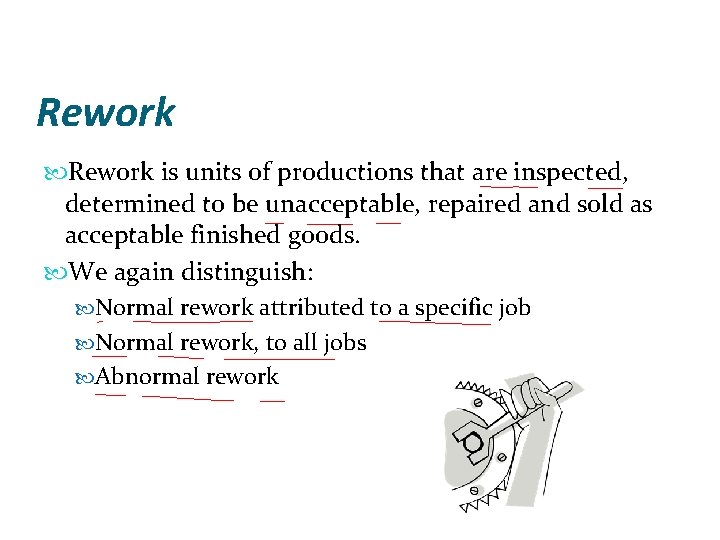
Rework is units of productions that are inspected, determined to be unacceptable, repaired and sold as acceptable finished goods. We again distinguish: Normal rework attributed to a specific job Normal rework, to all jobs Abnormal rework
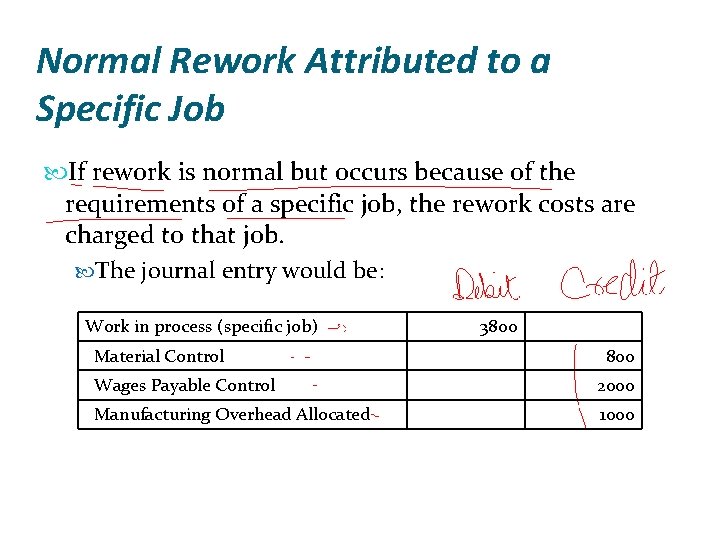
Normal Rework Attributed to a Specific Job If rework is normal but occurs because of the requirements of a specific job, the rework costs are charged to that job. The journal entry would be: Work in process (specific job) Material Control 3800 Wages Payable Control 2000 Manufacturing Overhead Allocated 1000
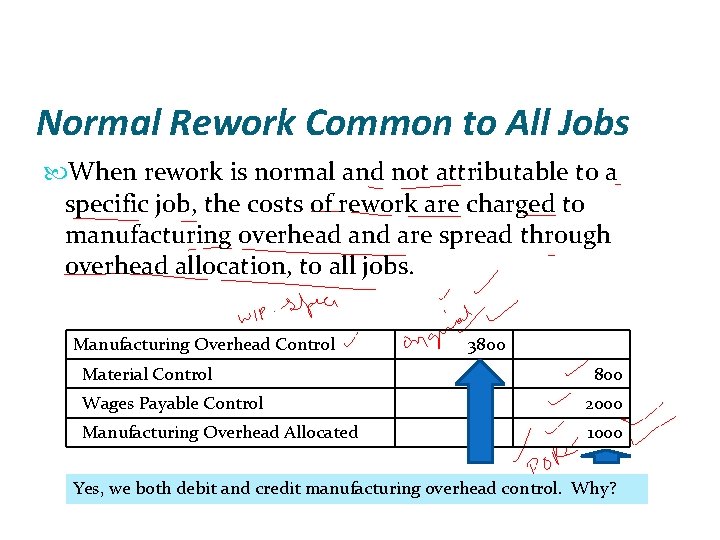
Normal Rework Common to All Jobs When rework is normal and not attributable to a specific job, the costs of rework are charged to manufacturing overhead and are spread through overhead allocation, to all jobs. Manufacturing Overhead Control Material Control 3800 Wages Payable Control 2000 Manufacturing Overhead Allocated 1000 Yes, we both debit and credit manufacturing overhead control. Why?
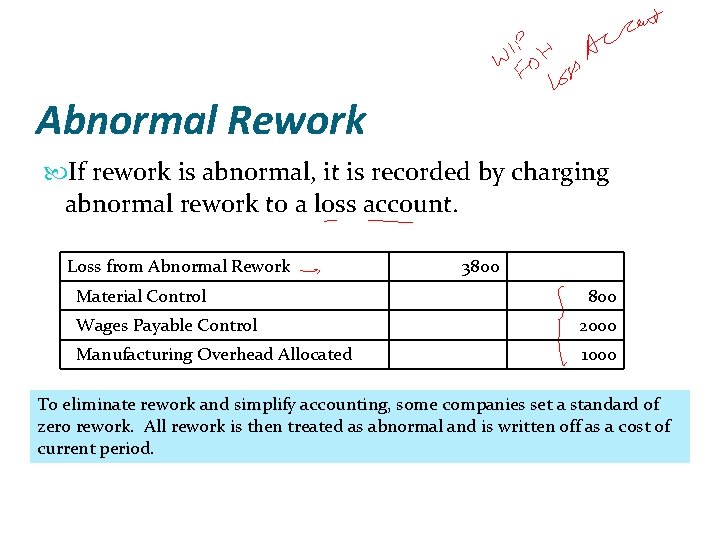
Abnormal Rework If rework is abnormal, it is recorded by charging abnormal rework to a loss account. Loss from Abnormal Rework Material Control 3800 Wages Payable Control 2000 Manufacturing Overhead Allocated 1000 To eliminate rework and simplify accounting, some companies set a standard of zero rework. All rework is then treated as abnormal and is written off as a cost of current period.
Scrap is residual material that results from manufacturing a product. It has low sales value compared with the total sales value of the product. No distinction is made between normal and abnormal scrap because low cost is assigned to scrap. The only distinction made is between scrap attributable to a specific job and scrap, to all jobs.
Scrap There are two aspects of accounting for scrap. Planning and control, including physical tracking. Inventory costing, including when and how scrap effects operating income. Initial entries to scrap records are commonly in physical terms.
Scrap is either: Sold or disposed of quickly. Or stored for later sale, disposal, or reuse.
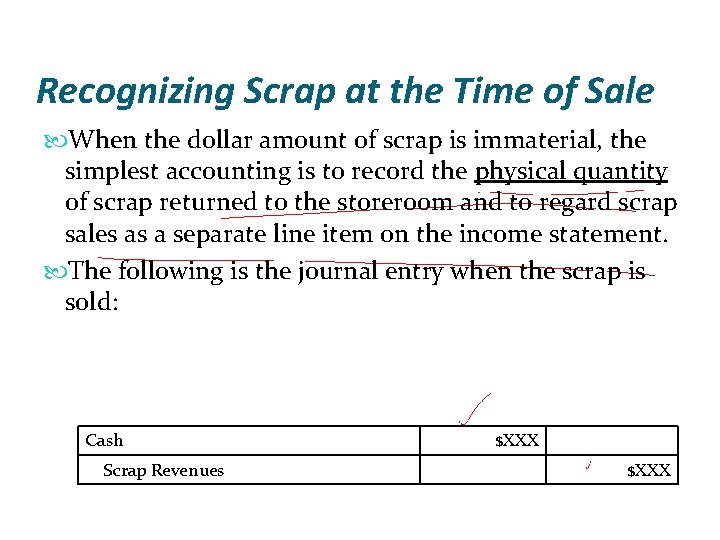
Recognizing Scrap at the Time of Sale When the dollar amount of scrap is immaterial, the simplest accounting is to record the physical quantity of scrap returned to the storeroom and to regard scrap sales as a separate line item on the income statement. The following is the journal entry when the scrap is sold: Cash Scrap Revenues $XXX
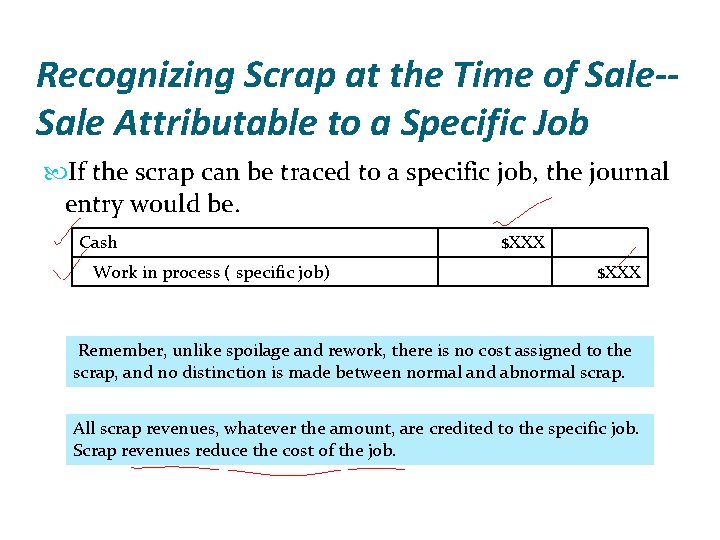
Recognizing Scrap at the Time of Sale-Sale Attributable to a Specific Job If the scrap can be traced to a specific job, the journal entry would be. Cash Work in process ( specific job) $XXX Remember, unlike spoilage and rework, there is no cost assigned to the scrap, and no distinction is made between normal and abnormal scrap. All scrap revenues, whatever the amount, are credited to the specific job. Scrap revenues reduce the cost of the job.
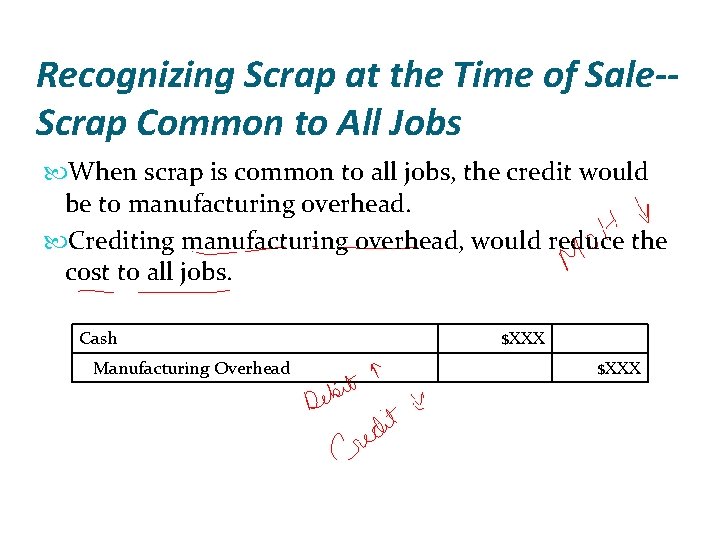
Recognizing Scrap at the Time of Sale-Scrap Common to All Jobs When scrap is common to all jobs, the credit would be to manufacturing overhead. Crediting manufacturing overhead, would reduce the cost to all jobs. Cash Manufacturing Overhead $XXX
Two Important Questions with Regard to Scrap When should the value of scrap be recognized in the accounting records – at the time scrap is produced or at the time scrap is sold? How should the revenues from scrap be accounted for?
Example The Mendoza Company has an extensive job costing facility that uses a variety of metals. Consider each requirement independently.
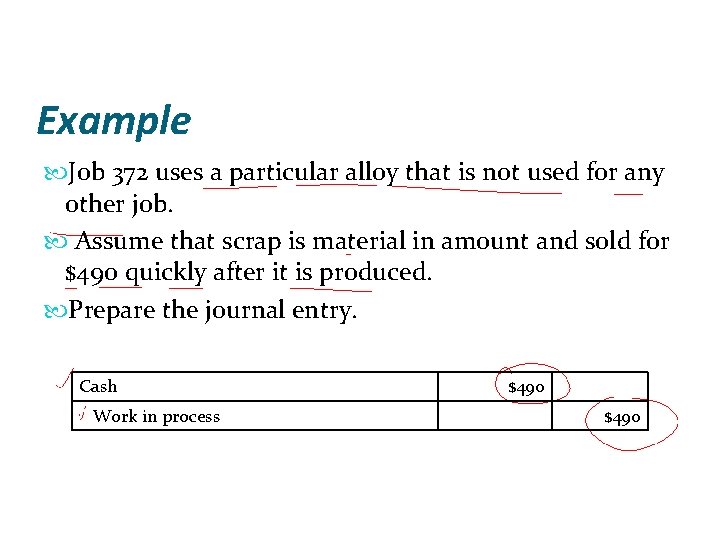
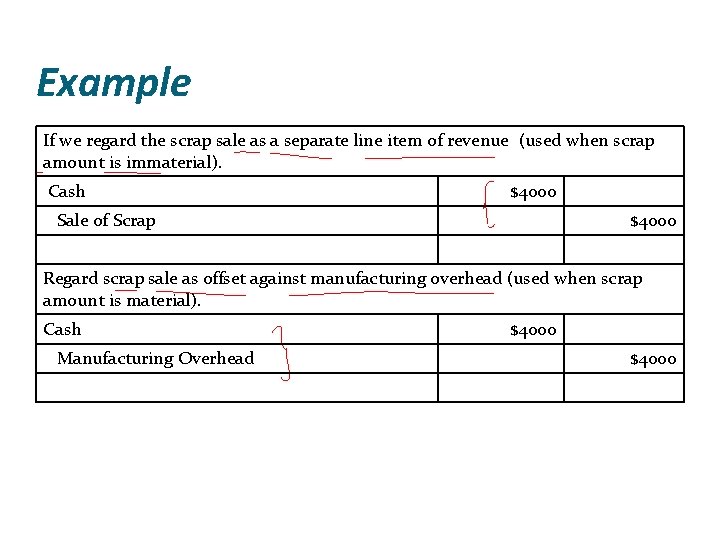
Example Job 372 uses a particular alloy that is not used for any other job. Assume that scrap is material in amount and sold for $490 quickly after it is produced. Prepare the journal entry. Cash Work in process $490
Example The scrap from job 372 consists of a metal used by many other jobs. No record is maintained at the time the scrap is generated by individual jobs. Assume the scrap is accounted for at the time of sale. Scrap totaling $4000 is sold. Prepare two alternative journal entries that could be used to account for the sale of the scrap.
Example If we regard the scrap sale as a separate line item of revenue (used when scrap amount is immaterial). Cash $4000 Sale of Scrap $4000 Regard scrap sale as offset against manufacturing overhead (used when scrap amount is material). Cash Manufacturing Overhead $4000
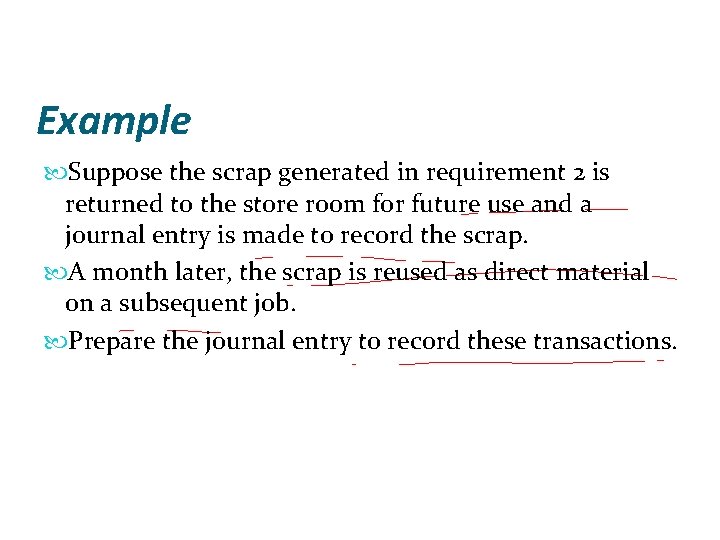
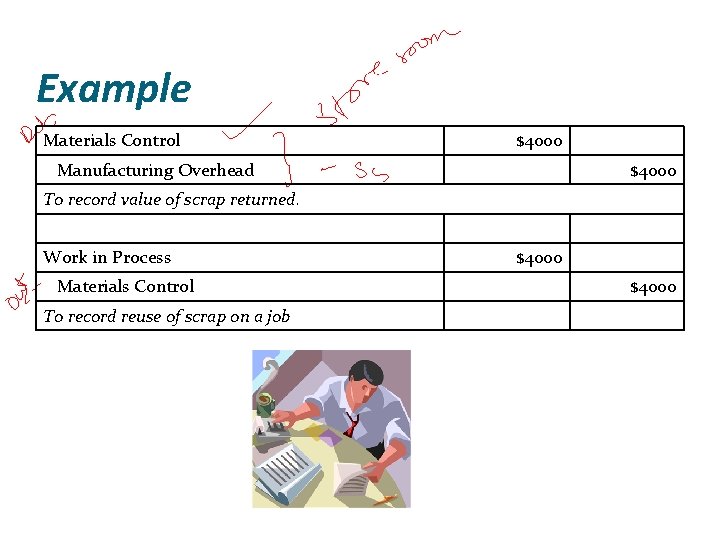
Example Suppose the scrap generated in requirement 2 is returned to the store room for future use and a journal entry is made to record the scrap. A month later, the scrap is reused as direct material on a subsequent job. Prepare the journal entry to record these transactions.
Example Materials Control $4000 Manufacturing Overhead $4000 To record value of scrap returned. Work in Process Materials Control To record reuse of scrap on a job $4000
Some Spoilage Examples
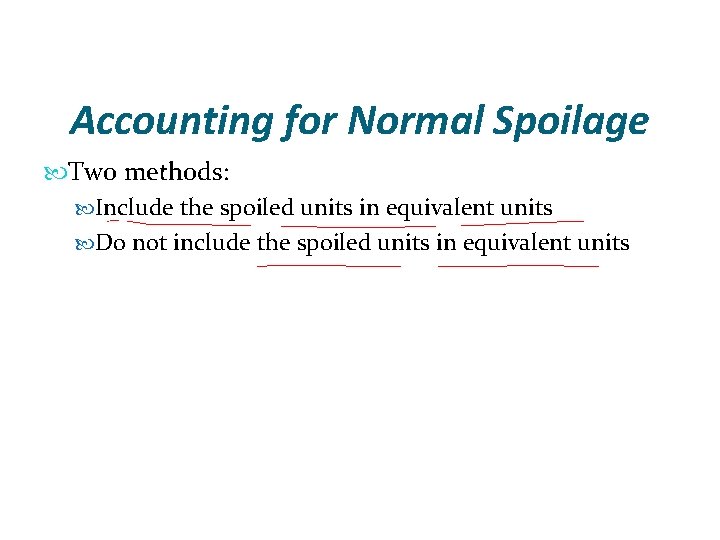
Accounting for Normal Spoilage Two methods: Include the spoiled units in equivalent units Do not include the spoiled units in equivalent units
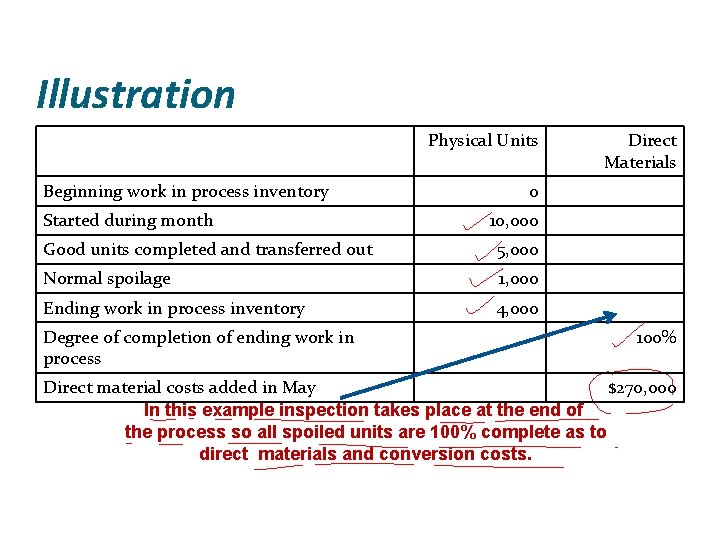
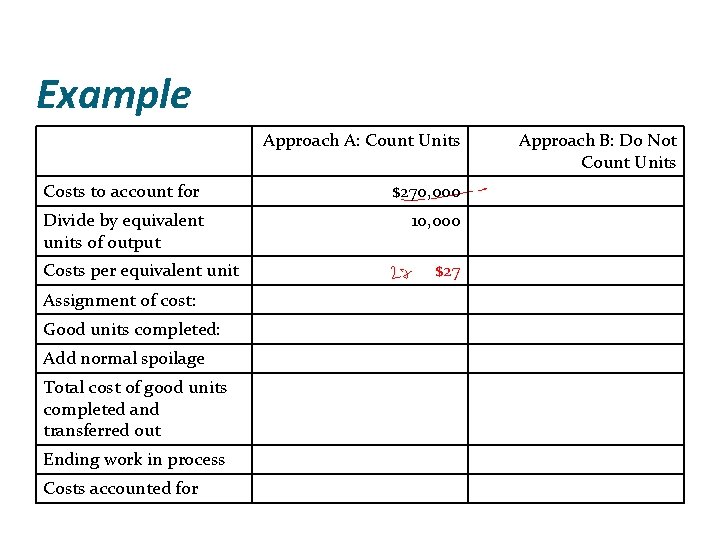
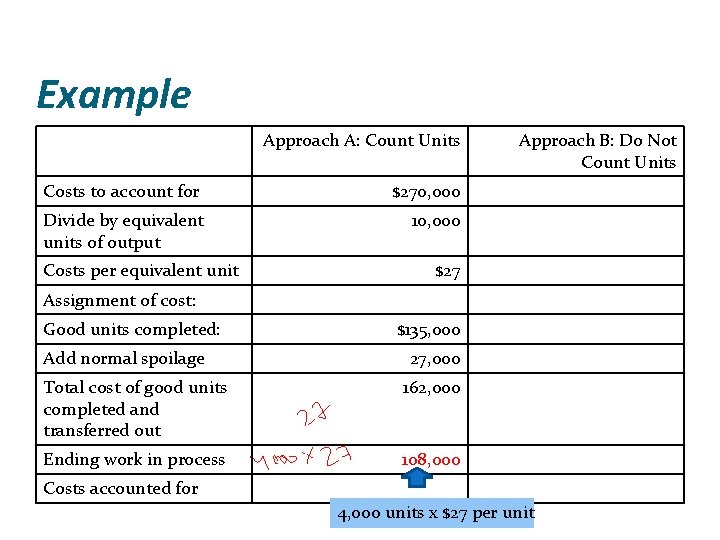
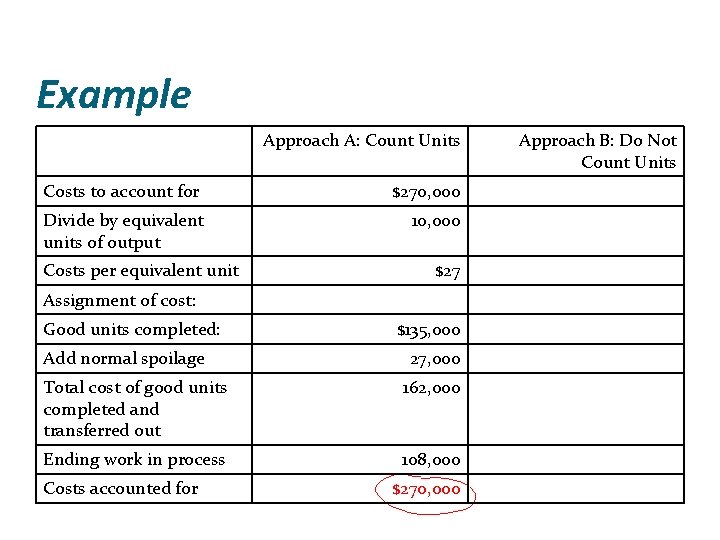
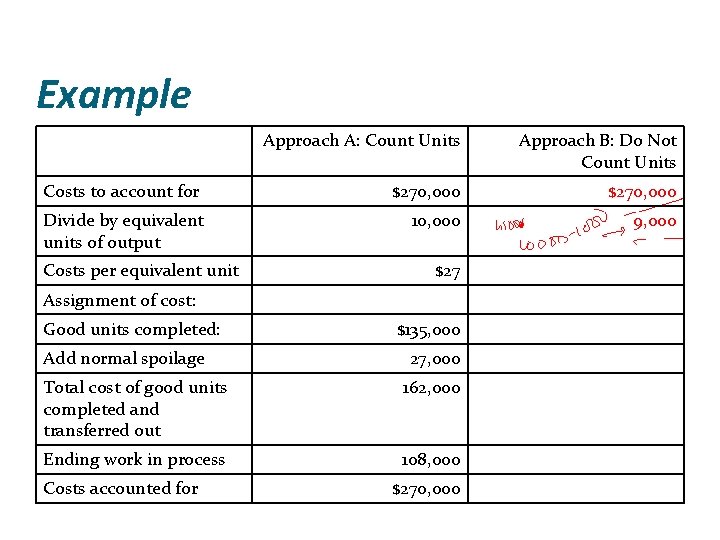
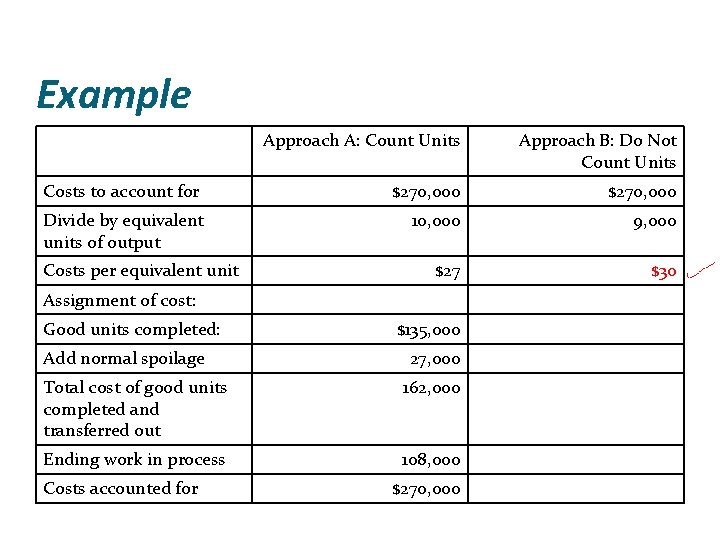
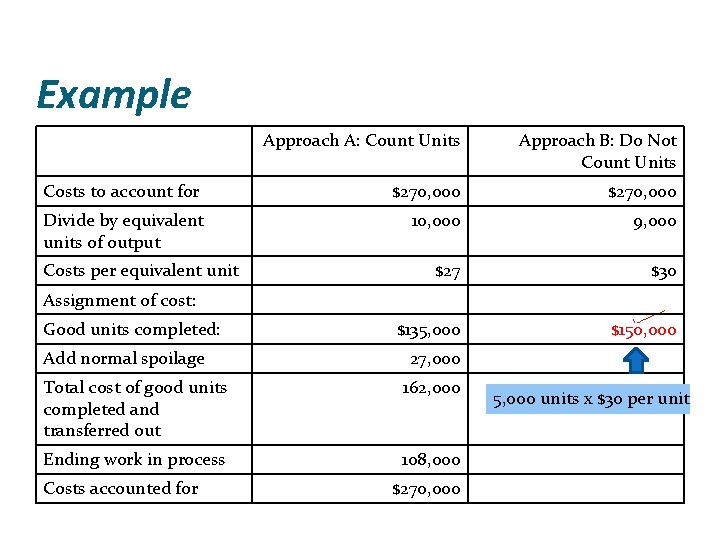
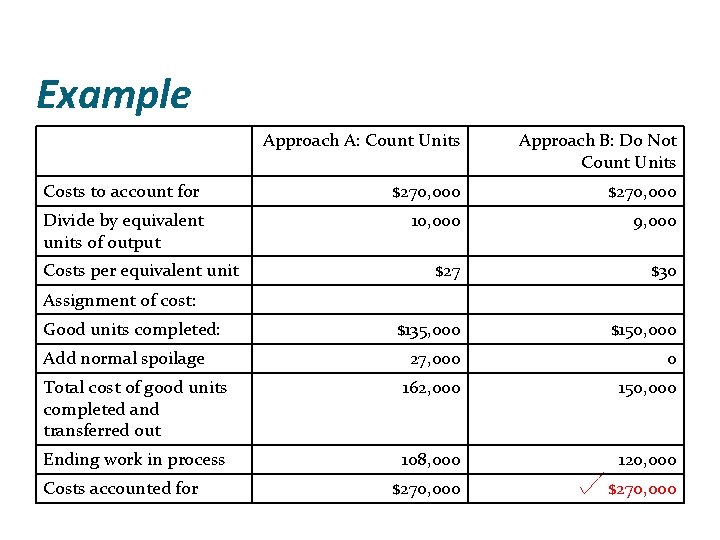
Illustration Physical Units Beginning work in process inventory Started during month 0 10, 000 Good units completed and transferred out 5, 000 Normal spoilage 1, 000 Ending work in process inventory 4, 000 Degree of completion of ending work in process Direct Materials 100% Direct material costs added in May $270, 000 In this example inspection takes place at the end of the process so all spoiled units are 100% complete as to direct materials and conversion costs.
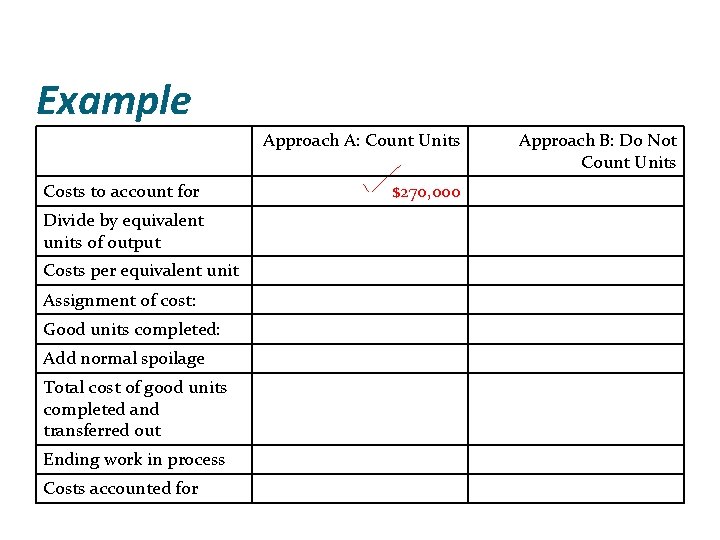
Example Approach A: Count Units Costs to account for Divide by equivalent units of output Costs per equivalent unit Assignment of cost: Good units completed: Add normal spoilage Total cost of good units completed and transferred out Ending work in process Costs accounted for $270, 000 Approach B: Do Not Count Units
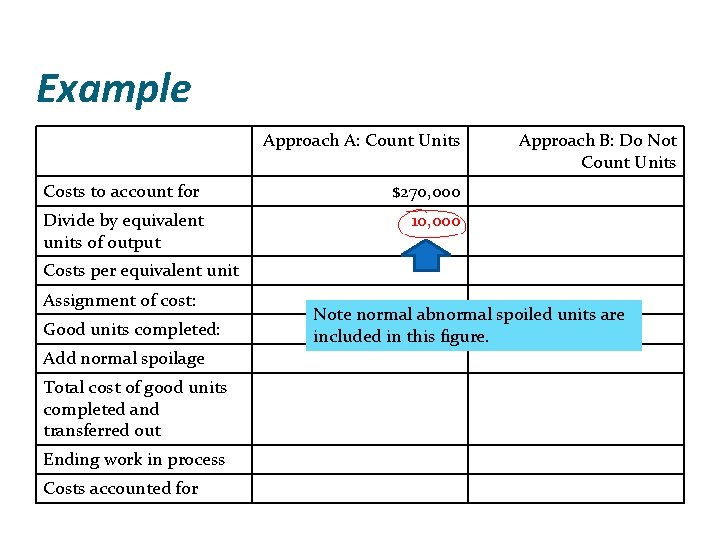
Example Approach A: Count Units Costs to account for $270, 000 Divide by equivalent units of output 10, 000 Approach B: Do Not Count Units Costs per equivalent unit Assignment of cost: Good units completed: Add normal spoilage Total cost of good units completed and transferred out Ending work in process Costs accounted for Note normal abnormal spoiled units are included in this figure.
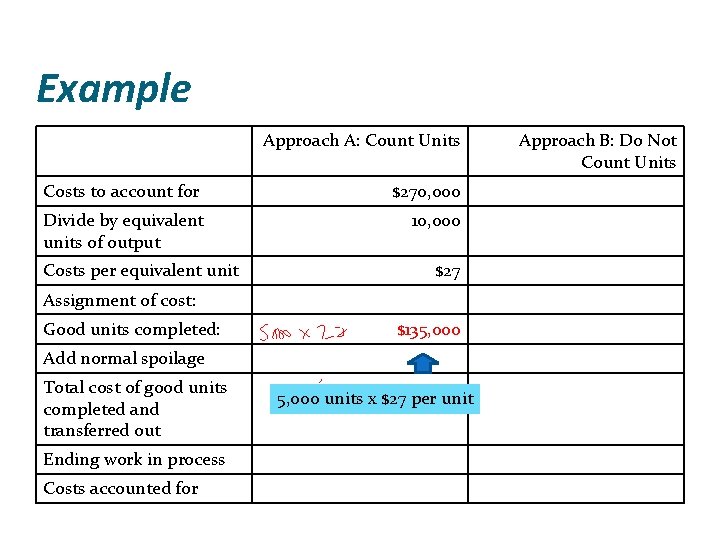
Example Approach A: Count Units Costs to account for $270, 000 Divide by equivalent units of output 10, 000 Costs per equivalent unit Assignment of cost: Good units completed: Add normal spoilage Total cost of good units completed and transferred out Ending work in process Costs accounted for $27 Approach B: Do Not Count Units
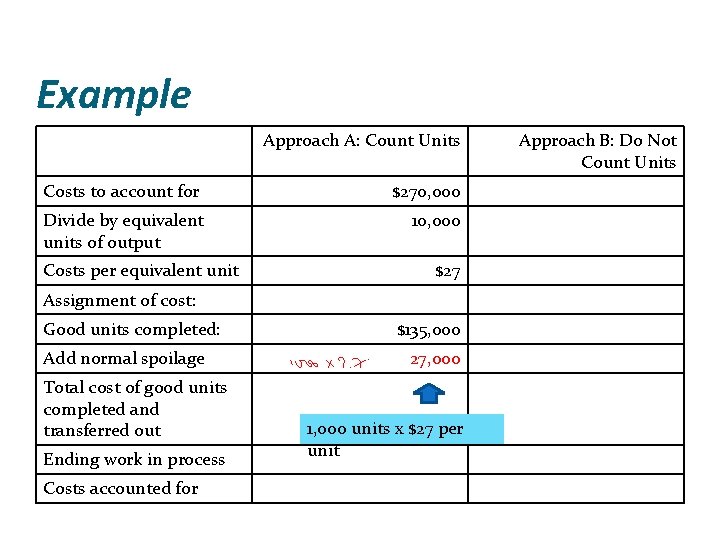
Example Approach A: Count Units Costs to account for $270, 000 Divide by equivalent units of output 10, 000 Costs per equivalent unit $27 Assignment of cost: Good units completed: $135, 000 Add normal spoilage Total cost of good units completed and transferred out Ending work in process Costs accounted for 5, 000 units x $27 per unit Approach B: Do Not Count Units
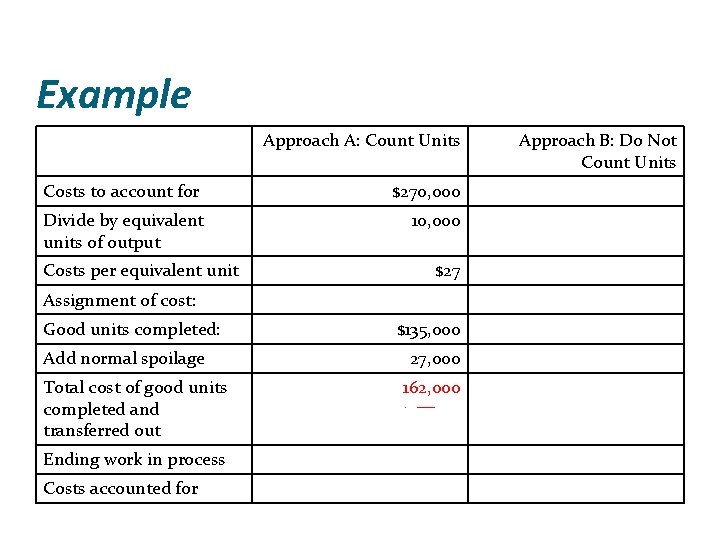
Example Approach A: Count Units Costs to account for $270, 000 Divide by equivalent units of output 10, 000 Costs per equivalent unit $27 Assignment of cost: Good units completed: Add normal spoilage Total cost of good units completed and transferred out Ending work in process Costs accounted for $135, 000 27, 000 1, 000 units x $27 per unit Approach B: Do Not Count Units
Example Approach A: Count Units Costs to account for $270, 000 Divide by equivalent units of output 10, 000 Costs per equivalent unit $27 Assignment of cost: Good units completed: Add normal spoilage Total cost of good units completed and transferred out Ending work in process Costs accounted for $135, 000 27, 000 162, 000 Approach B: Do Not Count Units
Example Approach A: Count Units Costs to account for $270, 000 Divide by equivalent units of output 10, 000 Costs per equivalent unit Approach B: Do Not Count Units $27 Assignment of cost: Good units completed: Add normal spoilage $135, 000 27, 000 Total cost of good units completed and transferred out 162, 000 Ending work in process 108, 000 Costs accounted for 4, 000 units x $27 per unit
Example Approach A: Count Units Costs to account for $270, 000 Divide by equivalent units of output 10, 000 Costs per equivalent unit $27 Assignment of cost: Good units completed: Add normal spoilage $135, 000 27, 000 Total cost of good units completed and transferred out 162, 000 Ending work in process 108, 000 Costs accounted for $270, 000 Approach B: Do Not Count Units
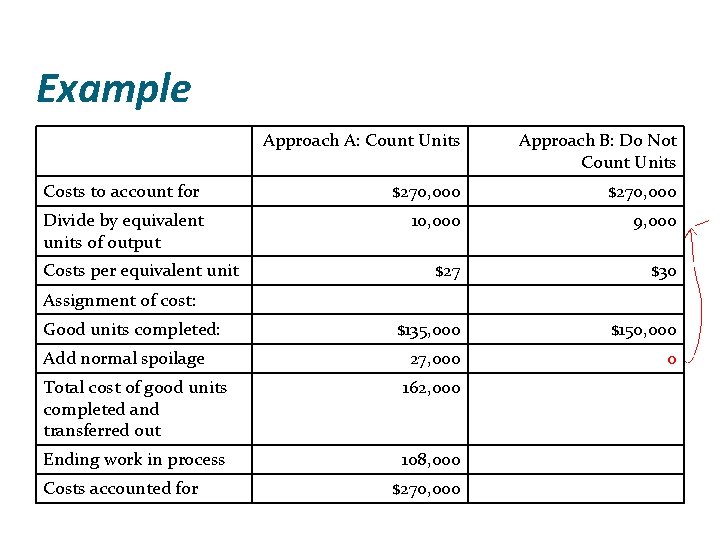
Example Approach A: Count Units Approach B: Do Not Count Units Costs to account for $270, 000 Divide by equivalent units of output 10, 000 9, 000 Costs per equivalent unit $27 Assignment of cost: Good units completed: Add normal spoilage $135, 000 27, 000 Total cost of good units completed and transferred out 162, 000 Ending work in process 108, 000 Costs accounted for $270, 000
Example Approach A: Count Units Approach B: Do Not Count Units Costs to account for $270, 000 Divide by equivalent units of output 10, 000 9, 000 $27 $30 Costs per equivalent unit Assignment of cost: Good units completed: Add normal spoilage $135, 000 27, 000 Total cost of good units completed and transferred out 162, 000 Ending work in process 108, 000 Costs accounted for $270, 000
Example Approach A: Count Units Approach B: Do Not Count Units Costs to account for $270, 000 Divide by equivalent units of output 10, 000 9, 000 $27 $30 $135, 000 $150, 000 Costs per equivalent unit Assignment of cost: Good units completed: Add normal spoilage 27, 000 Total cost of good units completed and transferred out 162, 000 Ending work in process 108, 000 Costs accounted for $270, 000 5, 000 units x $30 per unit
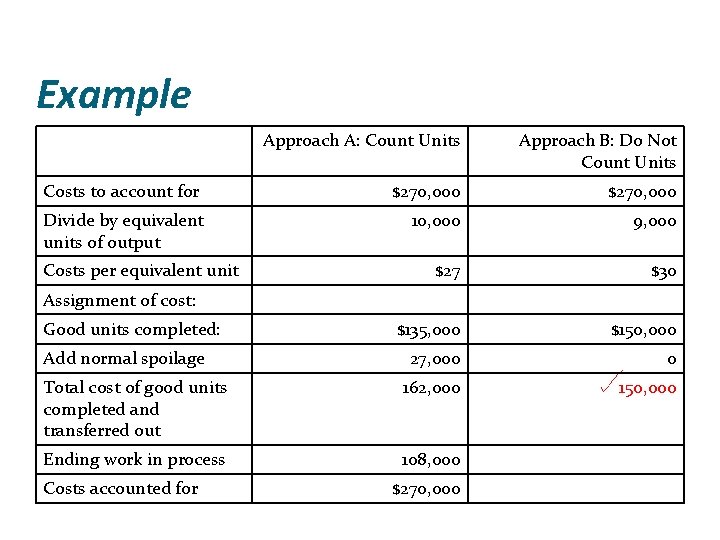
Example Approach A: Count Units Approach B: Do Not Count Units Costs to account for $270, 000 Divide by equivalent units of output 10, 000 9, 000 $27 $30 $135, 000 $150, 000 27, 000 0 Costs per equivalent unit Assignment of cost: Good units completed: Add normal spoilage Total cost of good units completed and transferred out 162, 000 Ending work in process 108, 000 Costs accounted for $270, 000
Example Approach A: Count Units Approach B: Do Not Count Units Costs to account for $270, 000 Divide by equivalent units of output 10, 000 9, 000 $27 $30 $135, 000 $150, 000 27, 000 0 Total cost of good units completed and transferred out 162, 000 150, 000 Ending work in process 108, 000 Costs per equivalent unit Assignment of cost: Good units completed: Add normal spoilage Costs accounted for $270, 000
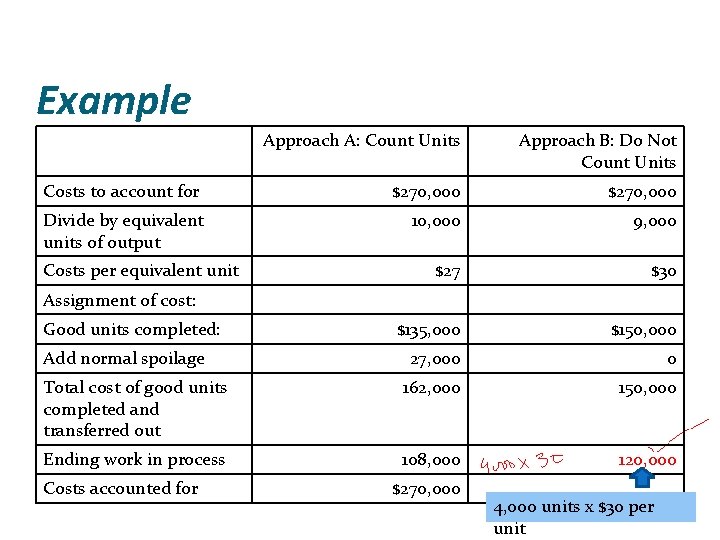
Example Approach A: Count Units Approach B: Do Not Count Units Costs to account for $270, 000 Divide by equivalent units of output 10, 000 9, 000 $27 $30 $135, 000 $150, 000 27, 000 0 Total cost of good units completed and transferred out 162, 000 150, 000 Ending work in process 108, 000 120, 000 Costs per equivalent unit Assignment of cost: Good units completed: Add normal spoilage Costs accounted for $270, 000 4, 000 units x $30 per unit
Example Approach A: Count Units Approach B: Do Not Count Units Costs to account for $270, 000 Divide by equivalent units of output 10, 000 9, 000 $27 $30 $135, 000 $150, 000 27, 000 0 Total cost of good units completed and transferred out 162, 000 150, 000 Ending work in process 108, 000 120, 000 $270, 000 Costs per equivalent unit Assignment of cost: Good units completed: Add normal spoilage Costs accounted for
Best Method A (include the spoiled units in equivalent units) is the best method as it more accurately allocates costs, and therefore will be used in working problems in this chapter.
Process Costing and Spoilage Let’s now look at an example of process costing with spoilage when there is beginning inventory ( not illustrated in previous example) using both weighted average and FIFO methodologies.
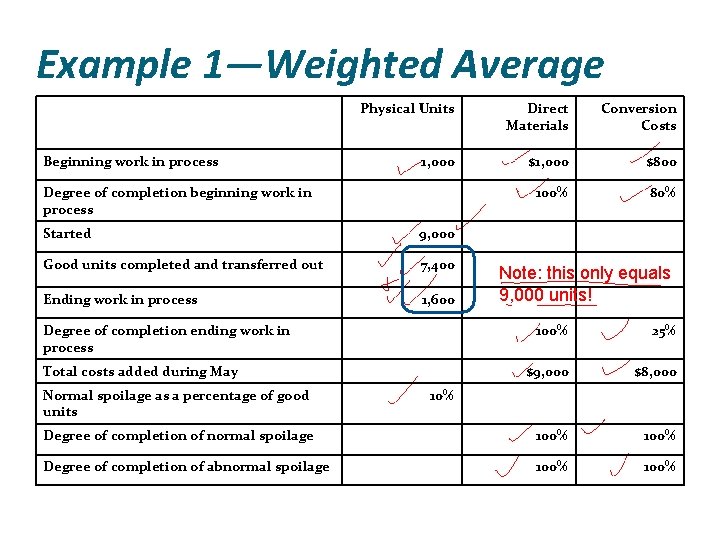
Example 1 -Weighted Average Alston company uses weighted average. It has two departments: cleaning and milling. For the cleaning department, conversion costs are added evenly and direct materials are added at the beginning of the process. Spoiled costs are detected at the end of the process and are disposed of at net zero disposal value. All completed work is transferred to the milling department.
Example 1—Weighted Average Beginning work in process Physical Units Direct Materials Conversion Costs 1, 000 $800 100% 80% Degree of completion beginning work in process Started 9, 000 Good units completed and transferred out 7, 400 Ending work in process 1, 600 Degree of completion ending work in process Note: this only equals 9, 000 units! 100% 25% $9, 000 $8, 000 Degree of completion of normal spoilage 100% Degree of completion of abnormal spoilage 100% Total costs added during May Normal spoilage as a percentage of good units 10%
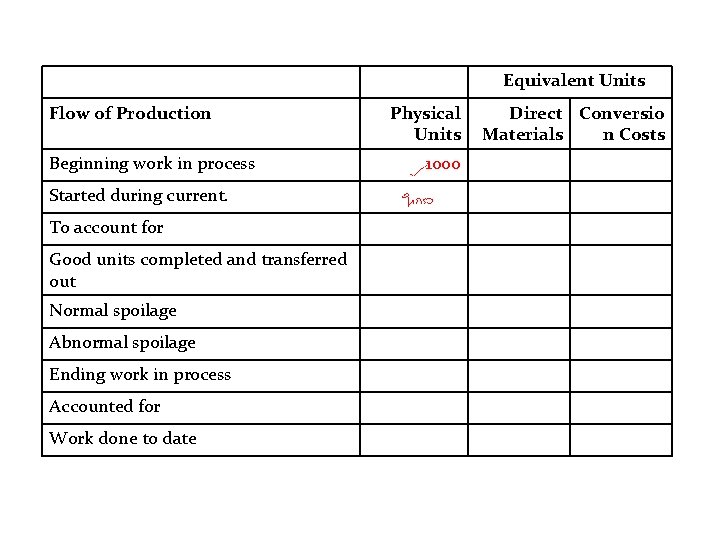
Equivalent Units Flow of Production Beginning work in process Started during current. To account for Good units completed and transferred out Normal spoilage Abnormal spoilage Ending work in process Accounted for Work done to date Physical Units 1000 Direct Conversio Materials n Costs
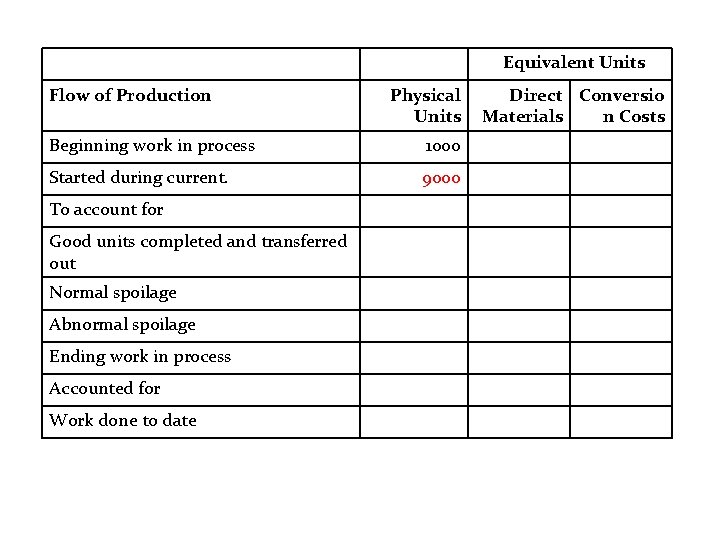
Equivalent Units Flow of Production Physical Units Beginning work in process 1000 Started during current. 9000 To account for Good units completed and transferred out Normal spoilage Abnormal spoilage Ending work in process Accounted for Work done to date Direct Conversio Materials n Costs
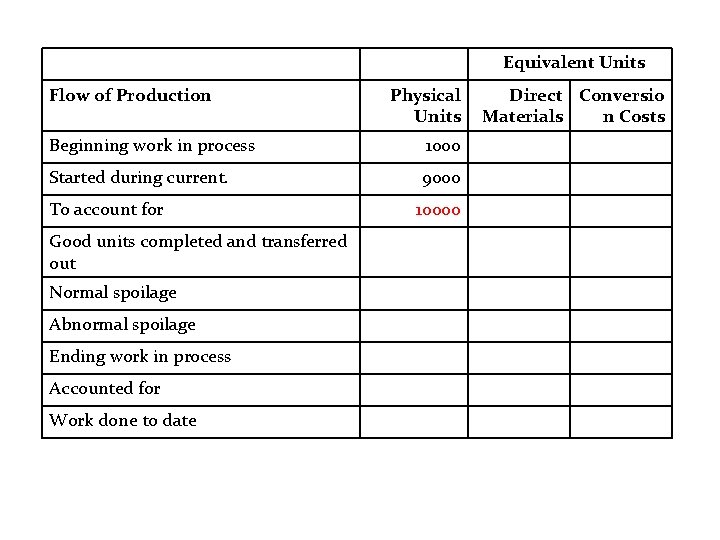
Equivalent Units Flow of Production Physical Units Beginning work in process 1000 Started during current. 9000 To account for Good units completed and transferred out Normal spoilage Abnormal spoilage Ending work in process Accounted for Work done to date 10000 Direct Conversio Materials n Costs
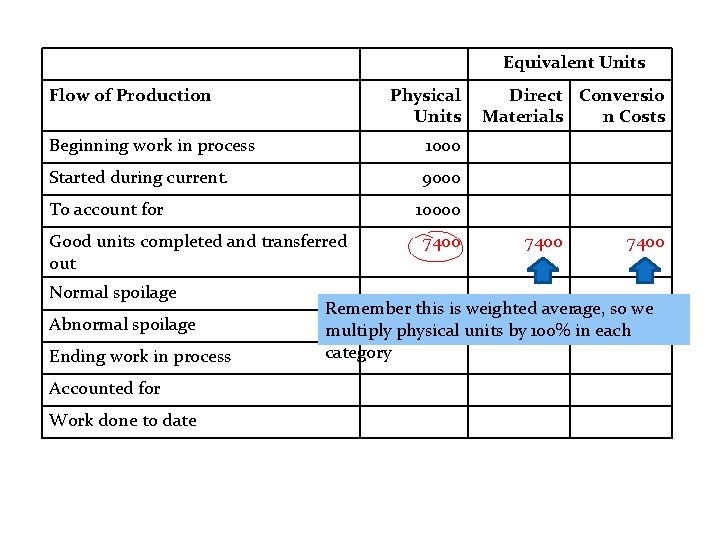
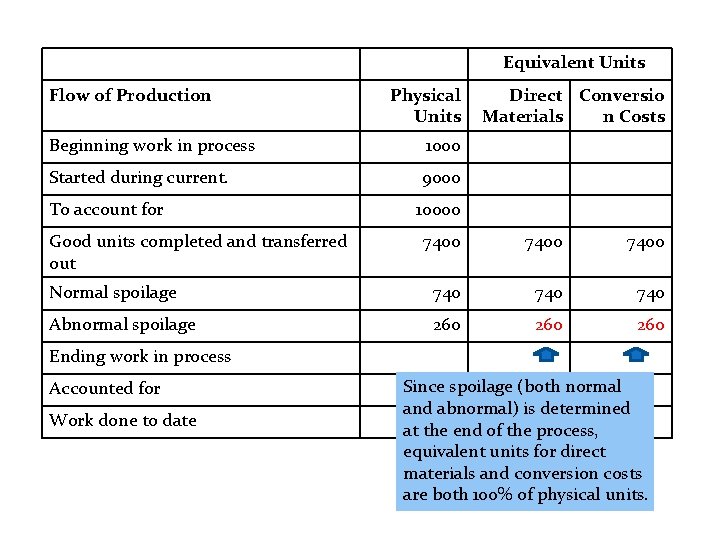
Equivalent Units Flow of Production Physical Units Beginning work in process 1000 Started during current. 9000 To account for 10000 Good units completed and transferred out Normal spoilage Abnormal spoilage Ending work in process Accounted for Work done to date Direct Conversio Materials n Costs 7400 Remember this is weighted average, so we multiply physical units by 100% in each category
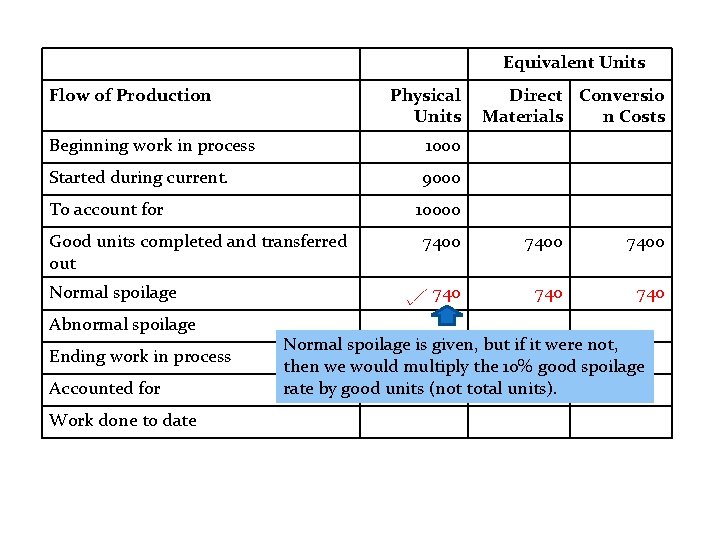
Equivalent Units Flow of Production Physical Units Beginning work in process 1000 Started during current. 9000 To account for 10000 Good units completed and transferred out Normal spoilage Abnormal spoilage Ending work in process Accounted for Work done to date Direct Conversio Materials n Costs 7400 740 740 Normal spoilage is given, but if it were not, then we would multiply the 10% good spoilage rate by good units (not total units).
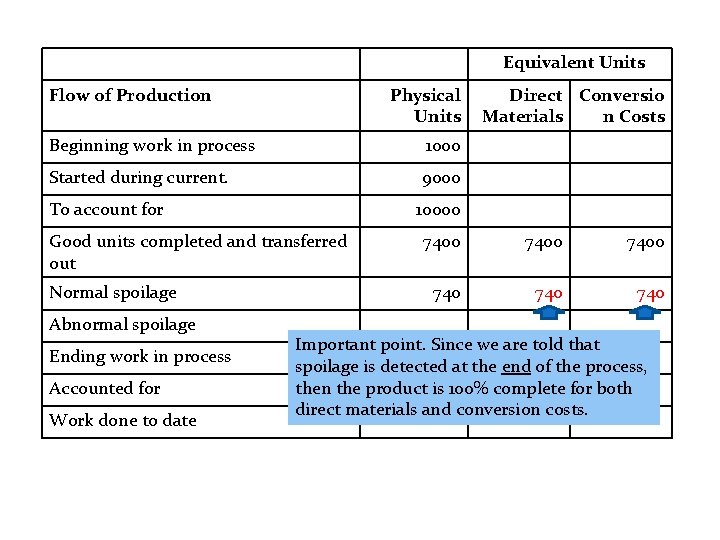
Equivalent Units Flow of Production Physical Units Beginning work in process 1000 Started during current. 9000 To account for 10000 Good units completed and transferred out Normal spoilage Abnormal spoilage Ending work in process Accounted for Work done to date Direct Conversio Materials n Costs 7400 740 740 Important point. Since we are told that spoilage is detected at the end of the process, then the product is 100% complete for both direct materials and conversion costs.
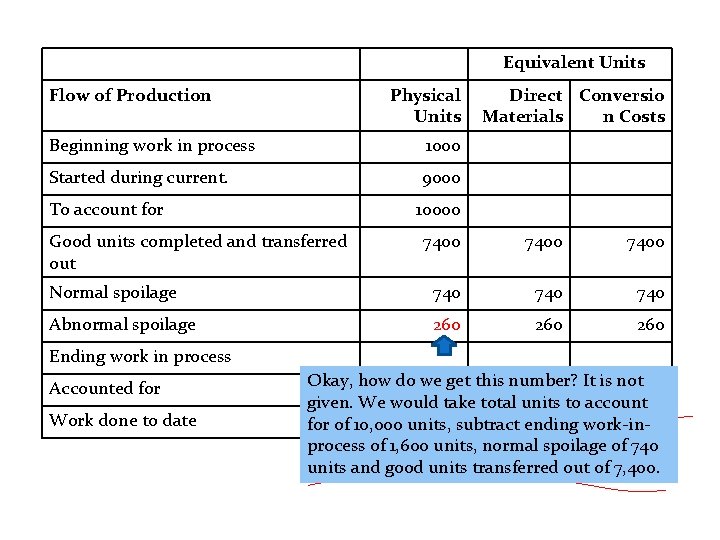
Equivalent Units Flow of Production Physical Units Beginning work in process 1000 Started during current. 9000 To account for Direct Conversio Materials n Costs 10000 Good units completed and transferred out 7400 Normal spoilage 740 740 Abnormal spoilage 260 260 Ending work in process Accounted for Work done to date Okay, how do we get this number? It is not given. We would take total units to account for of 10, 000 units, subtract ending work-inprocess of 1, 600 units, normal spoilage of 740 units and good units transferred out of 7, 400.
Equivalent Units Flow of Production Physical Units Beginning work in process 1000 Started during current. 9000 To account for Good units completed and transferred out Direct Conversio Materials n Costs 10000 7400 Normal spoilage 740 740 Abnormal spoilage 260 260 Ending work in process Accounted for Work done to date Since spoilage (both normal and abnormal) is determined at the end of the process, equivalent units for direct materials and conversion costs are both 100% of physical units.
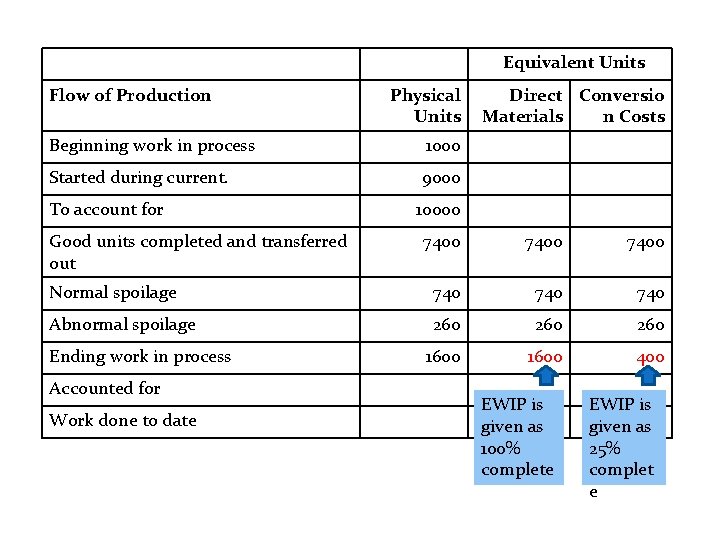
Equivalent Units Flow of Production Physical Units Beginning work in process 1000 Started during current. 9000 To account for Good units completed and transferred out Direct Conversio Materials n Costs 10000 7400 Normal spoilage 740 740 Abnormal spoilage 260 260 1600 400 Ending work in process Accounted for Work done to date EWIP is given as 100% complete EWIP is given as 25% complet e
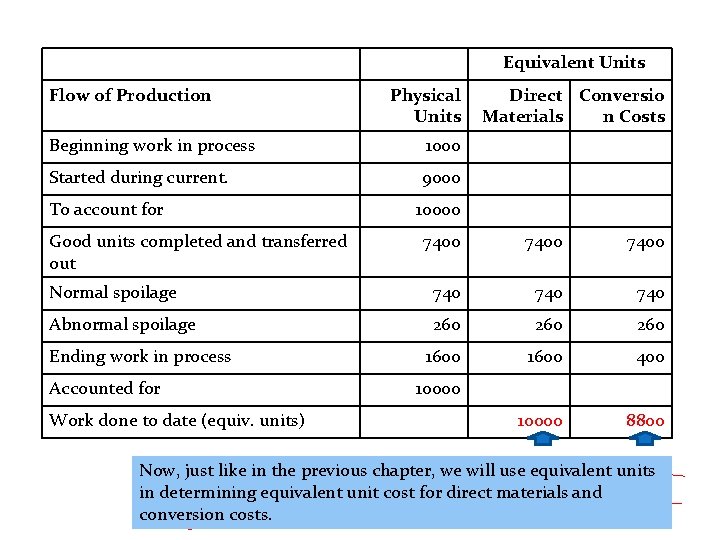
Equivalent Units Flow of Production Physical Units Beginning work in process 1000 Started during current. 9000 To account for Good units completed and transferred out Direct Conversio Materials n Costs 10000 7400 Normal spoilage 740 740 Abnormal spoilage 260 260 1600 400 10000 8800 Ending work in process Accounted for Work done to date (equiv. units) 10000 Now, just like in the previous chapter, we will use equivalent units in determining equivalent unit cost for direct materials and conversion costs.
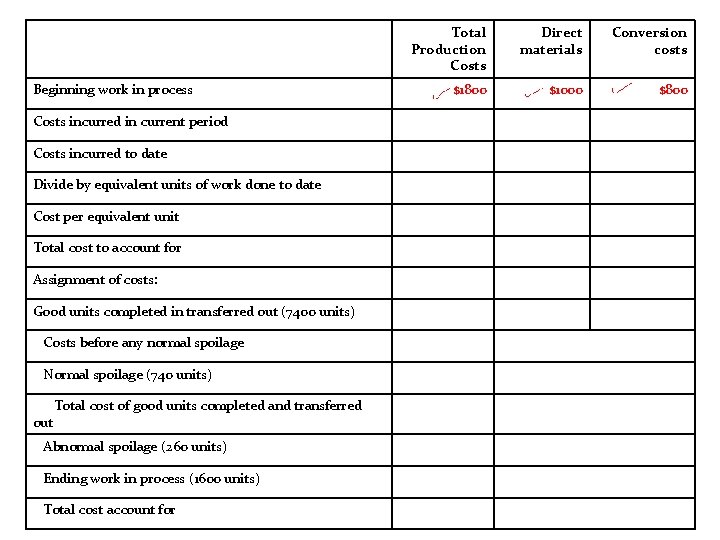
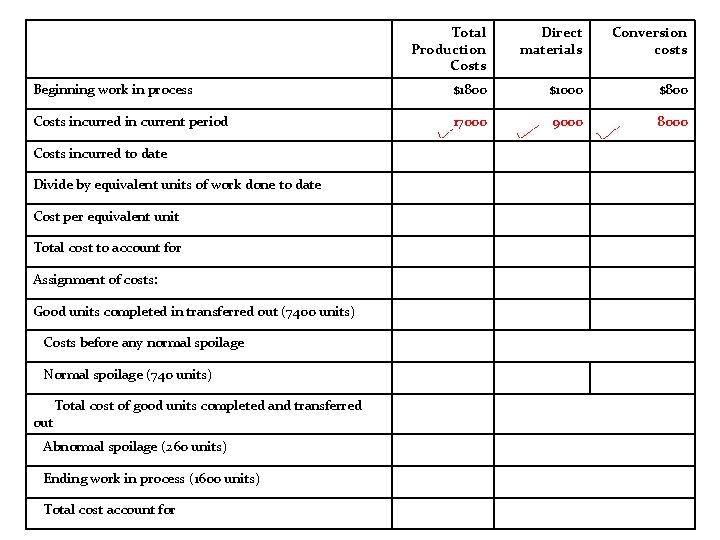
Beginning work in process Costs incurred in current period Costs incurred to date Divide by equivalent units of work done to date Cost per equivalent unit Total cost to account for Assignment of costs: Good units completed in transferred out (7400 units) Costs before any normal spoilage Normal spoilage (740 units) out Total cost of good units completed and transferred Abnormal spoilage (260 units) Ending work in process (1600 units) Total cost account for Total Production Costs Direct materials Conversion costs $1800 $1000 $800
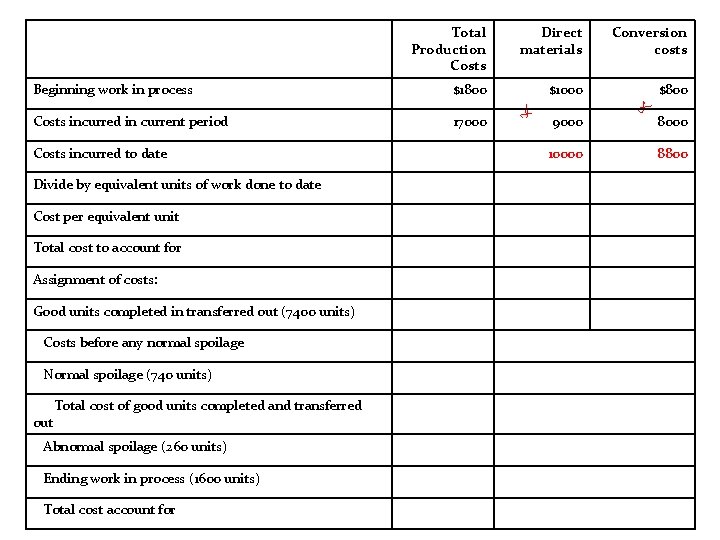
Total Production Costs Direct materials Conversion costs Beginning work in process $1800 $1000 $800 Costs incurred in current period 17000 9000 8000 Costs incurred to date Divide by equivalent units of work done to date Cost per equivalent unit Total cost to account for Assignment of costs: Good units completed in transferred out (7400 units) Costs before any normal spoilage Normal spoilage (740 units) out Total cost of good units completed and transferred Abnormal spoilage (260 units) Ending work in process (1600 units) Total cost account for
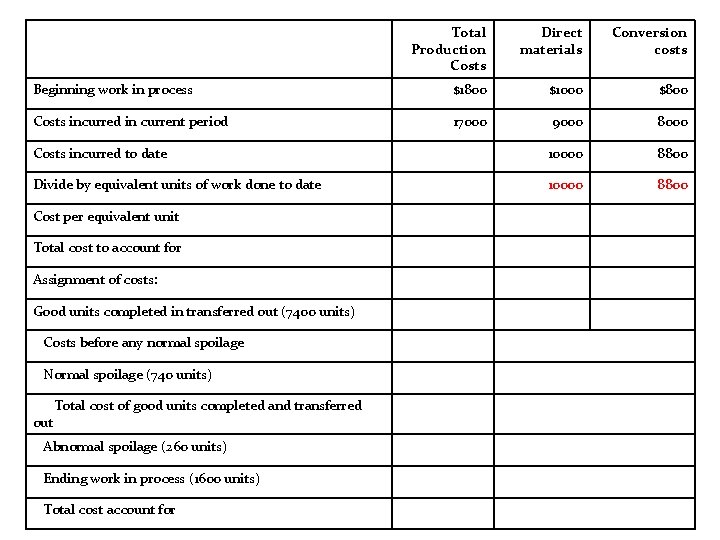
Total Production Costs Direct materials Conversion costs Beginning work in process $1800 $1000 $800 Costs incurred in current period 17000 9000 8000 10000 8800 Costs incurred to date Divide by equivalent units of work done to date Cost per equivalent unit Total cost to account for Assignment of costs: Good units completed in transferred out (7400 units) Costs before any normal spoilage Normal spoilage (740 units) out Total cost of good units completed and transferred Abnormal spoilage (260 units) Ending work in process (1600 units) Total cost account for
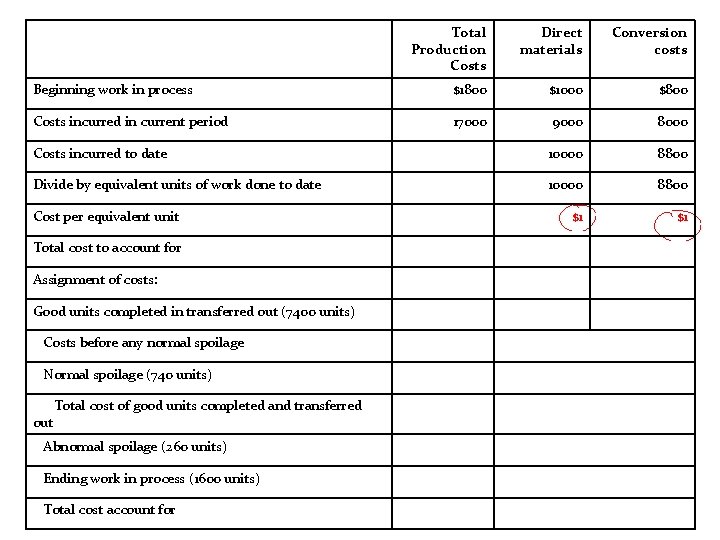
Total Production Costs Direct materials Conversion costs Beginning work in process $1800 $1000 $800 Costs incurred in current period 17000 9000 8000 Costs incurred to date 10000 8800 Divide by equivalent units of work done to date 10000 8800 Cost per equivalent unit Total cost to account for Assignment of costs: Good units completed in transferred out (7400 units) Costs before any normal spoilage Normal spoilage (740 units) out Total cost of good units completed and transferred Abnormal spoilage (260 units) Ending work in process (1600 units) Total cost account for
Total Production Costs Direct materials Conversion costs Beginning work in process $1800 $1000 $800 Costs incurred in current period 17000 9000 8000 Costs incurred to date 10000 8800 Divide by equivalent units of work done to date 10000 8800 $1 $1 Cost per equivalent unit Total cost to account for Assignment of costs: Good units completed in transferred out (7400 units) Costs before any normal spoilage Normal spoilage (740 units) out Total cost of good units completed and transferred Abnormal spoilage (260 units) Ending work in process (1600 units) Total cost account for
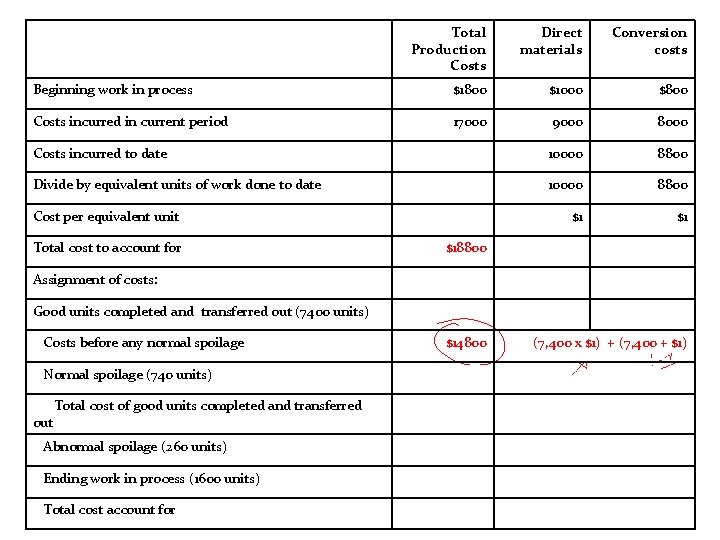
Total Production Costs Direct materials Conversion costs Beginning work in process $1800 $1000 $800 Costs incurred in current period 17000 9000 8000 Costs incurred to date 10000 8800 Divide by equivalent units of work done to date 10000 8800 $1 $1 Cost per equivalent unit Total cost to account for $18800 Assignment of costs: Good units completed and transferred out (7400 units) Costs before any normal spoilage Normal spoilage (740 units) out Total cost of good units completed and transferred Abnormal spoilage (260 units) Ending work in process (1600 units) Total cost account for $14800 (7, 400 x $1) + (7, 400 + $1)
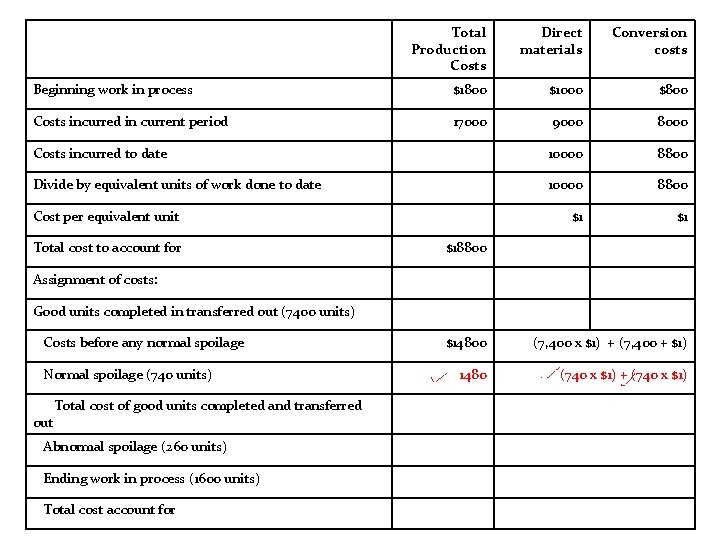
Total Production Costs Direct materials Conversion costs Beginning work in process $1800 $1000 $800 Costs incurred in current period 17000 9000 8000 Costs incurred to date 10000 8800 Divide by equivalent units of work done to date 10000 8800 $1 $1 Cost per equivalent unit Total cost to account for $18800 Assignment of costs: Good units completed in transferred out (7400 units) Costs before any normal spoilage Normal spoilage (740 units) out Total cost of good units completed and transferred Abnormal spoilage (260 units) Ending work in process (1600 units) Total cost account for $14800 (7, 400 x $1) + (7, 400 + $1) 1480 (740 x $1) + (740 x $1)
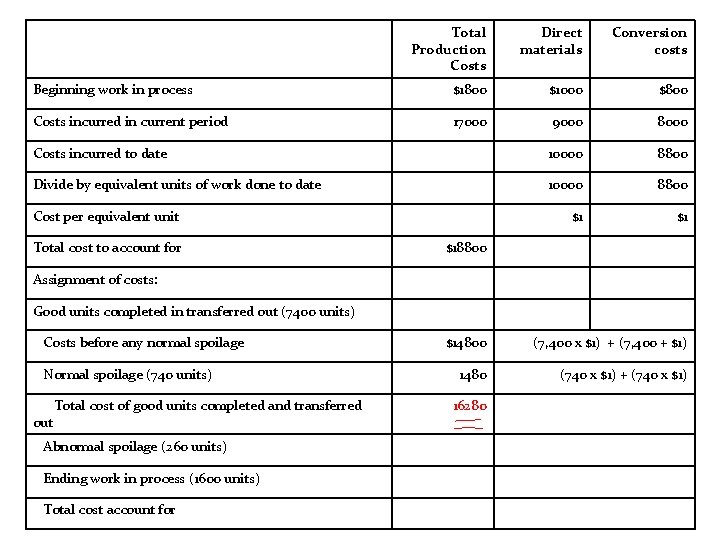
Total Production Costs Direct materials Conversion costs Beginning work in process $1800 $1000 $800 Costs incurred in current period 17000 9000 8000 Costs incurred to date 10000 8800 Divide by equivalent units of work done to date 10000 8800 $1 $1 Cost per equivalent unit Total cost to account for $18800 Assignment of costs: Good units completed in transferred out (7400 units) Costs before any normal spoilage Normal spoilage (740 units) out Total cost of good units completed and transferred Abnormal spoilage (260 units) Ending work in process (1600 units) Total cost account for $14800 (7, 400 x $1) + (7, 400 + $1) 1480 (740 x $1) + (740 x $1) 16280
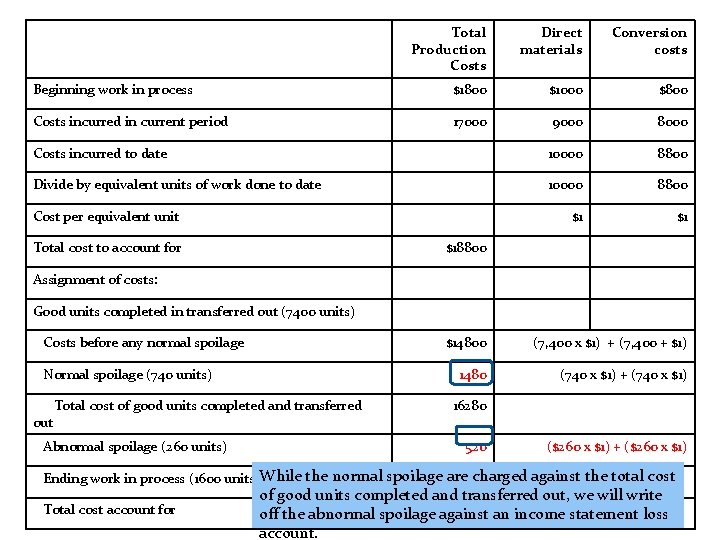
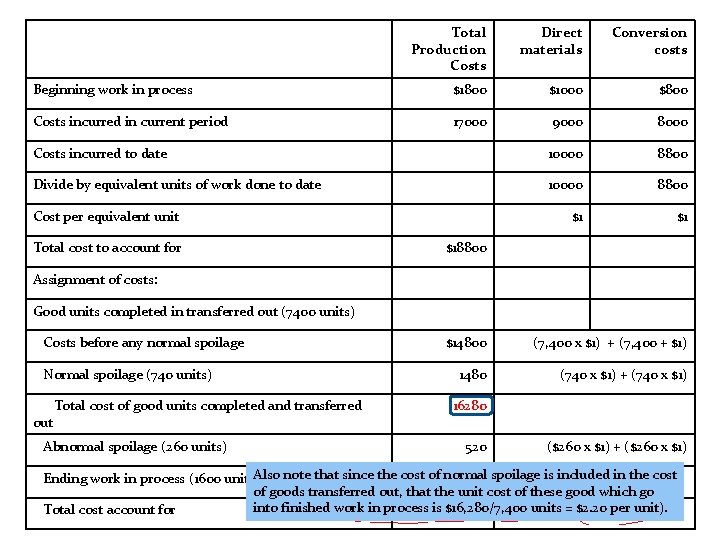
Total Production Costs Direct materials Conversion costs Beginning work in process $1800 $1000 $800 Costs incurred in current period 17000 9000 8000 Costs incurred to date 10000 8800 Divide by equivalent units of work done to date 10000 8800 $1 $1 Cost per equivalent unit Total cost to account for $18800 Assignment of costs: Good units completed in transferred out (7400 units) Costs before any normal spoilage Normal spoilage (740 units) out Total cost of good units completed and transferred Abnormal spoilage (260 units) $14800 (7, 400 x $1) + (7, 400 + $1) 1480 (740 x $1) + (740 x $1) 16280 520 ($260 x $1) + ($260 x $1) Ending work in process (1600 units)While the normal spoilage are charged against the total cost Total cost account for of good units completed and transferred out, we will write off the abnormal spoilage against an income statement loss account.
Total Production Costs Direct materials Conversion costs Beginning work in process $1800 $1000 $800 Costs incurred in current period 17000 9000 8000 Costs incurred to date 10000 8800 Divide by equivalent units of work done to date 10000 8800 $1 $1 Cost per equivalent unit Total cost to account for $18800 Assignment of costs: Good units completed in transferred out (7400 units) Costs before any normal spoilage Normal spoilage (740 units) out Total cost of good units completed and transferred Abnormal spoilage (260 units) $14800 (7, 400 x $1) + (7, 400 + $1) 1480 (740 x $1) + (740 x $1) 16280 520 ($260 x $1) + ($260 x $1) Ending work in process (1600 units)Also note that since the cost of normal spoilage is included in the cost of goods transferred out, that the unit cost of these good which go into finished work in process is $16, 280/7, 400 units = $2. 20 per unit). Total cost account for
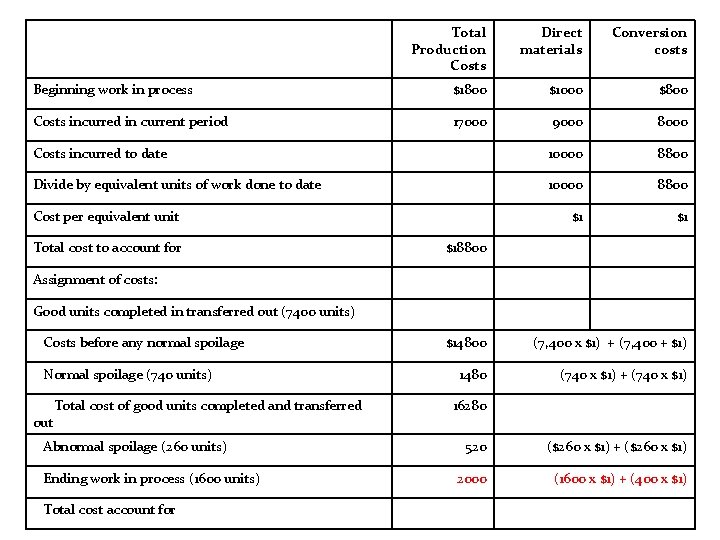
Total Production Costs Direct materials Conversion costs Beginning work in process $1800 $1000 $800 Costs incurred in current period 17000 9000 8000 Costs incurred to date 10000 8800 Divide by equivalent units of work done to date 10000 8800 $1 $1 Cost per equivalent unit Total cost to account for $18800 Assignment of costs: Good units completed in transferred out (7400 units) Costs before any normal spoilage Normal spoilage (740 units) out Total cost of good units completed and transferred Abnormal spoilage (260 units) Ending work in process (1600 units) Total cost account for $14800 (7, 400 x $1) + (7, 400 + $1) 1480 (740 x $1) + (740 x $1) 16280 520 ($260 x $1) + ($260 x $1) 2000 (1600 x $1) + (400 x $1)
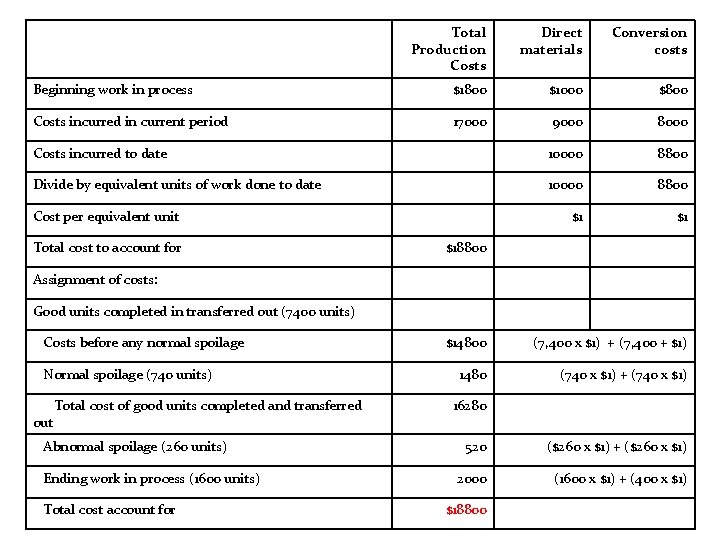
Total Production Costs Direct materials Conversion costs Beginning work in process $1800 $1000 $800 Costs incurred in current period 17000 9000 8000 Costs incurred to date 10000 8800 Divide by equivalent units of work done to date 10000 8800 $1 $1 Cost per equivalent unit Total cost to account for $18800 Assignment of costs: Good units completed in transferred out (7400 units) Costs before any normal spoilage Normal spoilage (740 units) out Total cost of good units completed and transferred Abnormal spoilage (260 units) Ending work in process (1600 units) Total cost account for $14800 (7, 400 x $1) + (7, 400 + $1) 1480 (740 x $1) + (740 x $1) 16280 520 ($260 x $1) + ($260 x $1) 2000 (1600 x $1) + (400 x $1) $18800
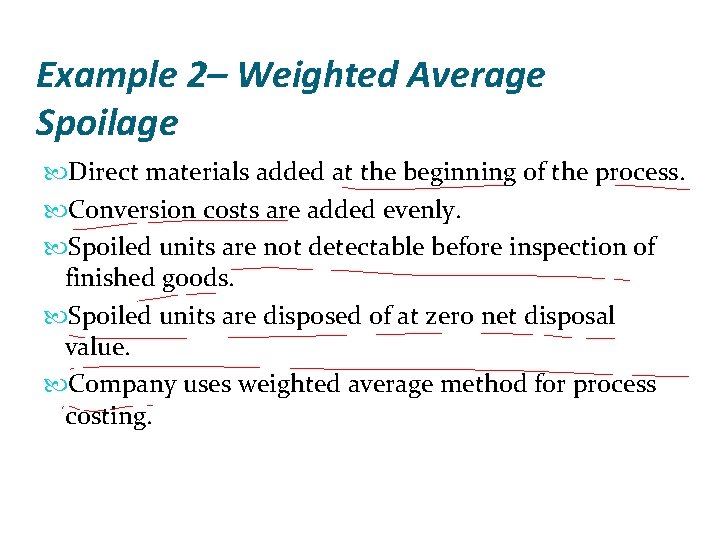
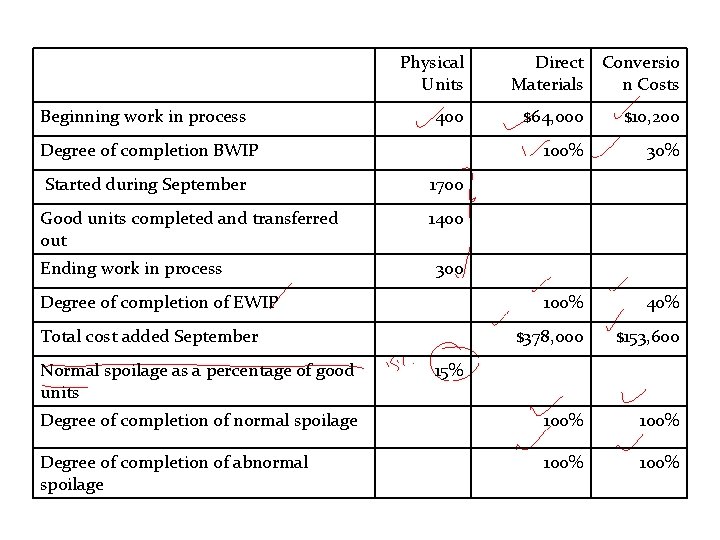
Example 2– Weighted Average Spoilage Direct materials added at the beginning of the process. Conversion costs are added evenly. Spoiled units are not detectable before inspection of finished goods. Spoiled units are disposed of at zero net disposal value. Company uses weighted average method for process costing.
Physical Units Beginning work in process 400 Direct Conversio Materials n Costs $64, 000 $10, 200 100% 30% 100% 40% $378, 000 $153, 600 Degree of completion of normal spoilage 100% Degree of completion of abnormal spoilage 100% Degree of completion BWIP Started during September 1700 Good units completed and transferred out 1400 Ending work in process 300 Degree of completion of EWIP Total cost added September Normal spoilage as a percentage of good units 15%
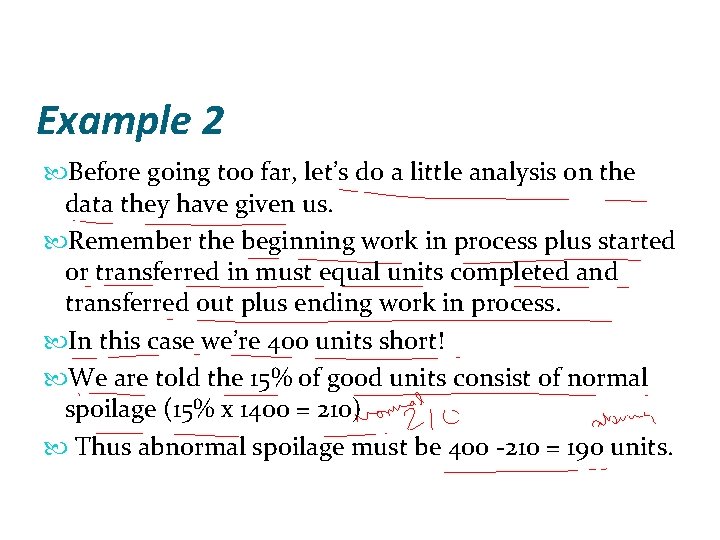
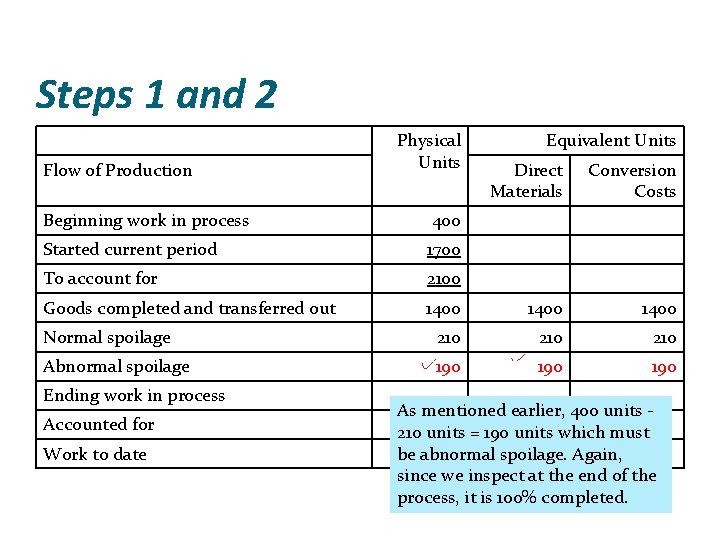
Example 2 Before going too far, let’s do a little analysis on the data they have given us. Remember the beginning work in process plus started or transferred in must equal units completed and transferred out plus ending work in process. In this case we’re 400 units short! We are told the 15% of good units consist of normal spoilage (15% x 1400 = 210) Thus abnormal spoilage must be 400 -210 = 190 units.
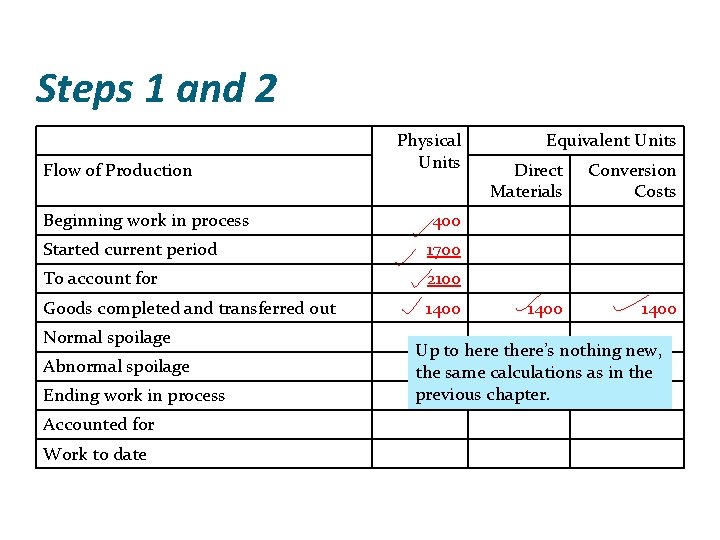
Steps 1 and 2 Flow of Production Physical Units Beginning work in process 400 Started current period 1700 To account for 2100 Goods completed and transferred out 1400 Normal spoilage Abnormal spoilage Ending work in process Accounted for Work to date Equivalent Units Direct Materials Conversion Costs 1400 Up to here there’s nothing new, the same calculations as in the previous chapter.
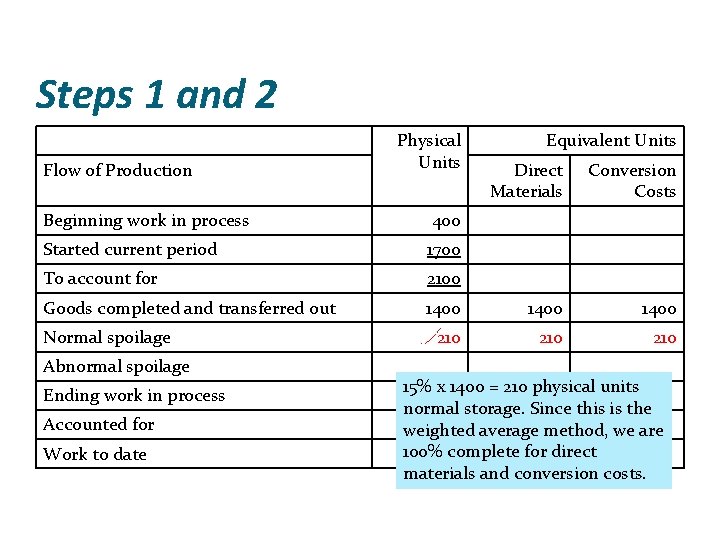
Steps 1 and 2 Flow of Production Physical Units Equivalent Units Direct Materials Conversion Costs Beginning work in process 400 Started current period 1700 To account for 2100 Goods completed and transferred out 1400 210 210 Normal spoilage Abnormal spoilage Ending work in process Accounted for Work to date 15% x 1400 = 210 physical units normal storage. Since this is the weighted average method, we are 100% complete for direct materials and conversion costs.
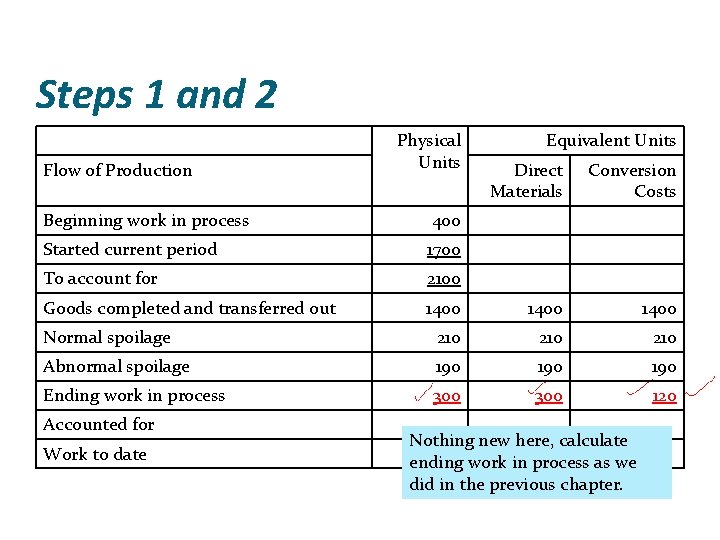
Steps 1 and 2 Flow of Production Physical Units Equivalent Units Direct Materials Conversion Costs Beginning work in process 400 Started current period 1700 To account for 2100 Goods completed and transferred out 1400 Normal spoilage 210 210 Abnormal spoilage 190 190 Ending work in process Accounted for Work to date As mentioned earlier, 400 units 210 units = 190 units which must be abnormal spoilage. Again, since we inspect at the end of the process, it is 100% completed.
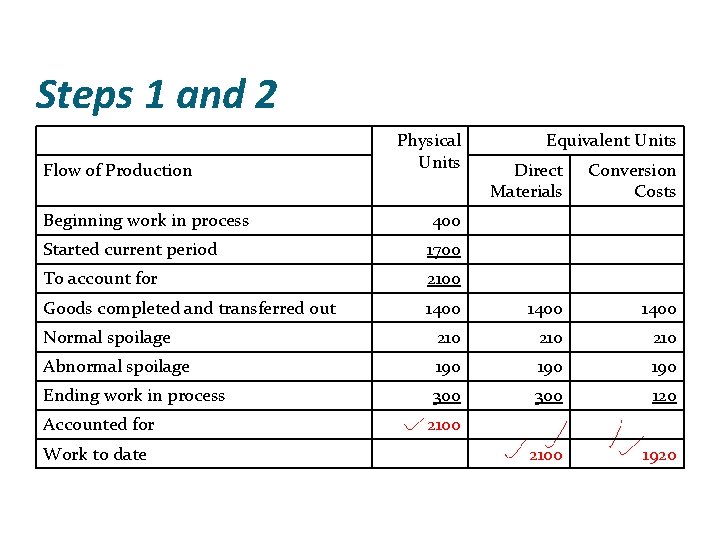
Steps 1 and 2 Flow of Production Physical Units Equivalent Units Direct Materials Conversion Costs Beginning work in process 400 Started current period 1700 To account for 2100 Goods completed and transferred out 1400 Normal spoilage 210 210 Abnormal spoilage 190 190 Ending work in process 300 120 Accounted for Work to date Nothing new here, calculate ending work in process as we did in the previous chapter.
Steps 1 and 2 Flow of Production Physical Units Equivalent Units Direct Materials Conversion Costs Beginning work in process 400 Started current period 1700 To account for 2100 Goods completed and transferred out 1400 Normal spoilage 210 210 Abnormal spoilage 190 190 Ending work in process 300 120 2100 1920 Accounted for Work to date 2100
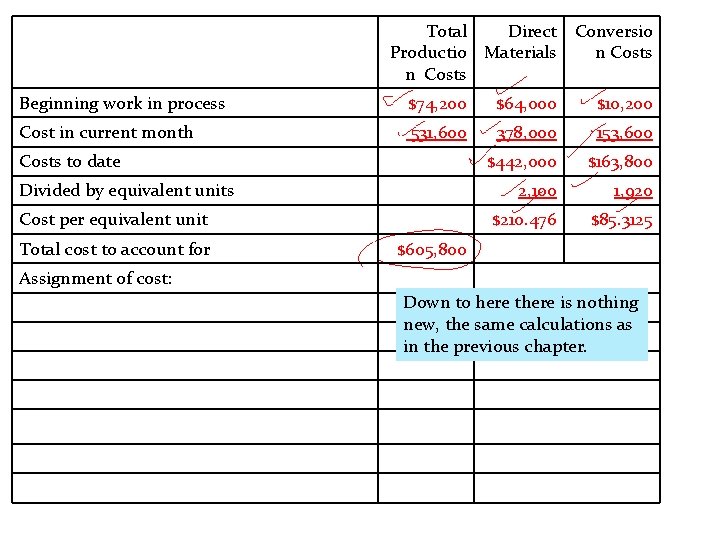
Total Direct Conversio Productio Materials n Costs Beginning work in process $74, 200 $64, 000 $10, 200 Cost in current month 531, 600 378, 000 153, 600 $442, 000 $163, 800 2, 100 1, 920 $210. 476 $85. 3125 Costs to date Divided by equivalent units Cost per equivalent unit Total cost to account for $605, 800 Assignment of cost: Down to here there is nothing new, the same calculations as in the previous chapter.
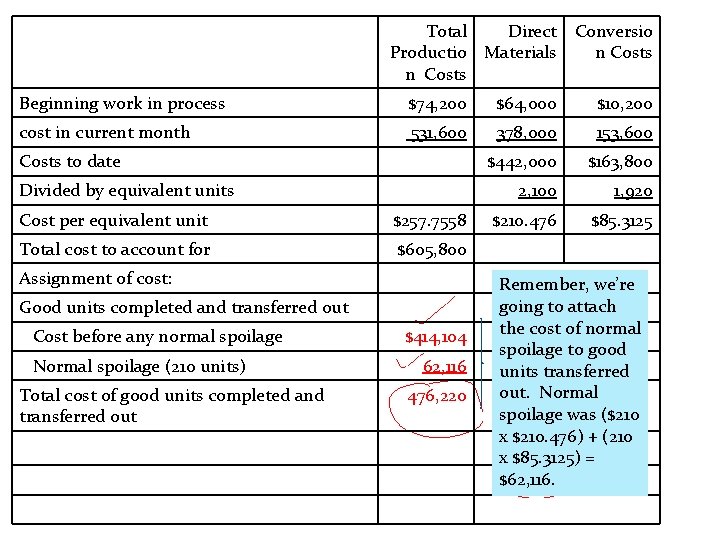
Total Direct Conversio Productio Materials n Costs Beginning work in process $74, 200 $64, 000 $10, 200 cost in current month 531, 600 378, 000 153, 600 $442, 000 $163, 800 2, 100 1, 920 $210. 476 $85. 3125 Costs to date Divided by equivalent units Cost per equivalent unit $257. 7558 Total cost to account for $605, 800 Assignment of cost: Good units completed and transferred out Cost before any normal spoilage Normal spoilage (210 units) Total cost of good units completed and transferred out $414, 104 62, 116 476, 220 Remember, we’re going to attach the cost of normal spoilage to good units transferred out. Normal spoilage was ($210 x $210. 476) + (210 x $85. 3125) = $62, 116.
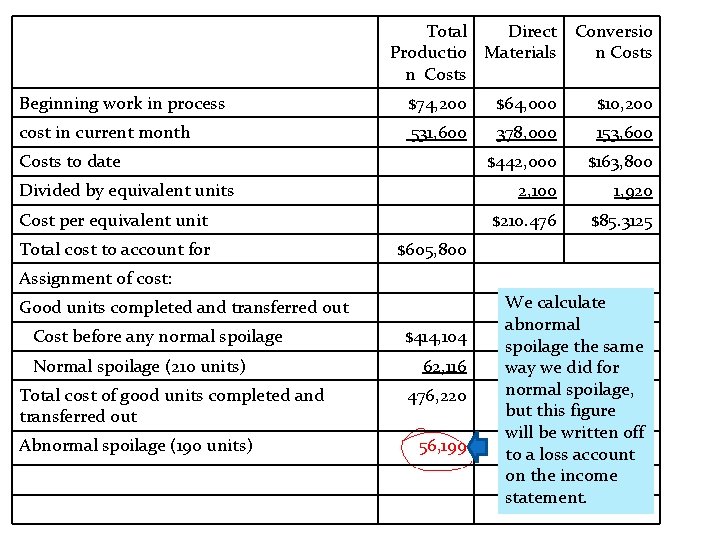
Total Direct Conversio Productio Materials n Costs Beginning work in process $74, 200 $64, 000 $10, 200 cost in current month 531, 600 378, 000 153, 600 $442, 000 $163, 800 2, 100 1, 920 $210. 476 $85. 3125 Costs to date Divided by equivalent units Cost per equivalent unit Total cost to account for $605, 800 Assignment of cost: Good units completed and transferred out Cost before any normal spoilage Normal spoilage (210 units) Total cost of good units completed and transferred out Abnormal spoilage (190 units) $414, 104 62, 116 476, 220 56, 199 We calculate abnormal spoilage the same way we did for normal spoilage, but this figure will be written off to a loss account on the income statement.
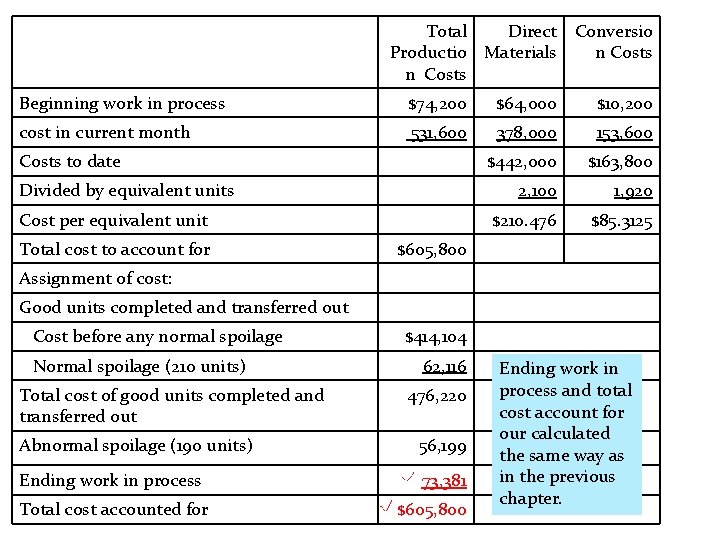
Total Direct Conversio Productio Materials n Costs Beginning work in process $74, 200 $64, 000 $10, 200 cost in current month 531, 600 378, 000 153, 600 $442, 000 $163, 800 2, 100 1, 920 $210. 476 $85. 3125 Costs to date Divided by equivalent units Cost per equivalent unit Total cost to account for $605, 800 Assignment of cost: Good units completed and transferred out Cost before any normal spoilage Normal spoilage (210 units) Total cost of good units completed and transferred out $414, 104 62, 116 476, 220 Abnormal spoilage (190 units) 56, 199 Ending work in process 73, 381 Total cost accounted for $605, 800 Ending work in process and total cost account for our calculated the same way as in the previous chapter.
Example 3 Refer to Example 3. Using the same information perform the same calculations using FIFO.
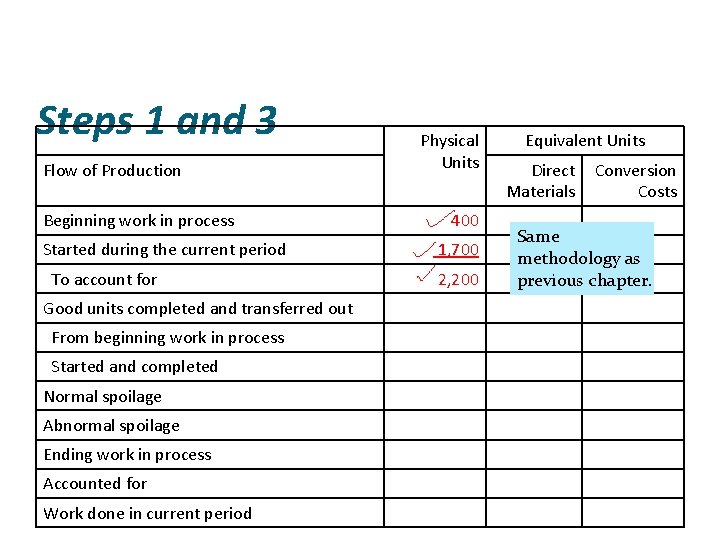
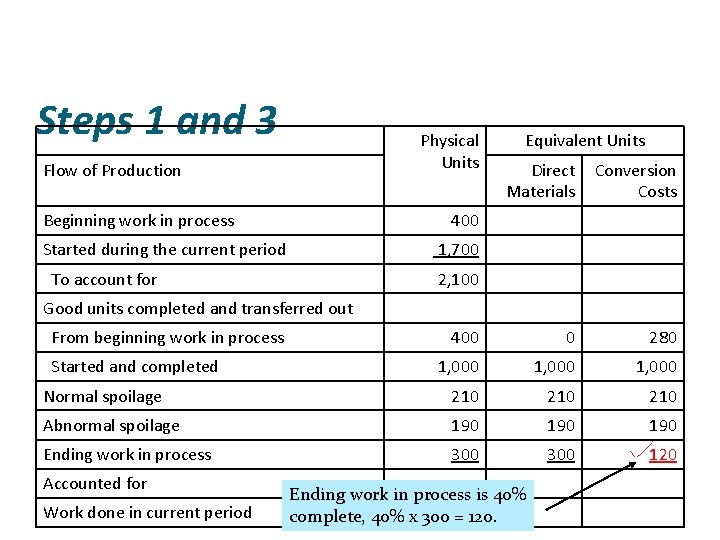
Steps 1 and 3 Flow of Production Beginning work in process Started during the current period To account for Good units completed and transferred out From beginning work in process Started and completed Normal spoilage Abnormal spoilage Ending work in process Accounted for Work done in current period Physical Units 400 1, 700 2, 200 Equivalent Units Direct Materials Conversion Costs Same methodology as previous chapter.
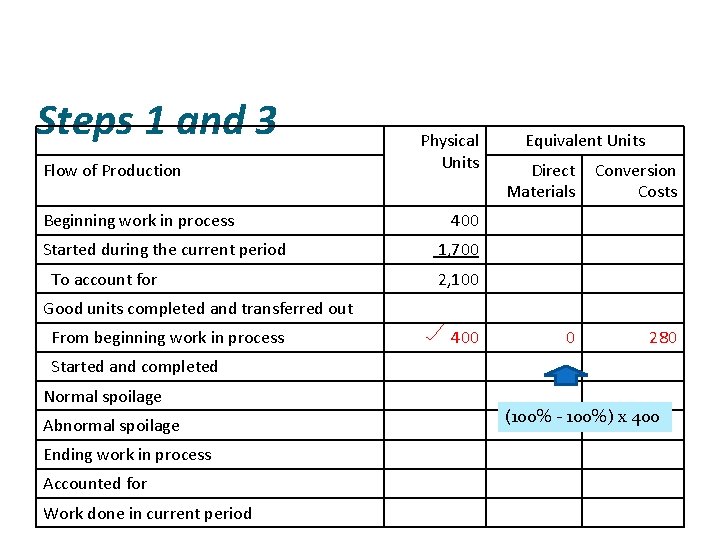
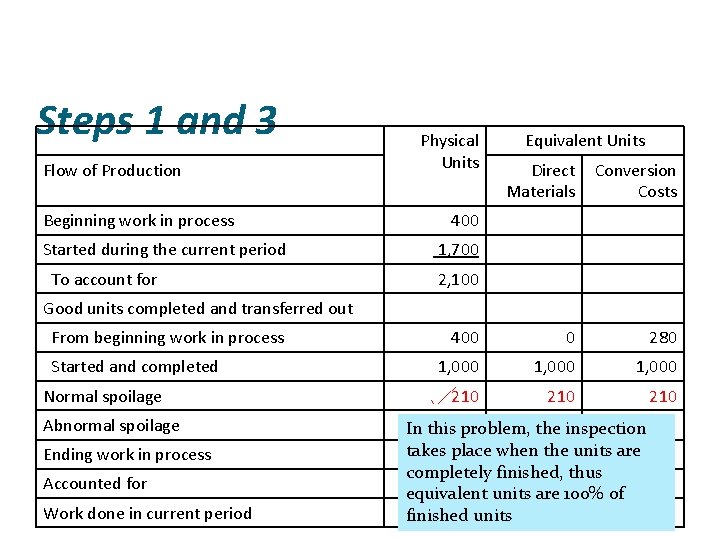
Steps 1 and 3 Flow of Production Beginning work in process Started during the current period To account for Physical Units Equivalent Units Direct Materials Conversion Costs 0 280 400 1, 700 2, 100 Good units completed and transferred out From beginning work in process 400 Started and completed Normal spoilage Abnormal spoilage Ending work in process Accounted for Work done in current period (100% - 100%) x 400
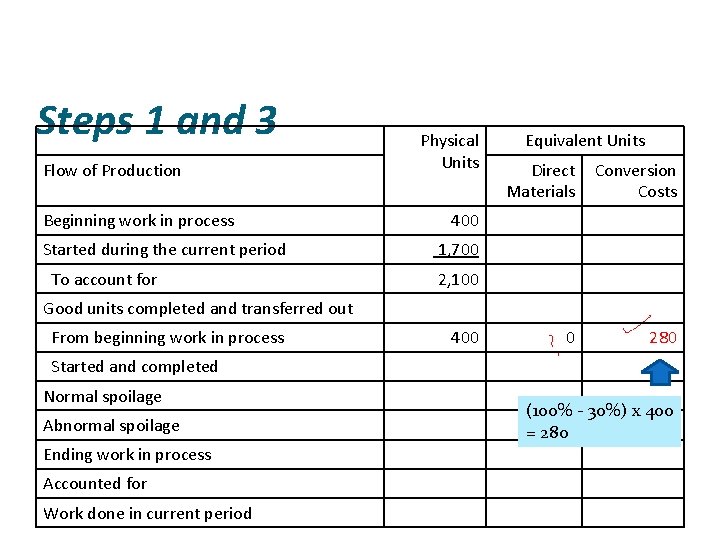
Steps 1 and 3 Flow of Production Beginning work in process Started during the current period To account for Physical Units Equivalent Units Direct Materials Conversion Costs 0 280 400 1, 700 2, 100 Good units completed and transferred out From beginning work in process 400 Started and completed Normal spoilage Abnormal spoilage Ending work in process Accounted for Work done in current period (100% - 30%) x 400 = 280
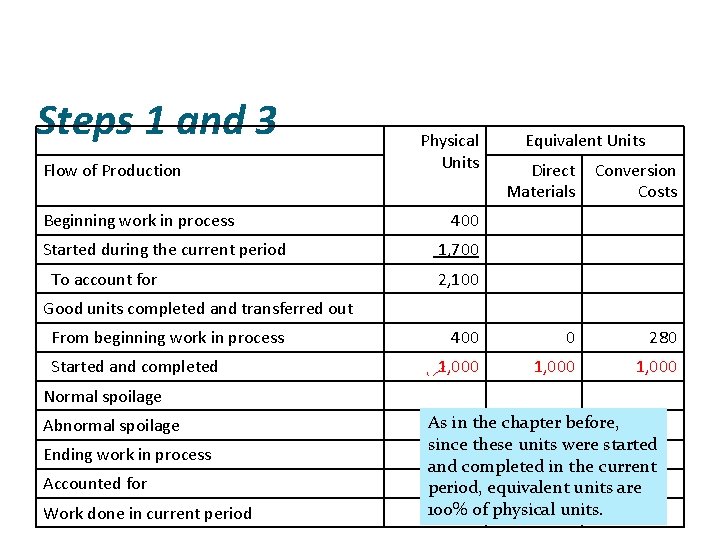
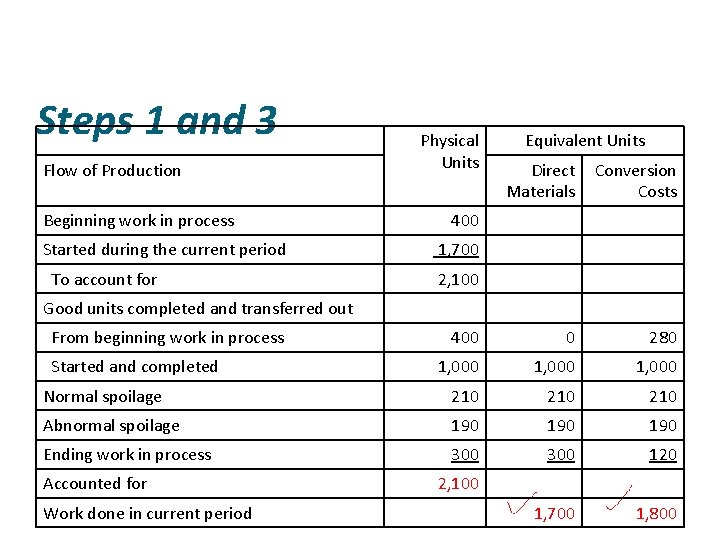
Steps 1 and 3 Flow of Production Beginning work in process Started during the current period To account for Physical Units Equivalent Units Direct Materials Conversion Costs 400 0 280 1, 000 400 1, 700 2, 100 Good units completed and transferred out From beginning work in process Started and completed Normal spoilage Abnormal spoilage Ending work in process Accounted for Work done in current period As in the chapter before, since these units were started and completed in the current period, equivalent units are 100% of physical units.
Steps 1 and 3 Flow of Production Beginning work in process Started during the current period To account for Physical Units Equivalent Units Direct Materials Conversion Costs 400 0 280 1, 000 210 210 400 1, 700 2, 100 Good units completed and transferred out From beginning work in process Started and completed Normal spoilage Abnormal spoilage Ending work in process Accounted for Work done in current period In this problem, the inspection takes place when the units are completely finished, thus equivalent units are 100% of finished units
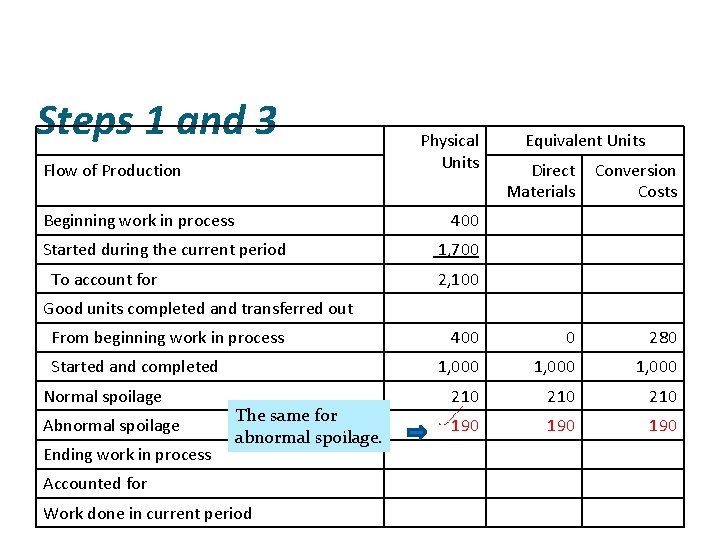
Steps 1 and 3 Flow of Production Beginning work in process Physical Units Equivalent Units Direct Materials Conversion Costs 400 0 280 1, 000 210 210 190 190 400 Started during the current period To account for 1, 700 2, 100 Good units completed and transferred out From beginning work in process Started and completed Normal spoilage Abnormal spoilage Ending work in process The same for abnormal spoilage. Accounted for Work done in current period
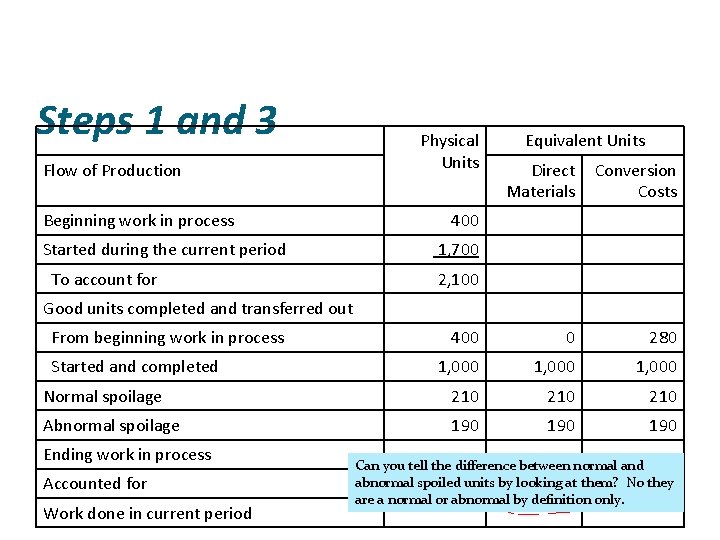
Steps 1 and 3 Flow of Production Physical Units Equivalent Units Direct Materials Conversion Costs 400 0 280 1, 000 Normal spoilage 210 210 Abnormal spoilage 190 190 Beginning work in process Started during the current period To account for 400 1, 700 2, 100 Good units completed and transferred out From beginning work in process Started and completed Ending work in process Accounted for Work done in current period Can you tell the difference between normal and abnormal spoiled units by looking at them? No they are a normal or abnormal by definition only.
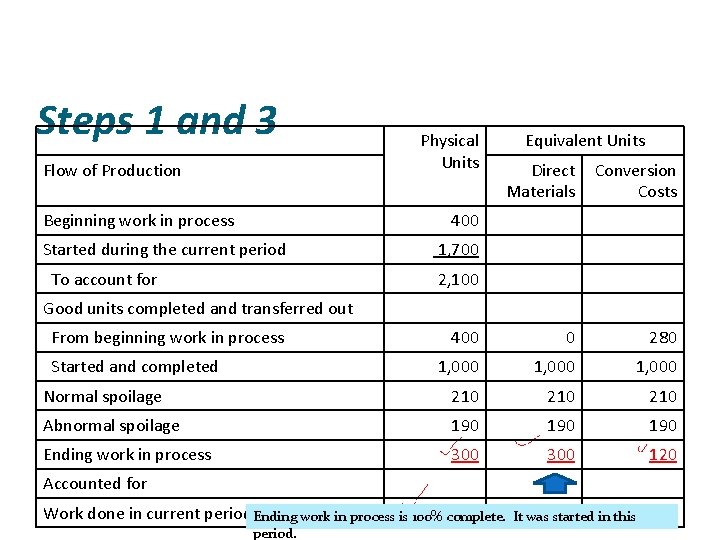
Steps 1 and 3 Flow of Production Physical Units Equivalent Units Direct Materials Conversion Costs 400 0 280 1, 000 Normal spoilage 210 210 Abnormal spoilage 190 190 Ending work in process 300 120 Beginning work in process 400 Started during the current period To account for 1, 700 2, 100 Good units completed and transferred out From beginning work in process Started and completed Accounted for Work done in current period Ending work in process is 100% complete. period. It was started in this
Steps 1 and 3 Physical Units Flow of Production Equivalent Units Direct Materials Conversion Costs 400 0 280 1, 000 Normal spoilage 210 210 Abnormal spoilage 190 190 Ending work in process 300 120 Beginning work in process 400 Started during the current period 1, 700 To account for 2, 100 Good units completed and transferred out From beginning work in process Started and completed Accounted for Work done in current period Ending work in process is 40% complete, 40% x 300 = 120.
Steps 1 and 3 Flow of Production Physical Units Equivalent Units Direct Materials Conversion Costs 400 0 280 1, 000 Normal spoilage 210 210 Abnormal spoilage 190 190 Ending work in process 300 120 1, 700 1, 800 Beginning work in process Started during the current period To account for 400 1, 700 2, 100 Good units completed and transferred out From beginning work in process Started and completed Accounted for Work done in current period 2, 100
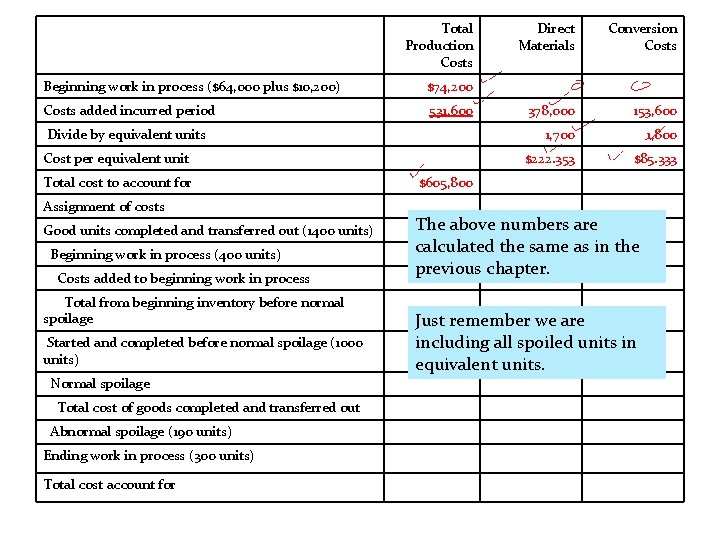
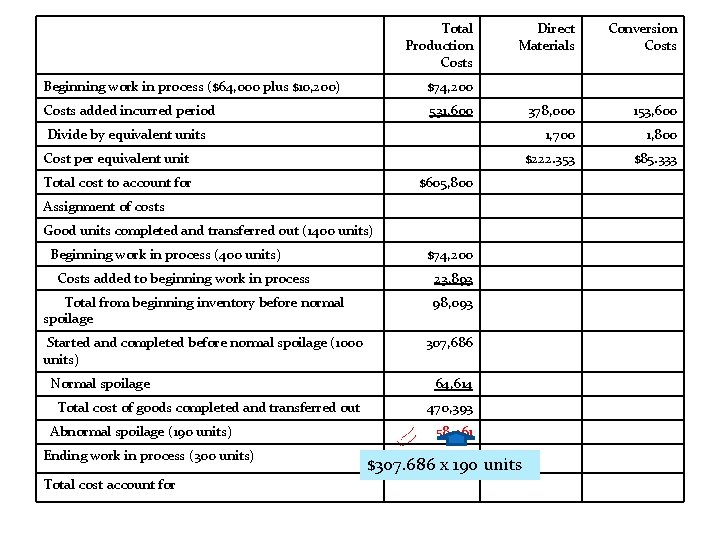
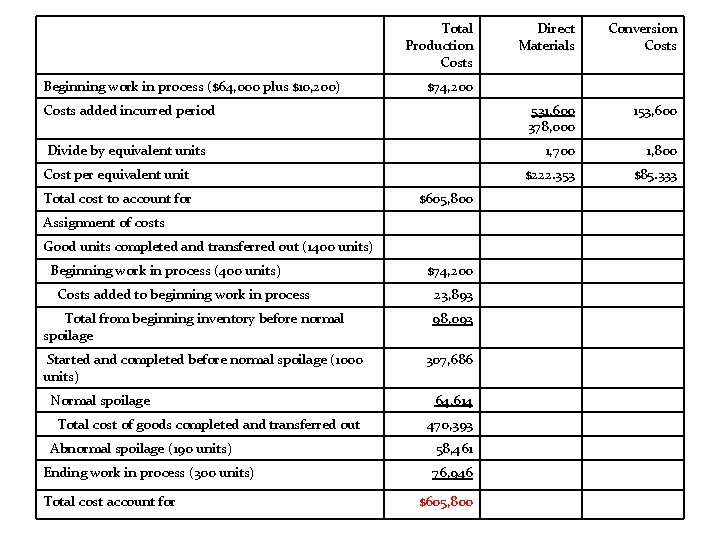
Total Production Costs Beginning work in process ($64, 000 plus $10, 200) $74, 200 Costs added incurred period 531, 600 Divide by equivalent units Cost per equivalent unit Total cost to account for Assignment of costs Good units completed and transferred out (1400 units) Beginning work in process (400 units) Costs added to beginning work in process Total from beginning inventory before normal spoilage Started and completed before normal spoilage (1000 units) Normal spoilage Total cost of goods completed and transferred out Abnormal spoilage (190 units) Ending work in process (300 units) Total cost account for Direct Materials Conversion Costs 378, 000 153, 600 1, 700 1, 800 $222. 353 $85. 333 $605, 800 The above numbers are calculated the same as in the previous chapter. Just remember we are including all spoiled units in equivalent units.
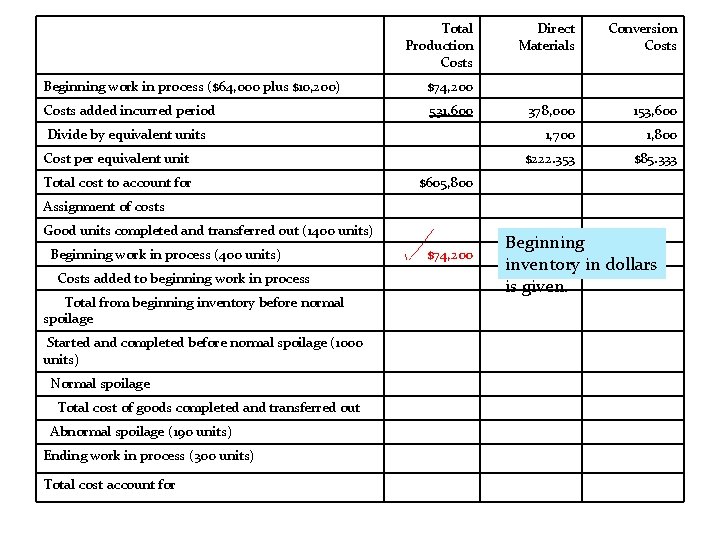
Total Production Costs Beginning work in process ($64, 000 plus $10, 200) $74, 200 Costs added incurred period 531, 600 Divide by equivalent units Cost per equivalent unit Total cost to account for Direct Materials Conversion Costs 378, 000 153, 600 1, 700 1, 800 $222. 353 $85. 333 $605, 800 Assignment of costs Good units completed and transferred out (1400 units) Beginning work in process (400 units) Costs added to beginning work in process Total from beginning inventory before normal spoilage Started and completed before normal spoilage (1000 units) Normal spoilage Total cost of goods completed and transferred out Abnormal spoilage (190 units) Ending work in process (300 units) Total cost account for $74, 200 Beginning inventory in dollars is given.
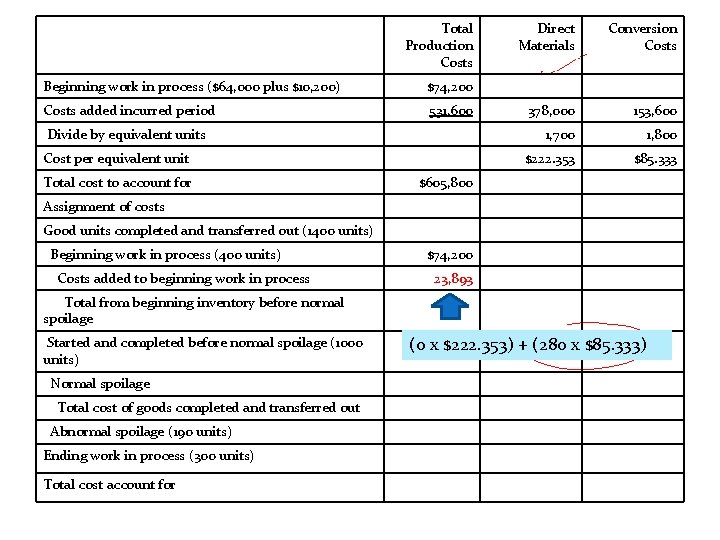
Total Production Costs Beginning work in process ($64, 000 plus $10, 200) $74, 200 Costs added incurred period 531, 600 Divide by equivalent units Cost per equivalent unit Total cost to account for Direct Materials Conversion Costs 378, 000 153, 600 1, 700 1, 800 $222. 353 $85. 333 $605, 800 Assignment of costs Good units completed and transferred out (1400 units) Beginning work in process (400 units) Costs added to beginning work in process $74, 200 23, 893 Total from beginning inventory before normal spoilage Started and completed before normal spoilage (1000 units) Normal spoilage Total cost of goods completed and transferred out Abnormal spoilage (190 units) Ending work in process (300 units) Total cost account for (0 x $222. 353) + (280 x $85. 333)
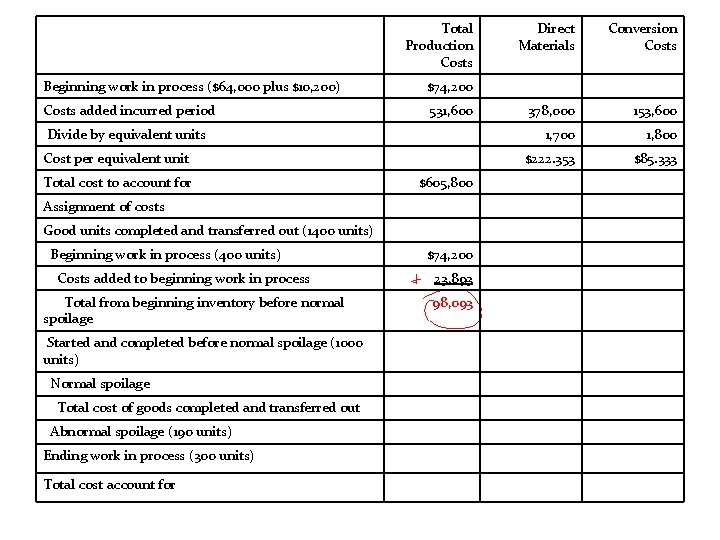
Total Production Costs Beginning work in process ($64, 000 plus $10, 200) $74, 200 Costs added incurred period 531, 600 Divide by equivalent units Cost per equivalent unit Total cost to account for $605, 800 Assignment of costs Good units completed and transferred out (1400 units) Beginning work in process (400 units) Costs added to beginning work in process Total from beginning inventory before normal spoilage Started and completed before normal spoilage (1000 units) Normal spoilage Total cost of goods completed and transferred out Abnormal spoilage (190 units) Ending work in process (300 units) Total cost account for $74, 200 23, 893 98, 093 Direct Materials Conversion Costs 378, 000 153, 600 1, 700 1, 800 $222. 353 $85. 333
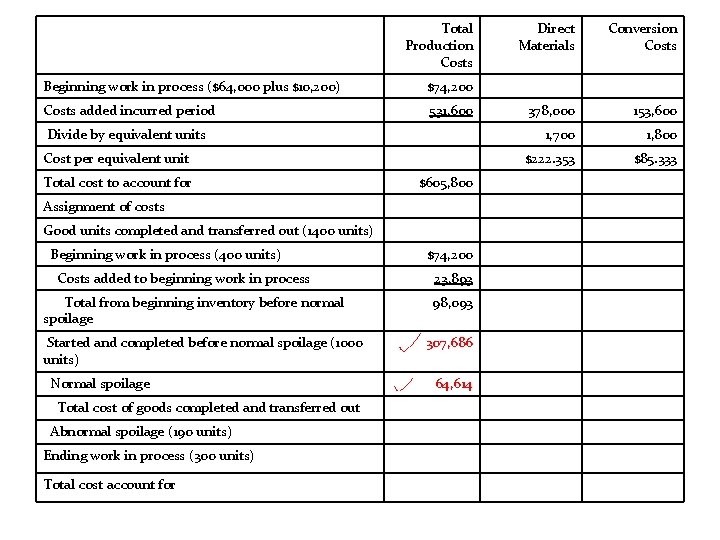
Total Production Costs Beginning work in process ($64, 000 plus $10, 200) $74, 200 Costs added incurred period 531, 600 Divide by equivalent units Cost per equivalent unit Total cost to account for $605, 800 Assignment of costs Good units completed and transferred out (1400 units) Beginning work in process (400 units) Costs added to beginning work in process Total from beginning inventory before normal spoilage Started and completed before normal spoilage (1000 units) Normal spoilage Total cost of goods completed and transferred out Abnormal spoilage (190 units) Ending work in process (300 units) Total cost account for $74, 200 23, 893 98, 093 307, 686 64, 614 Direct Materials Conversion Costs 378, 000 153, 600 1, 700 1, 800 $222. 353 $85. 333
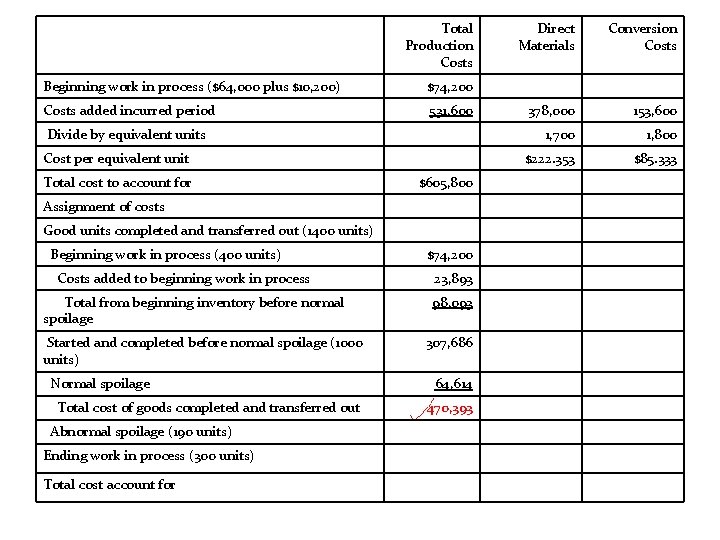
Total Production Costs Beginning work in process ($64, 000 plus $10, 200) $74, 200 Costs added incurred period 531, 600 Divide by equivalent units Cost per equivalent unit Total cost to account for $605, 800 Assignment of costs Good units completed and transferred out (1400 units) Beginning work in process (400 units) Costs added to beginning work in process Total from beginning inventory before normal spoilage Started and completed before normal spoilage (1000 units) Normal spoilage Total cost of goods completed and transferred out Abnormal spoilage (190 units) Ending work in process (300 units) Total cost account for $74, 200 23, 893 98, 093 307, 686 64, 614 470, 393 Direct Materials Conversion Costs 378, 000 153, 600 1, 700 1, 800 $222. 353 $85. 333
Total Production Costs Beginning work in process ($64, 000 plus $10, 200) $74, 200 Costs added incurred period 531, 600 Direct Materials Conversion Costs 378, 000 153, 600 1, 700 1, 800 $222. 353 $85. 333 Divide by equivalent units Cost per equivalent unit Total cost to account for $605, 800 Assignment of costs Good units completed and transferred out (1400 units) Beginning work in process (400 units) Costs added to beginning work in process Total from beginning inventory before normal spoilage Started and completed before normal spoilage (1000 units) Normal spoilage Total cost of goods completed and transferred out Abnormal spoilage (190 units) Ending work in process (300 units) Total cost account for $74, 200 23, 893 98, 093 307, 686 64, 614 470, 393 58, 461 $307. 686 x 190 units
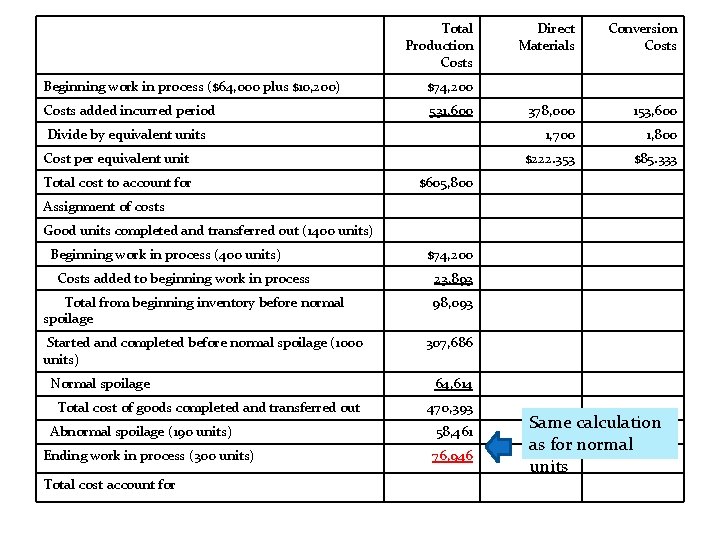
Total Production Costs Beginning work in process ($64, 000 plus $10, 200) $74, 200 Costs added incurred period 531, 600 Divide by equivalent units Cost per equivalent unit Total cost to account for Direct Materials Conversion Costs 378, 000 153, 600 1, 700 1, 800 $222. 353 $85. 333 $605, 800 Assignment of costs Good units completed and transferred out (1400 units) Beginning work in process (400 units) Costs added to beginning work in process Total from beginning inventory before normal spoilage Started and completed before normal spoilage (1000 units) Normal spoilage Total cost of goods completed and transferred out Abnormal spoilage (190 units) Ending work in process (300 units) Total cost account for $74, 200 23, 893 98, 093 307, 686 64, 614 470, 393 58, 461 76, 946 Same calculation as for normal units
Total Production Costs Beginning work in process ($64, 000 plus $10, 200) Divide by equivalent units Cost per equivalent unit $605, 800 Assignment of costs Good units completed and transferred out (1400 units) Beginning work in process (400 units) Costs added to beginning work in process Total from beginning inventory before normal spoilage Started and completed before normal spoilage (1000 units) Normal spoilage Total cost of goods completed and transferred out Abnormal spoilage (190 units) Ending work in process (300 units) Total cost account for Conversion Costs 531, 600 378, 000 153, 600 1, 700 1, 800 $222. 353 $85. 333 $74, 200 Costs added incurred period Total cost to account for Direct Materials $74, 200 23, 893 98, 093 307, 686 64, 614 470, 393 58, 461 76, 946 $605, 800
End of Lecture 24