Improving Community Health through Planning and Partnerships Nelson


- Slides: 85

Improving Community Health through Planning and Partnerships Nelson Community Health Council

Things to keep in mind… • Feel free to ask questions as we go along • We are presenting the most recent data we have • (From the past 4 – 5 years) • This is the last part of Section 2, Part 2 and the 1 st part of Section 3 data • At the next meeting we will cover: • Section 3: What is our Health Status, Part 2

Today • Updates/Highlights from Section 2, Part 2 • Managing Chronic Diseases • Section 3, Part 1 • Disease Prevalence • Infectious Disease • Unintentional Injuries

Managing Chronic Disease. Diabetes & Hypertension

Managing Diabetes, 2008 -12 Percent of Medicare Beneficiearies with Diabetes with Annual Hemoglobin A 1 c Test 100% 86% 89% 90% 88% 91% 85% 87% 2008 2009 2010 2011 2012 60% 40% 20% 0% Greene Nelson VA Source: Community Commons Community Health Needs Assessment for TJHD localities-Clinical Care Report. Dartmouth College Insititute for Health Policy & Clinical Practice, Dartmouth Atlas of Health Care. 2012. Source geography: County

Managing Hypertension, 2006 -10 Percent of Adults with Hypertension who are NOT taking Hypertension medication, 2006 -10 25% 21, 7% 19, 7% 20% 15% 10, 4% 10% 5% 0% TJHD VA US Source: Community Commons Community Health Needs Assessment for TJHD localities-Clinical Care Report. Centers for Disease Control & Prevention (CDC). Behavioral Risk Factor Surveillance System. Additional Data analysis by CARES. 2006 -10. Source geography: county

Section 3: What is Our Health Status? Maternal & Child Health Leading Causes of Death Cancer Unintentional Injuries

Prevalence

Heart Disease, 2011 -12 Percent of Adults Age 18 Years & Older with Heart Disease 7% 6, 4% 6% 5% 4, 2% 4, 4% VA US 4% 3% 2% No Data 1% 0, 0% 0% Greene Nelson Source: Community Commons Community Health Needs Assessment Report for TJHD Localities-Health Outcomes. Centers for Disease Control and Prevention (CDC), Behavioral Risk Factor Surveillance Survey (BRFSS). Additional data analysis by CARES. 2011 -2012. Source geography: County.

Heart Disease in Medicare Beneficiaries (Mainly Adults 65+ Years), 2012 Percent of Medicare Beneficiaries with Heart Disease, 2012 28, 6% 30% 25% 23, 0% 24, 7% 21, 7% 20% 15% 10% 5% 0% Greene Nelson VA US Source: Community Commons Community Health Needs Assessment Report for TJHD Localities-Health Outcomes. Centers for Medicare and Medicaid Services. 2012. Source geography: County

Hypertension (High Blood Pressure), 2006 -12 Percent of Adults Age 18 Years & Older with Hypertension 30% 25% 27, 7% 28, 2% VA US 23, 1% 20% 15% 10% 5% 0% No Data 0, 0% Greene Nelson TJHD Source: Community Commons Community Health Needs Assessment Report for TJHD Localities-Health Outcomes. Centers for Disease Control and Prevention (CDC), Behavioral Risk Factor Surveillance Survey (BRFSS). Additional data analysis by CARES. 2006 -2012. Source geography: County.

Hypertension in Medicare Beneficiaries (Mainly Adults 65+ Years), 2012 Percent of Medicare Beneficiaries with Hypertension, 2012 53, 2% 50% 57, 1% 55, 5% VA US 50, 2% 40% 30% 20% 10% 0% Greene Nelson Source: Community Commons Community Health Needs Assessment Report for TJHD Localities-Health Outcomes. Centers for Medicare and Medicaid Services. 2012. Source geography: County

Diabetes, 2012 Population Diagnosed with Diabetes, Age. Adjusted Rate (%) 9, 8% 10% 8, 6% 9, 2% 9, 1% VA US 8% 6% 4% 2% 0% Greene Nelson Source: Community Commons Community Health Needs Assessment Report for TJHD Localities-Health Outcomes. Centers for Disease Control and Prevention (CDC), National Center for Chronic Disease Prevention and Health. 2012. Source geography: County.

Diabetes, 2004 -2012 9, 8% 10% 8% 6% 9, 1% 7, 8% 8, 6% 7, 3% 4% 2% 0% 2004 2005 2006 2007 2008 2009 2010 2011 2012 Greene Nelson VA US Source: Community Commons Community Health Needs Assessment Report for TJHD Localities-Health Outcomes. Centers for Disease Control and Prevention (CDC), National Center for Chronic Disease Prevention and Health. 2012. Source geography: County.

Diabetes, 2012 12% 10% 8% 9, 6% 8, 1% 10, 1% 8, 9% 9, 9% 8, 8% 9, 6% 8, 3% 6% 4% 2% 0% Greene Nelson VA US Percent of Males Adults Age 20 Years or Older with Diabetes Percent of Female Adults Age 20 Years or Older with Diabetes Source: Community Commons Community Health Needs Assessment Report for TJHD Localities-Health Outcomes. Centers for Disease Control and Prevention (CDC), National Center for Chronic Disease Prevention and Health. 2012. Source geography: County.

Diabetes in Medicare Beneficiaries (Mainly Older Adults), 2012 Percent of Medicare Beneficiaries with Diabetes, 2012 27, 3% 26, 9% 27, 0% Greene Nelson VA US 25% 20% 15% 10% 5% 0% Source: Community Commons Community Health Needs Assessment Report for TJHD Localities-Health Outcomes. Centers for Medicare and Medicaid Services. 2012. Source geography: County.

High Cholesterol, 2011 -12 Percent of Adults Age 18 Years & Older with High Cholesterol 45% 40% 37% 39% VA US 35% 30% 25% 21% Greene Nelson 20% 15% 10% 5% 0% Source: Community Commons Community Health Needs Assessment Report for TJHD Localities-Health Outcomes. Centers for Disease Control and Prevention (CDC), Behavioral Risk Factor Surveillance Survey (BRFSS). Additional data analysis by CARES. 2011 -2012. Source geography: County.

High Cholesterol in Medicare Beneficiaries, 2012 Percent of Medicare Beneficiaries with Hyperlipidemia 50% 45% 41, 0% 44, 0% 47, 1% 44, 8% 40% 35% 30% 25% 20% 15% 10% 5% 0% Greene Nelson VA US Source: Community Commons Community Health Needs Assessment Report for TJHD Localities-Health Outcomes. Centers for Medicare and Medicaid Services. 2012. Source geography: County.

Asthma, 2011 -12 Percent of Adults Age 18 Years & Older with Asthma, 2011 -12 16% 14% 12% 13, 4% VA US 10, 8% 10% 8, 6% 8% 6% 4% 2% 0% Greene Nelson Source: Community Commons Community Health Needs Assessment Report for TJHD Localities-Health Outcomes. Centers for Disease Control and Prevention (CDC), Behavioral Risk Factor Surveillance Survey (BRFSS). Additional data analysis by CARES. 2011 -2012. Source geography: County.

Asthma, 2011 -12 Percent of Adults Age 18 Years and Older with Asthma by Race/Ethnicity, 2011 -12 18% 16% 14% 12% 10% 8% 6% 4% 2% 0% 15, 8% 14, 9% 12, 6% 13, 2% White (Non. Hispanic) Black (Non. Hispanic) VA 13, 2% 11, 9% Other Race (Non-Hispanic) 12, 2%12, 0% Hispanic / Latino US Source: Community Commons Community Health Needs Assessment Report for TJHD Localities-Health Outcomes. Centers for Disease Control and Prevention (CDC), Behavioral Risk Factor Surveillance Survey (BRFSS). Additional data analysis by CARES. 2011 -2012. Source geography: County.

Poor Dental Health, 2006 -10 Percent of Adults Age 18 Years & Older with Poor Dental Health 18% 16% Poor dental health = 6 or more permanent teeth have been removed due to tooth decay, gum disease, or infection 16% 13% 14% 11% 12% 10% 8% 6% 4% 2% 0% Greene Nelson VA US Source: Community Commons Community Health Needs Assessment Report for TJHD Localities-Health Outcomes. Centers for Disease Control and Prevention (CDC), Behavioral Risk Factor Surveillance Survey (BRFSS). Additional data analysis by CARES. 2006 -2010. Source geography: County.

Infectious Disease

HIV Disease Incidence Rate per 100, 000 Population, 5 Year Rolling Averages, 19972014 16 14 12 10 8 6 4 2 0 13, 9 19 19 97 - 20 98 01 19 -20 99 02 20 -20 00 03 20 -20 01 04 20 -20 02 05 20 -20 03 06 20 -20 04 07 20 -20 05 08 20 -20 06 09 20 -20 07 10 20 -20 08 11 20 -20 09 12 20 -20 10 13 -2 01 4 9, 1 TJHD Virginia Source: Virginia Department of Health. Office of Epidemiology. Reportable Disease Surveillance in Virginia Annual Reports.

HIV Disease Incidence Rate per 100, 000 Population, 1997 -2014 13, 2 10, 6 Greene Nelson 2014 2013 2012 2011 2010 2009 2008 2007 2006 2005 2004 2003 2002 2001 2000 1999 1998 0, 0 1997 20 18 16 14 12 10 8 6 4 2 0 Virginia Source: Virginia Department of Health. Office of Epidemiology. Reportable Disease Surveillance in Virginia Annual Reports.

HIV by Race HIV Incidence Rate per 100, 000 by Race in VA, 5 Year Average 2010 -14 45 40, 7 40 35 30 25 20 Virginia-All Races, 13. 9 15 10 5 5, 5 0 Virginia-White Virginia-Black Source: Virginia Department of Health. Office of Epidemiology. Tables of Selected Reportable Diseases in Virginia by Year of Report. Table 4 for each year.

HIV by Race HIV Incidence Rate per 100, 000 by Race in VA, 2010 -14 50 45 40 35 30 25 20 15 10 5 0 46, 3 42, 2 37, 9 40, 1 37, 2 5, 9 5, 1 5, 5 5, 7 5, 5 2010 2011 2012 2013 2014 Virginia-White Virginia-Black Source: Virginia Department of Health. Office of Epidemiology. Tables of Selected Reportable Diseases in Virginia by Year of Report. Table 4 for each year.

Outbreaks in TJHD in 2015 City/County Albemarle Charlottesville Fluvanna Greene Louisa Nelson Cryptosporidium Influenza Norovirus 1 5 Organism MRSA 1 1 2 2 1 1 Pediculus (lice) 1 Pertussis 3 Mumps TJHD TOTAL 9 1 1 1 4 1 1 Pneumonia 1 1 Chickenpox 1 1 Group A Strep TOTAL 1 11 4 0 1 5 1 1 22 Source: Virginia Department of Health. Thomas Jefferson Health District. Data for Communicable Disease Summary Report for 2015 (not yet published).

Outbreaks in TJHD 2015 > 419 Type of Outbreak in TJHD, 2015 Persons were affected 40. 9% Respiratory 36. 4% of outbreaks were due to norovirus Rash; 4, 5% Gastrointestinal, 45. 5% Other; 13, 6% Source: Virginia Department of Health. Thomas Jefferson Health District. Data for Communicable Disease Summary Report for 2015 (not yet published).

Sexually Transmitted Infections (STI’s) Gonorrhea Incidence Rate per 100, 000 Population, 5 Year Rolling Averages, 1997 -2014 160 140 120 100 80 60 40 20 0 99, 0 19 19 97 - 20 0 98 1 -2 19 00 99 2 -2 20 00 00 3 -2 20 00 01 4 -2 20 00 02 5 -2 20 00 03 6 -2 20 00 04 7 -2 20 00 05 8 -2 20 00 06 9 -2 20 01 07 0 -2 20 01 08 1 -2 01 2 67, 7 TJHD Virginia Source: Virginia Department of Health. Office of Epidemiology. Reportable Disease Surveillance in Virginia Annual Reports.

Sexually Transmitted Infections (STI’s) Gonorrhea Incidence Rate per 100, 000 Population, 1997 -2014 99, 2 47, 3 Greene Nelson 2014 2013 2012 2011 2010 2009 2008 2007 2006 2005 2004 2003 2002 2001 2000 1999 1998 16, 0 1997 180 160 140 120 100 80 60 40 20 0 Virginia Source: Virginia Department of Health. Office of Epidemiology. Reportable Disease Surveillance in Virginia Annual Reports.

Sexually Transmitted Infections (STI’s) Chlamydia Incidence Rate per 100, 000 Population, 5 Year Rolling Averages, 1997 -2014 419, 5 450 400 350 300 250 200 150 100 50 0 19 9 719 200 98 1 19 200 99 2 20 200 00 3 20 200 01 4 20 200 02 5 20 200 03 6 20 200 04 7 20 200 05 8 20 200 06 9 20 201 07 0 20 201 08 1 20 201 09 2 20 201 10 3 -2 01 4 291, 2 TJHD Virginia Source: Virginia Department of Health. Office of Epidemiology. Reportable Disease Surveillance in Virginia Annual Reports.

Sexually Transmitted Infections (STI’s) Chlamydia Incidence Rate per 100, 000 Population, 1997 -2014 500 450 400 350 300 250 200 150 100 50 0 432, 5 175, 8 19 97 19 98 19 99 20 00 20 01 20 02 20 03 20 04 20 05 20 06 20 07 20 08 20 09 20 10 20 11 20 12 20 13 20 14 133, 0 Greene Nelson Virginia Source: Virginia Department of Health. Office of Epidemiology. Reportable Disease Surveillance in Virginia Annual Reports.

Sexually Transmitted Infections (STI’s) Syphilis Incidence Rate per 100, 000 Population, 5 Year Rolling Averages, 1999 -2014 8 7 6 5 4 3 2 1 0 7, 1 20 19 99 - 20 0 00 3 -2 20 004 01 -2 20 005 02 -2 20 006 03 -2 20 007 04 -2 20 008 05 -2 20 009 06 -2 20 010 07 -2 20 011 08 -2 20 012 09 -2 20 013 10 -2 01 4 3, 8 TJHD Virginia Source: Virginia Department of Health. Office of Epidemiology. Reportable Disease Surveillance in Virginia Annual Reports.

Sexually Transmitted Infections (STI’s) Syphilis Incidence Rate per 100, 000 Population, 1999 -2014 9 8 7 6 5 4 3 2 1 0 6, 7 19 99 20 00 20 01 20 02 20 03 20 04 20 05 20 06 20 07 20 08 20 09 20 10 20 11 20 12 20 13 20 14 0, 0 Greene Nelson Virginia Source: Virginia Department of Health. Office of Epidemiology. Reportable Disease Surveillance in Virginia Annual Reports.

Infectious Disease. Vaccine Preventable

Vaccine Preventable Infectious Diseases Varicella (Chickenpox) Incidence Rate per 100, 000 Population, 5 Year Rolling Averages, 1999 -2014 25 20 15 8, 3 10 5 5, 7 20 19 99 - 20 0 00 3 -2 20 004 01 -2 20 005 02 -2 20 006 03 -2 20 007 04 -2 20 008 05 -2 20 009 06 -2 20 010 07 -2 20 011 08 -2 20 012 09 -2 20 013 10 -2 01 4 0 TJHD Virginia Source: Virginia Department of Health. Office of Epidemiology. Reportable Disease Surveillance in Virginia Annual Reports.

Vaccine Preventable Infectious Diseases Varicella (Chickenpox) Incidence Rate per 100, 000 Population, 1999 -2014 80 70 60 50 40 30 20 3, 9 10 0, 0 19 99 20 00 20 01 20 02 20 03 20 04 20 05 20 06 20 07 20 08 20 09 20 10 20 11 20 12 20 13 20 14 0 Greene Nelson Virginia Source: Virginia Department of Health. Office of Epidemiology. Reportable Disease Surveillance in Virginia Annual Reports.

Vaccine Preventable Infectious Diseases Pertussis Incidence Rate per 100, 000 Population, 5 Year Rolling Averages, 1999 -2014 45 40 35 30 25 20 15 10 5 0 13, 8 20 19 99 - 20 0 00 3 -2 20 004 01 -2 20 005 02 -2 20 006 03 -2 20 007 04 -2 20 008 05 -2 20 009 06 -2 20 010 07 -2 20 011 08 -2 20 012 09 -2 20 013 10 -2 01 4 5, 8 TJHD Virginia Source: Virginia Department of Health. Office of Epidemiology. Reportable Disease Surveillance in Virginia Annual Reports.

Vaccine Preventable Infectious Diseases Pertussis Incidence Rate per 100, 000 Population, 1999 -2014 400 350 300 250 200 150 100 50 0 19 99 20 00 20 01 20 02 20 03 20 04 20 05 20 06 20 07 20 08 20 09 20 10 20 11 20 12 20 13 20 14 27, 0 21, 3 6, 1 Greene Nelson Virginia Source: Virginia Department of Health. Office of Epidemiology. Reportable Disease Surveillance in Virginia Annual Reports.

Vaccine Preventable Infectious Diseases Meningococcal Disease Incidence Rate per 100, 000 Population, 5 Year Rolling Averages, 1999 -2014 0, 9 1, 0 0, 9 0, 8 0, 7 0, 6 0, 5 0, 4 0, 3 0, 2 0, 1 0, 0 20 19 99 - 20 0 00 3 -2 20 00 01 4 -2 20 00 02 5 -2 20 00 03 6 -2 20 00 04 7 -2 20 00 05 8 -2 20 00 06 9 -2 20 01 07 0 -2 20 01 08 1 -2 20 01 09 2 -2 20 01 10 3 -2 01 4 0, 2 TJHD Virginia Source: Virginia Department of Health. Office of Epidemiology. Reportable Disease Surveillance in Virginia Annual Reports.

Vaccine Preventable Infectious Diseases Meningococcal Incidence Rate per 100, 000 Population, 1999 -2014 7, 0 6, 0 5, 0 4, 0 3, 0 2, 0 1, 0 0, 1 0, 0 19 99 20 00 20 01 20 02 20 03 20 04 20 05 20 06 20 07 20 08 20 09 20 10 20 11 20 12 20 13 20 14 0, 0 Greene Nelson Virginia Source: Virginia Department of Health. Office of Epidemiology. Reportable Disease Surveillance in Virginia Annual Reports.

Vaccine Preventable Infectious Diseases Mumps Incidence Rate per 100, 000 Population, 5 Year Rolling Averages, 1999 -2014 6 5 4 3 2 1, 2 1 0 20 19 99 - 20 0 00 3 -2 20 00 01 4 -2 20 00 02 5 -2 20 00 03 6 -2 20 00 04 7 -2 20 00 05 8 -2 20 00 06 9 -2 20 01 07 0 -2 20 01 08 1 -2 20 01 09 2 -2 20 01 10 3 -2 01 4 0, 4 TJHD Virginia Source: Virginia Department of Health. Office of Epidemiology. Reportable Disease Surveillance in Virginia Annual Reports.

Vaccine Preventable Infectious Diseases Mumps Incidence Rate per 100, 000 Population, 1999 -2014 14 12 10 8 6 4 2 0, 0 19 99 20 00 20 01 20 02 20 03 20 04 20 05 20 06 20 07 20 08 20 09 20 10 20 11 20 12 20 13 20 14 0 Greene Nelson Virginia Source: Virginia Department of Health. Office of Epidemiology. Reportable Disease Surveillance in Virginia Annual Reports.

Infectious Disease. Respiratory

Respiratory Infectious Diseases Legionellosis Incidence Rate per 100, 000 Population, 5 Year Rolling Averages, 1999 -2014 3 3 2 2 1, 2 1 20 19 99 - 20 0 00 3 -2 20 004 01 -2 20 005 02 -2 20 006 03 -2 20 007 04 -2 20 008 05 -2 20 009 06 -2 20 010 07 -2 20 011 08 -2 20 012 09 -2 20 013 10 -2 01 4 0 TJHD Virginia Source: Virginia Department of Health. Office of Epidemiology. Reportable Disease Surveillance in Virginia Annual Reports.

Respiratory Infectious Diseases Legionellosis Incidence Rate per 100, 000 Population, 1999 -2014 14 12 10 8 5, 3 6 4 1, 6 2 0, 0 19 99 20 00 20 01 20 02 20 03 20 04 20 05 20 06 20 07 20 08 20 09 20 10 20 11 20 12 20 13 20 14 0 Greene Nelson Virginia Source: Virginia Department of Health. Office of Epidemiology. Reportable Disease Surveillance in Virginia Annual Reports.

Respiratory Infectious Diseases Tuberculosis Incidence Rate per 100, 000 Population, 5 Year Rolling Averages, 1999 -2014 5 5 4 4 3 3 2 2 1 1 0 2, 7 20 19 99 - 20 0 00 3 -2 20 004 01 -2 20 005 02 -2 20 006 03 -2 20 007 04 -2 20 008 05 -2 20 009 06 -2 20 010 07 -2 20 011 08 -2 20 012 09 -2 20 013 10 -2 01 4 2, 7 TJHD Virginia Source: Virginia Department of Health. Office of Epidemiology. Reportable Disease Surveillance in Virginia Annual Reports.

Respiratory Infectious Diseases Tuberculosis Incidence Rate per 100, 000 Population, 1999 -2014 16 14 12 10 8 6 4 2, 4 2 0, 0 19 99 20 00 20 01 20 02 20 03 20 04 20 05 20 06 20 07 20 08 20 09 20 10 20 11 20 12 20 13 20 14 0 Greene Nelson Virginia Source: Virginia Department of Health. Office of Epidemiology. Reportable Disease Surveillance in Virginia Annual Reports.

Infectious Disease. Food-borne

Foodborne Infectious Diseases Campylobacteriosis Incidence Rate per 100, 000 Population, 5 Year Rolling Averages, 19992014 14 12 10 8 6 4 2 0 9, 4 20 19 99 - 20 0 00 3 -2 20 00 01 4 -2 20 00 02 5 -2 20 00 03 6 -2 20 00 04 7 -2 20 00 05 8 -2 20 00 06 9 -2 20 01 07 0 -2 20 01 08 1 -2 20 01 09 2 -2 20 01 10 3 -2 01 4 7, 8 TJHD Virginia Source: Virginia Department of Health. Office of Epidemiology. Reportable Disease Surveillance in Virginia Annual Reports.

Foodborne Infectious Diseases Campylobacteriosis Incidence Rate per 100, 000 Population, 1999 -2014 50 45 40 35 30 25 20 15 10 5 0 13, 5 9, 0 19 99 20 00 20 01 20 02 20 03 20 04 20 05 20 06 20 07 20 08 20 09 20 10 20 11 20 12 20 13 20 14 5, 3 Greene Nelson Virginia Source: Virginia Department of Health. Office of Epidemiology. Reportable Disease Surveillance in Virginia Annual Reports.

Foodborne Infectious Diseases E. Coli Incidence Rate per 100, 000 Population, 5 Year Rolling Averages, 1999 -2014 4 3 3 2 2 1 1 0 2, 6 20 19 99 - 20 0 00 3 -2 20 00 01 4 -2 20 00 02 5 -2 20 00 03 6 -2 20 00 04 7 -2 20 00 05 8 -2 20 00 06 9 -2 20 01 07 0 -2 20 01 08 1 -2 20 01 09 2 -2 20 01 10 3 -2 01 4 1, 4 TJHD Virginia Source: Virginia Department of Health. Office of Epidemiology. Reportable Disease Surveillance in Virginia Annual Reports.

Foodborne Infectious Diseases E. Coli Incidence Rate per 100, 000 Population, 1999 -2014 9 8 7 6 5 4 3 2 1 0 19 99 20 00 20 01 20 02 20 03 20 04 20 05 20 06 20 07 20 08 20 09 20 10 20 11 20 12 20 13 20 14 1, 5 0, 0 Greene Nelson Virginia Source: Virginia Department of Health. Office of Epidemiology. Reportable Disease Surveillance in Virginia Annual Reports.

Foodborne Infectious Diseases Giardiasis Incidence Rate per 100, 000 Population, 5 Year Rolling Averages, 1999 -2014 20 18 16 14 12 10 8 6 4 2 0 6, 3 20 19 99 - 20 0 00 3 -2 20 004 01 -2 20 005 02 -2 20 006 03 -2 20 007 04 -2 20 008 05 -2 20 009 06 -2 20 010 07 -2 20 011 08 -2 20 012 09 -2 20 013 10 -2 01 4 4, 0 TJHD Virginia Source: Virginia Department of Health. Office of Epidemiology. Reportable Disease Surveillance in Virginia Annual Reports.

Foodborne Infectious Diseases Giardiasis Incidence Rate per 100, 000 Population, 1999 -2014 45 40 35 30 25 20 15 10 5 0 19 99 20 00 20 01 20 02 20 03 20 04 20 05 20 06 20 07 20 08 20 09 20 10 20 11 20 12 20 13 20 14 3, 1 0, 0 Greene Nelson Virginia Source: Virginia Department of Health. Office of Epidemiology. Reportable Disease Surveillance in Virginia Annual Reports.

Foodborne Infectious Diseases Salmonellosis Incidence Rate per 100, 000 Population, 5 Year Rolling Averages, 1999 -2014 20 18 16 14 12 10 8 6 4 2 0 15, 6 20 19 99 - 20 0 00 3 -2 20 004 01 -2 20 005 02 -2 20 006 03 -2 20 007 04 -2 20 008 05 -2 20 009 06 -2 20 010 07 -2 20 011 08 -2 20 012 09 -2 20 013 10 -2 01 4 14, 3 TJHD Virginia Source: Virginia Department of Health. Office of Epidemiology. Reportable Disease Surveillance in Virginia Annual Reports.

Foodborne Infectious Diseases Salmonellosis Incidence Rate per 100, 000 Population, 1999 -2014 60 50 40 31, 9 30 20, 3 20 10 13, 9 19 99 20 00 20 01 20 02 20 03 20 04 20 05 20 06 20 07 20 08 20 09 20 10 20 11 20 12 20 13 20 14 0 Greene Nelson Virginia Source: Virginia Department of Health. Office of Epidemiology. Reportable Disease Surveillance in Virginia Annual Reports.

Foodborne Infectious Diseases Shigellosis Incidence Rate per 100, 000 Population, 5 Year Rolling Averages, 1999 -2014 9 8 7 6 5 4 3 2 1 0 1, 3 20 19 99 - 20 0 00 3 -2 20 004 01 -2 20 005 02 -2 20 006 03 -2 20 007 04 -2 20 008 05 -2 20 009 06 -2 20 010 07 -2 20 011 08 -2 20 012 09 -2 20 013 10 -2 01 4 1, 6 TJHD Virginia Source: Virginia Department of Health. Office of Epidemiology. Reportable Disease Surveillance in Virginia Annual Reports.

Foodborne Infectious Diseases Shigellosis Incidence Rate per 100, 000 Population, 1999 -2014 16 14 12 10 8 6 4 2 0 5, 3 19 99 20 00 20 01 20 02 20 03 20 04 20 05 20 06 20 07 20 08 20 09 20 10 20 11 20 12 20 13 20 14 2, 6 0, 0 Greene Nelson Virginia Source: Virginia Department of Health. Office of Epidemiology. Reportable Disease Surveillance in Virginia Annual Reports.

Infectious Disease. Vector-borne

Vector-borne Infectious Diseases Rocky Mountain Spotted Fever (Spotted Fever Rickettsiosis) Incidence Rate per 100, 000 Population, 5 Year Rolling Averages, 19992014 12 10 8 6 4 2 0 10, 1 20 19 99 - 20 0 00 3 -2 20 00 01 4 -2 20 00 02 5 -2 20 00 03 6 -2 20 00 04 7 -2 20 00 05 8 -2 20 00 06 9 -2 20 01 07 0 -2 20 01 08 1 -2 20 01 09 2 -2 20 01 10 3 -2 01 4 3, 8 TJHD Virginia Source: Virginia Department of Health. Office of Epidemiology. Reportable Disease Surveillance in Virginia Annual Reports.

Vector-borne Infectious Diseases Rocky Mountain Spotted Fever (Spotted Fever Rickettsiosis) Incidence Rate per 100, 000 Population, 1999 -2014 30 25 20, 3 20 15 10 5, 3 5 4, 5 19 99 20 00 20 01 20 02 20 03 20 04 20 05 20 06 20 07 20 08 20 09 20 10 20 11 20 12 20 13 20 14 0 Greene Nelson Virginia Source: Virginia Department of Health. Office of Epidemiology. Reportable Disease Surveillance in Virginia Annual Reports.

Vector-borne Infectious Diseases Lyme Disease Incidence Rate per 100, 000 Population, 5 Year Rolling Averages, 19992014 35 30 25 20 15 10 5 0 28, 7 20 19 99 - 20 0 00 3 -2 20 00 01 4 -2 20 00 02 5 -2 20 00 03 6 -2 20 00 04 7 -2 20 00 05 8 -2 20 00 06 9 -2 20 01 07 0 -2 20 01 08 1 -2 20 01 09 2 -2 20 01 10 3 -2 01 4 14, 9 TJHD Virginia Source: Virginia Department of Health. Office of Epidemiology. Reportable Disease Surveillance in Virginia Annual Reports.

Vector-borne Infectious Diseases Lyme Disease Incidence Rate per 100, 000 Population, 1999 -2014 60 47, 3 50 40 37, 2 30 20 10 16, 3 19 99 20 00 20 01 20 02 20 03 20 04 20 05 20 06 20 07 20 08 20 09 20 10 20 11 20 12 20 13 20 14 0 Greene Nelson Virginia Source: Virginia Department of Health. Office of Epidemiology. Reportable Disease Surveillance in Virginia Annual Reports.

Vector-borne Infectious Diseases Malaria Disease Incidence Rate per 100, 000 Population, 5 Year Rolling Averages, 1999 -2014 1, 6 1, 4 1, 2 1, 0 0, 8 0, 6 0, 4 0, 2 0, 0 0, 9 20 19 99 - 20 0 00 3 -2 20 004 01 -2 20 005 02 -2 20 006 03 -2 20 007 04 -2 20 008 05 -2 20 009 06 -2 20 010 07 -2 20 011 08 -2 20 012 09 -2 20 013 10 -2 01 4 0, 9 TJHD Virginia Source: Virginia Department of Health. Office of Epidemiology. Reportable Disease Surveillance in Virginia Annual Reports.

Vector-borne Infectious Diseases Malaria Disease Incidence Rate per 100, 000 Population, 1999 -2014 8 7 6 5 4 3 2 1 0, 0 19 99 20 00 20 01 20 02 20 03 20 04 20 05 20 06 20 07 20 08 20 09 20 10 20 11 20 12 20 13 20 14 0 0, 9 Greene Nelson Virginia Source: Virginia Department of Health. Office of Epidemiology. Reportable Disease Surveillance in Virginia Annual Reports.

Vector-borne Infectious Diseases http: //www. vdh. state. va. us/ Source: Virginia Department of Health

Infectious Disease. Healthcare Associated Infections (HAIs)

Healthcare Associated Infections (HAIs) Standardized Infection Ratios (SIRs), 2014 0, 92 0, 99 Hospital-onset Clostridium difficile. . . 0, 87 0, 84 Hospital-onset methicillin-resistan. . . 0, 83 0, 81 Surgical site infections (SSI). . . US Surgical site infections (SSI). . . 0, 98 1, 02 Catheter-associated urinary tract. . . 1, 00 0, 97 0, 50 0, 39 Central line-associated bloodstrea. . . 0 0, 2 0, 4 0, 6 0, 8 1 1, 2 Source: Centers for Disease Control and Prevention (CDC). HAI Progress Report VA

Healthcare Associated Infections (HAIs) Percent of MRSA Infections that were resistant out of those tested in VA, 2011 -14 60 Percent (%) 50 47, 6 47, 7 50, 9 54, 4 40 26, 2 30 20 19, 1 11, 9 11, 5 10 0 2011 2012 MRSA 2013 2014 CA-MRSA Source: Centers for Disease Control and Prevention (CDC). Antibiotic Resistance Patient Safety Atlas

Healthcare Associated Infections (HAIs) Percent of Multi-Drug Resistant HAIs out of those tested by type of bacteria in VA, 2011 -14 14 12, 5 12, 4 12 10 Percent (%) 8 9, 8 10, 3 9, 2 7, 6 4 0 9 5 6 2 9, 3 3, 8 2, 3 2011 10 6, 4 5, 5 5, 2 2013 2014 3 2012 Enterobacter spp. MDR E. coli MDR Klebsiella spp. MDR P. aeruginosa MDR Source: Centers for Disease Control and Prevention (CDC). Antibiotic Resistance Patient Safety Atlas

Unintentional Injury

Injury Hospitalizations by Cause Percent of Injury Hospitalizations by Cause in TJHD (All Intents), 2003 -13 48, 1% Falls 22, 2% 14, 2% Motor Vehicles/ Other Transport Crashes Poisoning Other/ Unspecified Stuck by, against Cut/Pierce Fire/Flame or Hot Object/Substance Overexertion Firearm Bites/Stings Machinery Drowning/Submersion or Suffocation 5, 0% 3, 2% 1, 7% 1, 4% 1, 2% 1, 1% 0, 9% 0, 6% 0, 4% 0% 10% 20% 30% 40% Source: Virginia Department of Health On-line Injury Reporting System 50%

Unintentional Injury Hospitalizations by Cause Percent of Unintentional Injury Hospitalizations by Cause in TJHD, 2003 -13 Falls 55, 3% 25, 5% Motor Vehicles/ Other Transport. . . 5, 3% Other/ Unspecified 4, 9% Stuck by, against 2, 7% Fire/Flame or Hot Object/Substan. . . 1, 6% Overexertion 1, 4% Bites/Stings 1, 0% Cut/Pierce 0, 8% Machinery 0, 7% Drowning/Submersion or. . . 0, 4% Firearm 0, 3% Poisoning 0% 10% 20% 30% 40% 50% Source: Virginia Department of Health On-line Injury Reporting System

Most Common Unintentional Injury Hospitalizations by Age Group The Most Common Causes of Hospitalization in TJHD and VA by Age Group, 2003 -13 100% 82% 83% 80% 60% 40% 20% 46% 21%26% 35% 32% 42% 36% 33% 7% 6% 0% 0 -19 years 20 -64 years 65+ years Falls TJHD Falls VA Motor Vehicles / Other Transport TJHD Motor Vehicles / Other Transport VA Source: Virginia Department of Health On-line Injury Reporting System

Injury Hospitalizations by Cause, Self-Inflicted and Assault Percent of Self-Inflicted Injury Hospitalizations by Cause in TJHD, 2003 -13 Firearm; 2, 2% Cut/ Pierce, 3. 7% Percent of Assault Injury Hospitalizations by Cause in TJHD, 2003 -13 Firearm, 20. 4% Stuck by, against, 31. 5% Poisoning, 92. 8% Cut/ Pierce, 25. 6% Other/ Unspe cified; 22, 6% Source: Virginia Department of Health On-line Injury Reporting System

Injury Deaths by Cause Percent of Injury Related Death by Cause in Greene, 2003 -2013 39, 1% Transport. . . 18, 8% Firearm Percent of Injury Related Death by Cause in Nelson, 2003 -2013 35, 2% Transport. . . 19, 2% Firearm Other/Unsp. . . 12, 5% Falls 12, 0% Poisoning 11, 7% Other/Unsp. . . 11, 2% Falls 9, 4% Suffocation 8, 8% Suffocation 8, 6% Poisoning 8, 0% Drowning Fire/Flame < 3. 9% 0% 5, 6% Fire/Flame < 4. 0% Drowning 50% 0% 50% Source: Virginia Department of Health On-line Injury Reporting System

Injury Deaths by Cause Percent of Injury Related Death by Cause in TJHD, 2003 -2013 Transport Crashes 29, 7% Firearm 17, 9% Falls 14, 7% Percent of Injury Related Death by Cause in VA, 2003 -2013 Transport Crashes 22, 5% 20, 5% Firearm 18, 2% Poisoning Other/Unspecified 13, 1% Other/Unspecifie d 12, 7% Poisoning 12, 4% Falls 12, 5% Suffocation 8, 5% Suffocation 9, 0% Drowning 2, 4% Fire/Flame 1, 8% Fire/Flame 2, 2% 0% 10%20%30%40% 0% 10% 20% 30% Source: Virginia Department of Health On-line Injury Reporting System

Falls 1200 Rate of Unintentional Injury Hospitalizations Due to Falls per 100, 000 (Age-Adjusted), All Ages, 3 Year Rolling Averages, 2007 -13 1 208 1 186 1 168 1 164 1 146 1 226 1 219 1 131 1 122 1 055 800 400 0 203 207 188 201 2007 -2009 2008 -2010 TJHD-All Ages TJHD-Adults 65+ Years 214 213 203 210 2009 -2011 2010 -2012 200 198 2011 -2013 VA-All Ages VA-Adults 65+ Years Source: Virginia Department of Health On-line Injury Reporting System

Falls Average Length of Stay in Days for Unintentional Injury Hospitalizations Due to Falls, 2011 -2013 6 4, 6 5 4 5, 1 3, 9 3, 8 3 2 1 0 TJHD All Ages VA Adults 65+ Years Source: Virginia Department of Health On-line Injury Reporting System

Motor Vehicle Crashes Per 100, 000 Population, 2000 -2014 3 500 3 000 2 500 2 000 1 500 1 000 500 0 1 199 1 761 20 00 20 02 01 20 03 02 20 04 03 20 05 04 20 06 05 20 07 06 20 08 07 20 09 08 20 10 09 20 11 10 20 12 11 20 13 12 -1 4 1 476 Greene Nelson Virginia Source: Virginia Department of Motor Vehicles

Motor Vehicle Crashes That Were Alcohol. Related 14% 10, 7% 12% 10% 6, 8% 8% 6% 6, 7% 4% 2% 20 00 - 20 02 01 20 03 02 20 04 03 20 05 04 20 06 05 20 07 06 20 08 07 20 09 08 20 10 09 20 11 10 20 12 11 20 13 12 -1 4 0% Greene Nelson Virginia Source: Virginia Department of Motor Vehicles

Motor Vehicle Fatalities Per 100, 000 Population, 2000 -2014 50 45 40 35 30 25 20 15 10 5 0 29 12 20 00 20 02 01 20 03 02 20 04 03 20 05 04 20 06 05 20 07 06 20 08 07 20 09 08 20 10 09 20 11 10 20 12 11 20 13 12 -1 4 9 Greene Nelson Virginia Source: Virginia Department of Motor Vehicles

Motor Vehicle Fatalities That Were Alcohol Related 60% 50% 38, 1% 40% 33, 2% 30% 27, 8% 20% 10% 20 00 20 02 01 20 03 02 20 04 03 20 05 04 20 06 05 20 07 06 20 08 07 20 09 08 20 10 09 20 11 10 20 12 11 20 13 12 -1 4 0% Greene Nelson Virginia Source: Virginia Department of Motor Vehicles

Questions ? Contact Info: Jillian Regan, MPH Jillian. Regan@vdh. virginia. gov
 Community health planning and implementation certificate
 Role of community health nurse in occupational health
 Tangential timber conversion
 Accounting for partnerships chapter 12 solutions
 Accenture development partners
 Word partnerships examples
 Product development partnerships
 Jit scheduling tactics
 Maintaining effective partnerships
 Publicpartnerships.com login
 Epsrc prosperity partnerships
 Chapter 12 accounting for partnerships answers
 Sin entered through one man
 Furcation classification
 Night of the scorpion poetry foundation
 Improving service quality and productivity
 Methods of improving quality business a level
 Improving own learning and performance examples
 Improving vocabulary with word parts and context clues
 Improving vocabulary with word parts and context clues
 Improving decision making and managing knowledge
 Proactive planning and reactive planning
 Long term plan and short term plan
 Stages of language planning slideshare
 Health and social care component 3 health and wellbeing
 Family and community health advisor
 Role of community health nurses
 Dutchess county mental hygiene
 Culturological assessment
 Larry davidson yale
 Legal issues in community health nursing
 Duke medicine grand rounds
 Personal community and environmental health
 Plan together in community mobilization
 Ten steps to advancing college reading skills answers
 Patient registration process flowchart
 Nurses improving care for healthsystem elders
 Improving vocabulary skills 4th edition pdf
 Condone noun form
 Improving software economics set 1
 Chapter 12 lesson 3 planning a personal activity program
 Improving software economics set 1
 A linear-time heuristic for improving network partitions
 Gap model of service quality with examples
 Ten steps to advancing college reading skills
 Starbucks inputs and outputs
 Improving vocabulary skills 5th edition
 A sense of belonging improving student retention
 Using assessment data for improving teaching practice
 Behavioral assessment scale for intercultural competence
 Refactoring improving the design of existing code
 Writing by
 Improving vocabulary skills chapter 9
 Improving the reliability of commodity operating systems
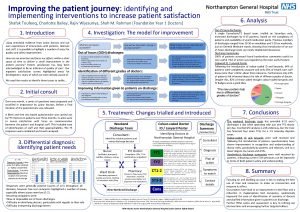
 Improving the patient journey
 Improving student learning one teacher at a time
 Improving process capability means;
 A practical guide for improving flight path monitoring
 Strategies for improving intercultural communication
 Jasig cas
 Improving student learning one teacher at a time
 Gaps model for improving service quality
 Improving search relevance
 What is the use of pi
 Improving hr service delivery
 Ahrq antibiotic stewardship
 Improving security performance
 Nist framework for improving critical infrastructure
 Improving critical infrastructure cybersecurity
 Operating room turnover time
 Ferocious in a sentence
 Improving operational performance
 Improving chronic illness care model
 Improving critical infrastructure cybersecurity
 Focus on synoynm
 Chapter 12 lesson 1 answer key
 Gandhi and mandela venn diagram
 Danna nelson
 Trevino and nelson managing business ethics
 Sylica
 Nelson and cox
 Nelson and cox
 Mipha in medical
 Unit 2 lesson 3 health insurance and financial planning
 Economics unit 2 lesson 7
 Community nutrition program planning


