Improving Security and Performance in the Tor Network






- Slides: 29
Improving Security and Performance in the Tor Network through Tunable Path Selection Robin Snader and Nikita Borisov Presented by Zechun Cao
Overview • Tor Design • Proposed Method ØBandwidth Measurement ØRouter Selection Algorithm • Evaluation and Discussions
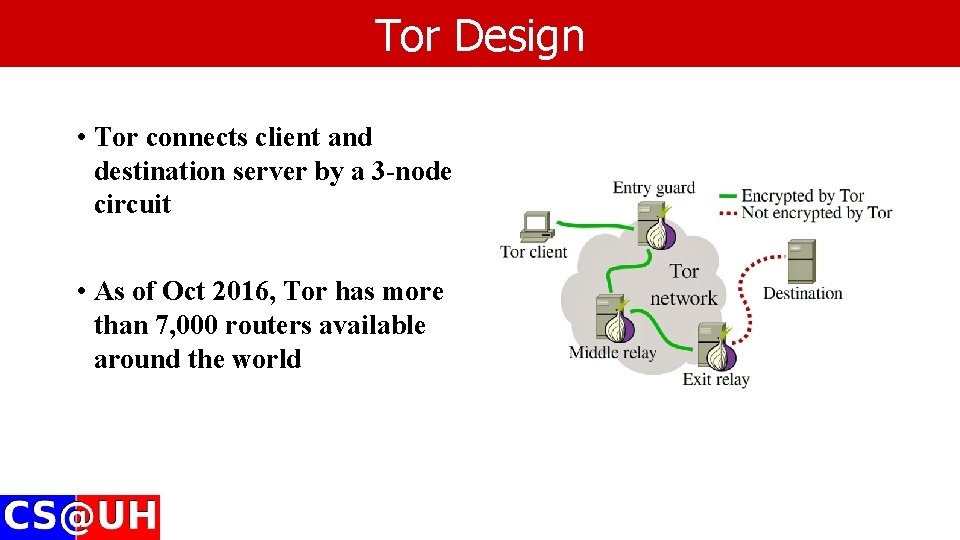
Tor Design • Tor connects client and destination server by a 3 -node circuit • As of Oct 2016, Tor has more than 7, 000 routers available around the world
Tor Design • How does Tor select the path? ØTor adopts self-report bandwidth mechanism ØEvery router registered with a directory service ØPeriodically report the peak bandwidth achieved over a period of time, upper bound is 10 MB/s ØTor constructs circuit weighted by the reported bandwidth to balance the traffic
Tor Design • Potential problems ØSelf report bandwidth value is not verified in any way, vulnerable to hackers ØFast changing network condition makes bandwidth prediction inaccurate, highly variable performance ØTor native load-balancing algorithm is a single, static compromise between performance and anonymity
Tor Design CDF of the time required to transfer a 1 MB file over the Tor network in July of 2007 CDF of the time required to transfer a 1 MB file over the Tor network in July of 2009
Proposed Method • How is the performance of a router measured? Ø Opportunistic monitoring Ø Evaluation aggregation • Tunable Router Selection Algorithm
Bandwidth Measurement • Three Methods to Consider ØTor native method – self report ØActive probing o Uses up valuable bandwidth resources o Increases the risk of failure or compromise ØOpportunistic monitoring
Opportunistic Monitoring •
Opportunistic Monitoring (a) Accuracy of probing for bandwidth prediction in real Tor network (b) Accuracy of passive observation for bandwidth prediction in real Tor network (c) Accuracy of advertised bandwidth for bandwidth prediction in real Tor network
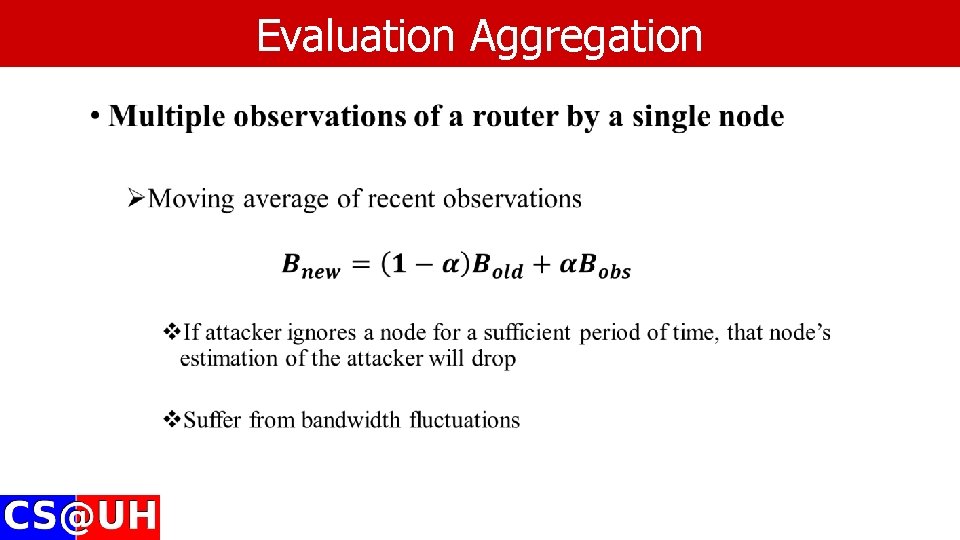
Evaluation Aggregation • Multiple observations of a router by a single node ØTake the Max of observed values over a long interval v. Partition attacks, where attacker focuses all of its bandwidth on nodes of interest, thus those nodes are more likely to be selected v. Spotlight attacks, where attacker focuses all of its bandwidth of one node at a time for a single interval
Evaluation Aggregation •
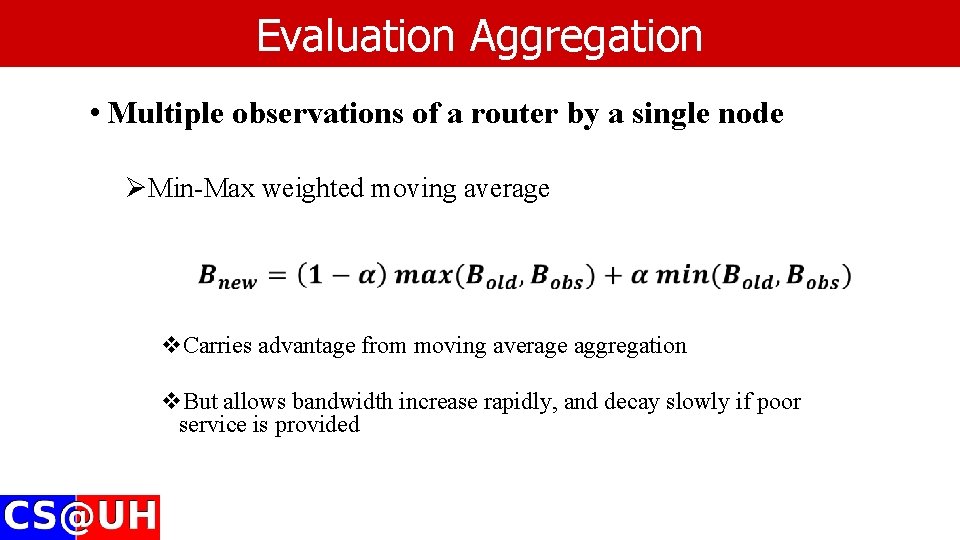
Evaluation Aggregation • Multiple observations of a router by a single node ØMin-Max weighted moving average v. Carries advantage from moving average aggregation v. But allows bandwidth increase rapidly, and decay slowly if poor service is provided
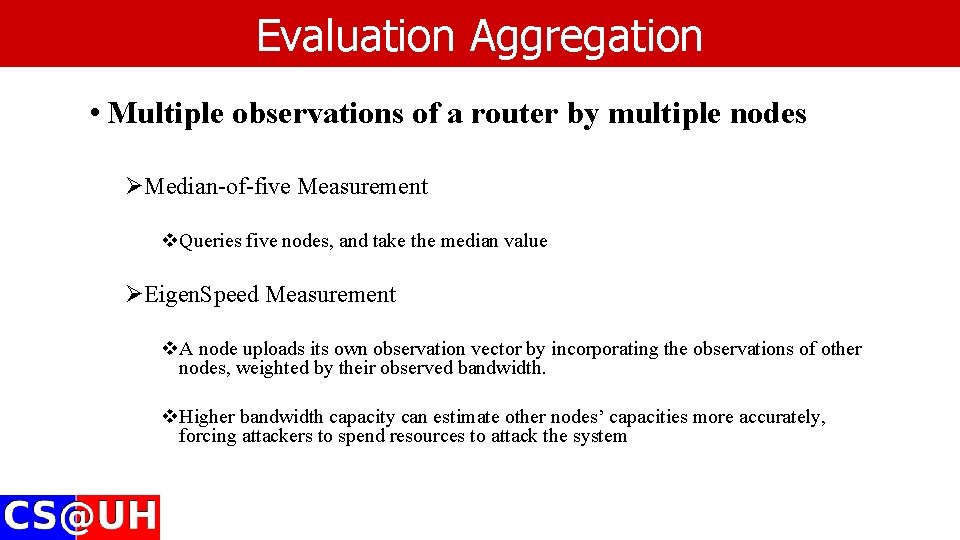
Evaluation Aggregation • Multiple observations of a router by multiple nodes ØMedian-of-five Measurement v. Queries five nodes, and take the median value ØEigen. Speed Measurement v. A node uploads its own observation vector by incorporating the observations of other nodes, weighted by their observed bandwidth. v. Higher bandwidth capacity can estimate other nodes’ capacities more accurately, forcing attackers to spend resources to attack the system
Evaluation Aggregation (a) Actual node bandwidth vs. achieved bandwidth (r=0. 223) (c) Median-of-five bandwidth measurement vs. achieved bandwidth (r=0. 680) (b) Current Tor bandwidth measurement vs. achieved bandwidth (r=0. 176) (d) Eigen. Speed bandwidth measurement vs. achieved bandwidth r=(0. 881)
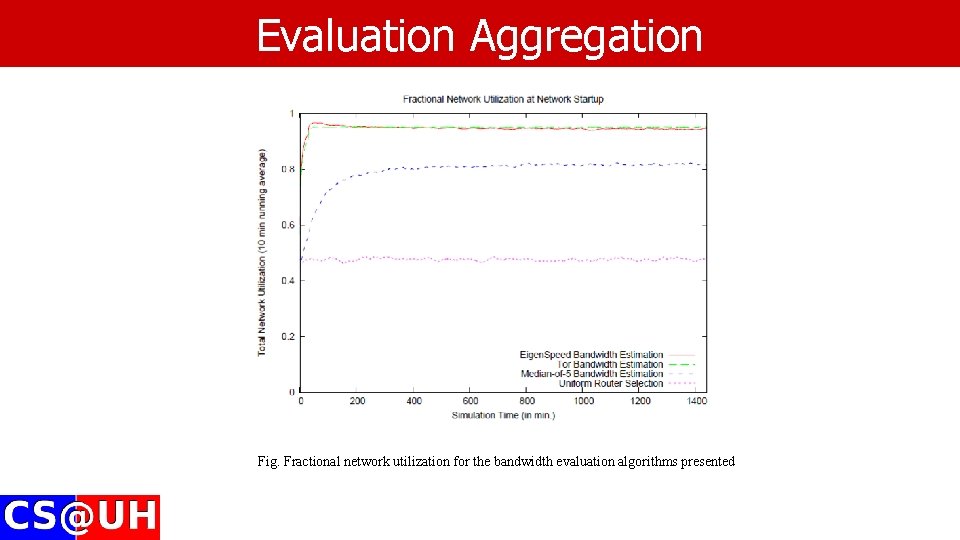
Evaluation Aggregation Fig. Fractional network utilization for the bandwidth evaluation algorithms presented
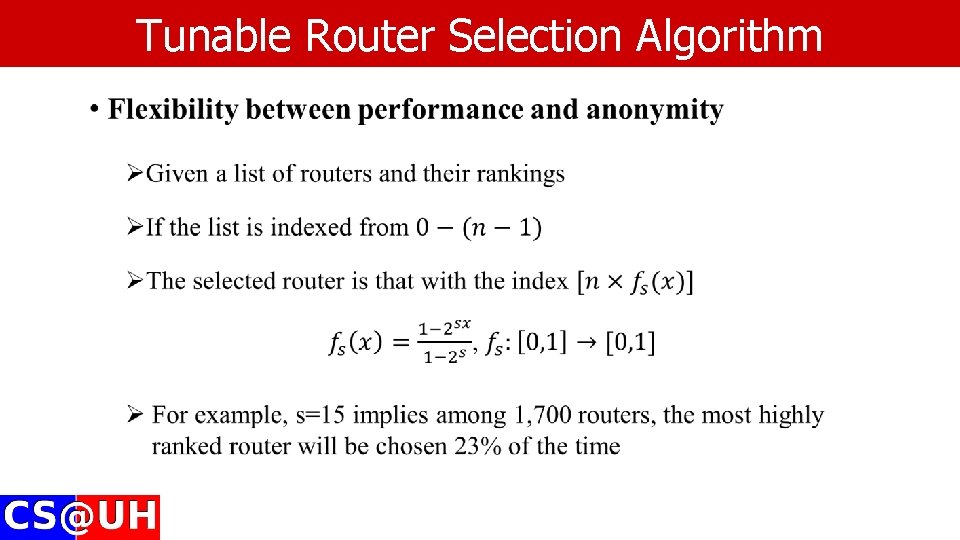
Tunable Router Selection Algorithm
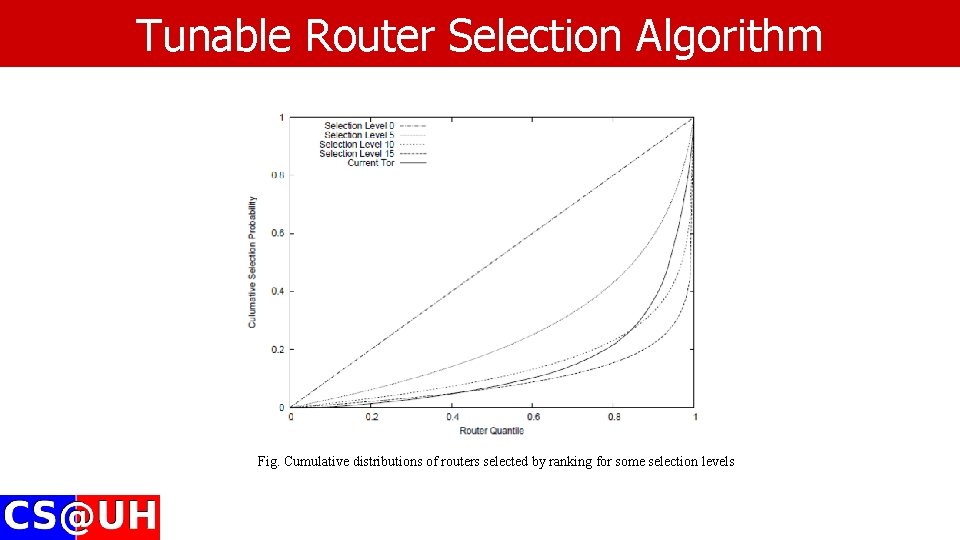
Tunable Router Selection Algorithm Fig. Cumulative distributions of routers selected by ranking for some selection levels
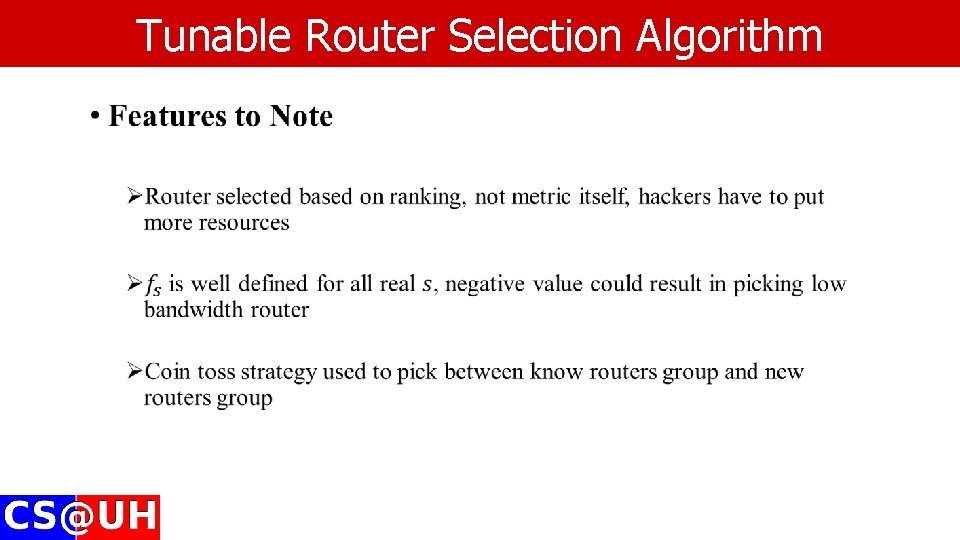
Tunable Router Selection Algorithm
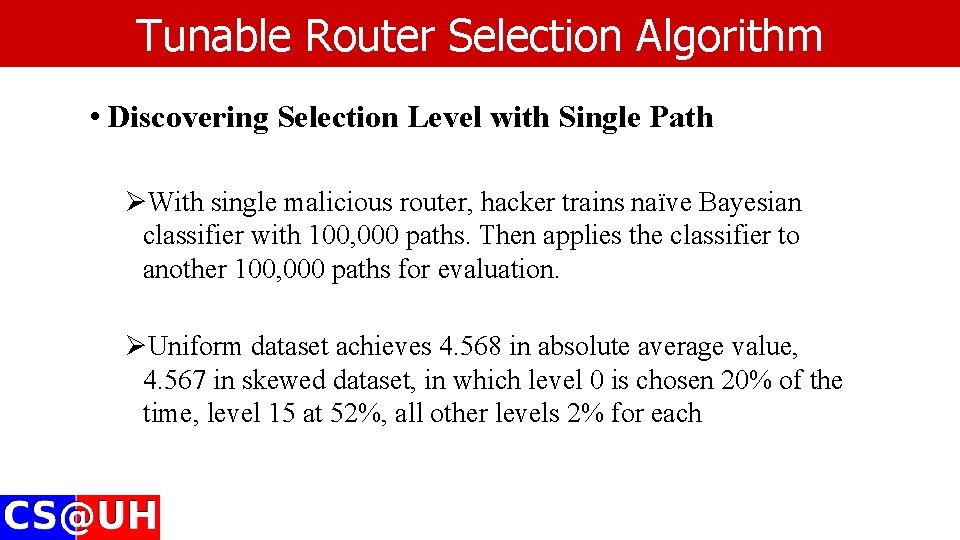
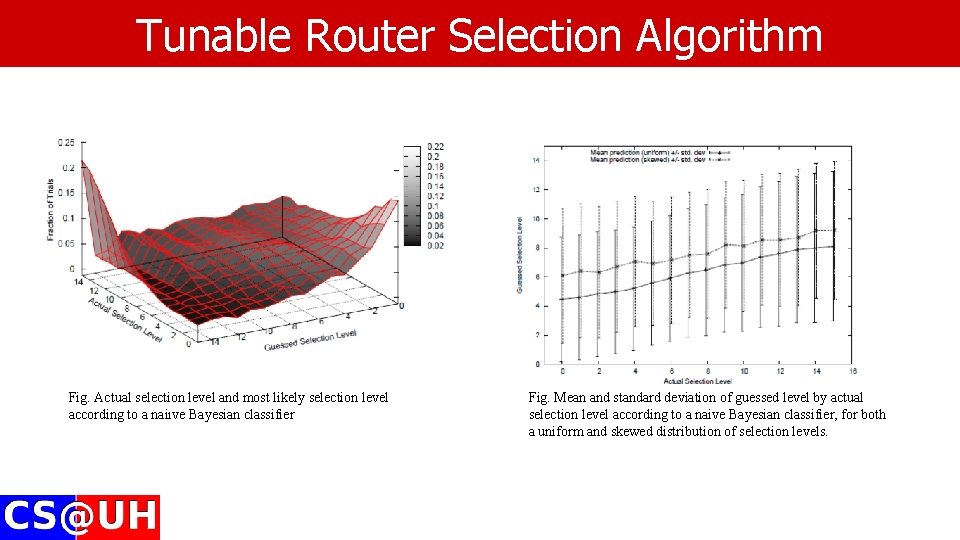
Tunable Router Selection Algorithm • Discovering Selection Level with Single Path ØWith single malicious router, hacker trains naïve Bayesian classifier with 100, 000 paths. Then applies the classifier to another 100, 000 paths for evaluation. ØUniform dataset achieves 4. 568 in absolute average value, 4. 567 in skewed dataset, in which level 0 is chosen 20% of the time, level 15 at 52%, all other levels 2% for each
Tunable Router Selection Algorithm Fig. Actual selection level and most likely selection level according to a naiıve Bayesian classifier Fig. Mean and standard deviation of guessed level by actual selection level according to a naive Bayesian classifier, for both a uniform and skewed distribution of selection levels.
Tunable Router Selection Algorithm • Discovering Selection Level with Multiple Paths ØHackers are able to correlate tunnels at a single level ØK-S (Kolmogorov-Smirnov) tests whether an empirical distribution fits a hypothesized distribution ØFor each selection level, 500 exit router one at a time, after each choice the range of selection levels passing the K-S test is recorded. The experiment repeats 100 times at each selection level.
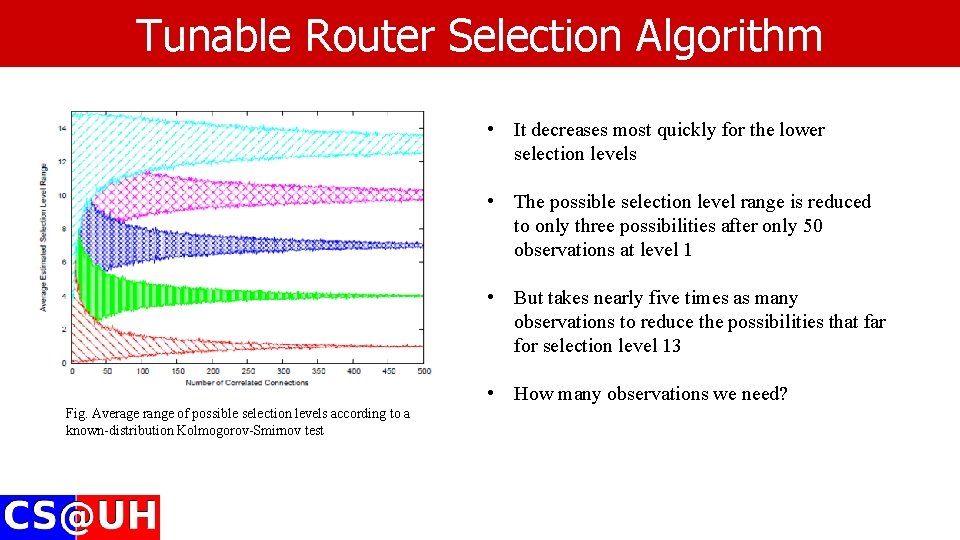
Tunable Router Selection Algorithm • It decreases most quickly for the lower selection levels • The possible selection level range is reduced to only three possibilities after only 50 observations at level 1 • But takes nearly five times as many observations to reduce the possibilities that far for selection level 13 • How many observations we need? Fig. Average range of possible selection levels according to a known-distribution Kolmogorov-Smirnov test
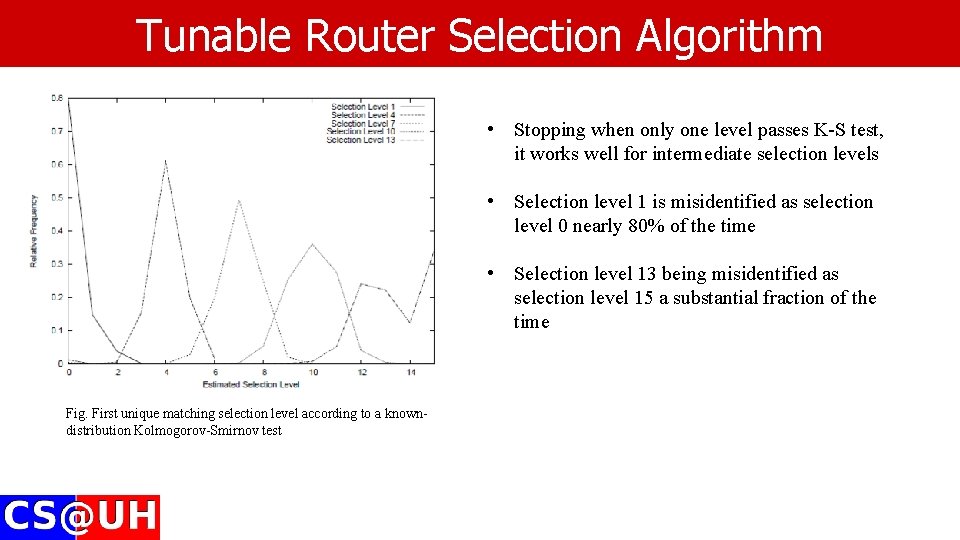
Tunable Router Selection Algorithm • Stopping when only one level passes K-S test, it works well for intermediate selection levels • Selection level 1 is misidentified as selection level 0 nearly 80% of the time • Selection level 13 being misidentified as selection level 15 a substantial fraction of the time Fig. First unique matching selection level according to a knowndistribution Kolmogorov-Smirnov test
Evaluation and Discussion • Whole System Evaluation ØPerformance ü Real Tor Network: Only one router is deployed ü Simulated Tor Network: All routers are deployed ØAnonymity
Evaluation and Discussion • Performance in Real Tor Network ØDeploy Tunable Tor to a single client ØKeep exit router, host server fixed, while intermediate routers are chosen based on the proposed method ØApproximately 40, 000 trials for native Tor client, 20, 000 trials for Tunable Tor client ØDownload 1 MB file over HTTP protocol
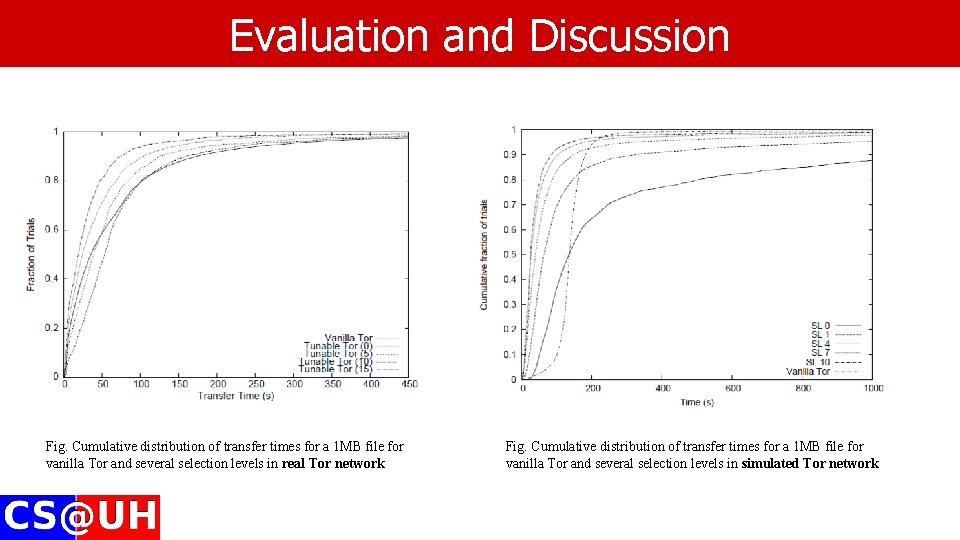
Evaluation and Discussion Fig. Cumulative distribution of transfer times for a 1 MB file for vanilla Tor and several selection levels in real Tor network Fig. Cumulative distribution of transfer times for a 1 MB file for vanilla Tor and several selection levels in simulated Tor network
Evaluation and Discussion • Anonymity Fig. Gini coefficient of router selection equality by selection level Fig. The fraction of tunnels compromised if an attacker compromises the top given fraction of Tor routers, for vanilla Tor and for various selection levels
Thank you! Questions?