Graph Algorithms Properties of Graphs William Cohen Outline


, pp. 425 -443. 64 of 296")


 • Start from a small number of node,")
 Preferential attachment (Barabasi-Albert)")


-F’(x)|} where F, F’ are cdf’s • max")
- Slides: 51
Graph Algorithms: Properties of Graphs? William Cohen
Outline • Last week: – Page. Rank – one algorithm on graphs • edges and nodes in memory • nothing in memory • This week: – William’s lecture • (Semi)Supervised learning on graphs • Properties of (social) graphs – Joey Gonzales guest lecture • Graph. Lab
Why I’m talking about graphs • Lots of large data is graphs – Facebook, Twitter, citation data, and other social networks – The web, the blogosphere, the semantic web, Freebase, Wikipedia, Twitter, and other information networks – Text corpora (like RCV 1), large datasets with discrete feature values, and other bipartite networks • nodes = documents or words • links connect document word or word document – Computer networks, biological networks (proteins, ecosystems, brains, …), … – Heterogeneous networks with multiple types of nodes • people, groups, documents
Properties of Graphs Descriptive Statistics • Number of connected components • Diameter • Degree distribution • … Models of Growth/Formation • Erdos-Renyi • Preferential attachment • Stochastic block models • …. Let’s look at some examples of graphs … but first, why are these statistics important?
An important question • How do you explore a dataset? – compute statistics (e. g. , feature histograms, conditional feature histograms, correlation coefficients, …) – sample and inspect • run a bunch of small-scale experiments • How do you explore a graph? – compute statistics (degree distribution, …) – sample and inspect • how do you sample?
Karate club
Schoolkids
Heart study participants
College football
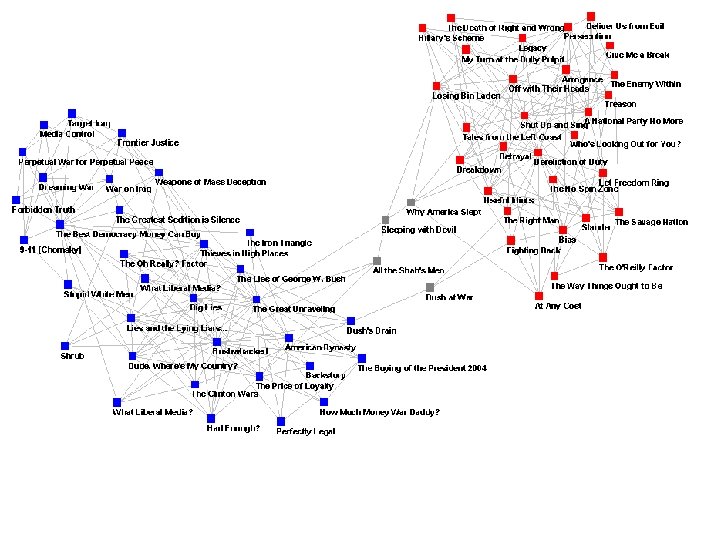
books
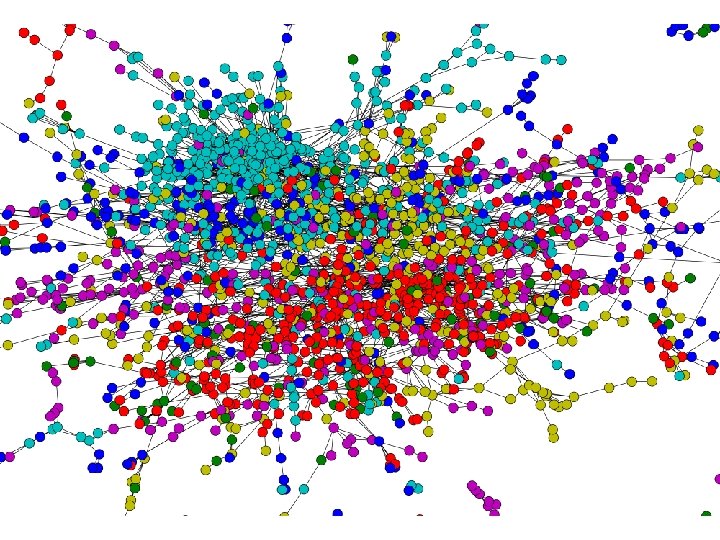
citations
How do you model graphs?
What are we trying to do? Normal curve: • Data to fit • Underlying process that “explains” the data • Closed-form parametric form • Only models a small part of the data
Graphs • Set V of vertices/nodes v 1, … , set E of edges (u, v), …. – Edges might be directed and/or weighted and/or labeled • Degree of v is #edges touching v – Indegree and Outdegree for directed graphs • Path is sequence of edges (v 0, v 1), (v 1, v 2), …. • Geodesic path between u and v is shortest path connecting them – Diameter is max u, v in V {length of geodesic between u, v} – Effective diameter is 90 th percentile – Mean diameter is over connected pairs • (Connected) component is subset of nodes that are all pairwise connected via paths • Clique is subset of nodes that are all pairwise connected via edges • Triangle is a clique of size three
Graphs • Some common properties of graphs: – Distribution of node degrees – Distribution of cliques (e. g. , triangles) – Distribution of paths • Diameter (max shortest-path) • Effective diameter (90 th percentile) • Connected components – … • Some types of graphs to consider: – Real graphs (social & otherwise) – Generated graphs: • Erdos-Renyi “Bernoulli” or “Poisson” • Watts-Strogatz “small world” graphs • Barbosi-Albert “preferential attachment” • …
Erdos-Renyi graphs • Take n nodes, and connect each pair with probability p – Mean degree is z=p(n-1)
Erdos-Renyi graphs • Take n nodes, and connect each pair with probability p – Mean degree is z=p(n-1) – Mean number of neighbors distance d from v is zd – How large does d need to be so that zd >=n ? • If z>1, d = log(n)/log(z) • If z<1, you can’t do it – So: • There tend to be either many small components (z<1) or one large one (z<1) giant connected component) – Another intuition: • If there a two large connected components, then with high probability a few random edges will link them up.
Erdos-Renyi graphs • Take n nodes, and connect each pair with probability p – Mean degree is z=p(n-1) – Mean number of neighbors distance d from v is zd – How large does d need to be so that zd >=n ? • If z>1, d = log(n)/log(z) • If z<1, you can’t do it – So: • If z>1, diameters tend to be small (relative to n)
Sociometry, Vol. 32, No. 4. (Dec. , 1969), pp. 425 -443. 64 of 296 chains succeed, avg chain length is 6. 2
Illustrations of the Small World • Millgram’s experiment • Erdős numbers – http: //www. ams. org/mathscinet/searchauthors. html • Bacon numbers – http: //oracleofbacon. org/ • Linked. In – http: //www. linkedin. com/ – Privacy issues: the whole network is not visible to all
Erdos-Renyi graphs • Take n nodes, and connect each pair with probability p – Mean degree is z=p(n-1) This is usually not a good model of degree distribution in natural networks
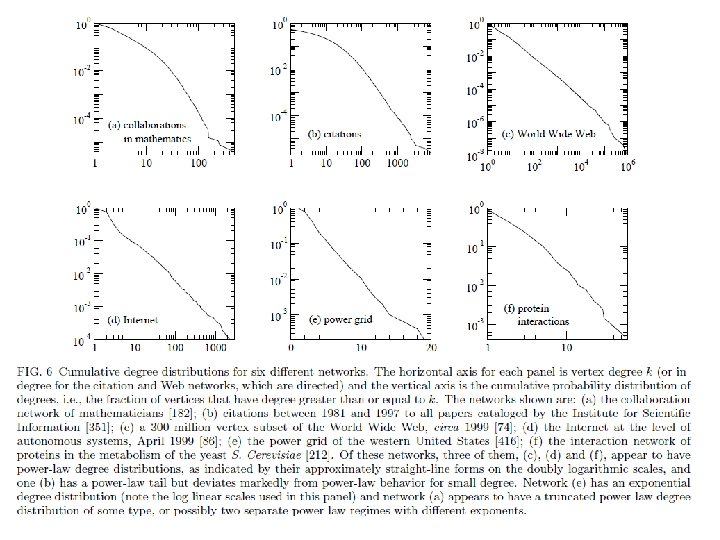
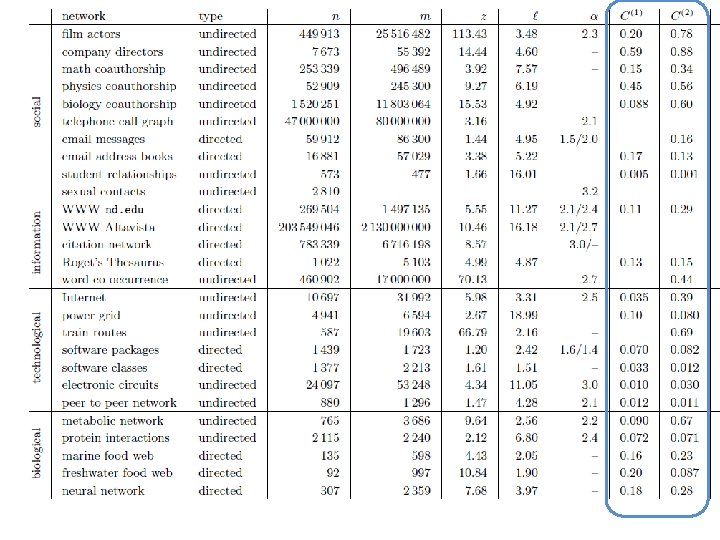
Degree distribution • Plot cumulative degree – X axis is degree – Y axis is #nodes that have degree at least k • Typically use a log-log scale – Straight lines are a power law; normal curve dives to zero at some point – Left: trust network in epinions web site from Richardson & Domingos
Degree distribution • Plot cumulative degree – X axis is degree – Y axis is #nodes that have degree at least k • Typically use a log-log scale – Straight lines are a power law; normal curve dives to zero at some point • This defines a “scale” for the network – Left: trust network in epinions web site from Richardson & Domingos
Friendship network in Framington Heart Study
Graphs • Some common properties of graphs: – Distribution of node degrees – Distribution of cliques (e. g. , triangles) – Distribution of paths • Diameter (max shortest-path) • Effective diameter (90 th percentile) • Connected components – … • Some types of graphs to consider: – Real graphs (social & otherwise) – Generated graphs: • Erdos-Renyi “Bernoulli” or “Poisson” • Watts-Strogatz “small world” graphs • Barbosi-Albert “preferential attachment” • …
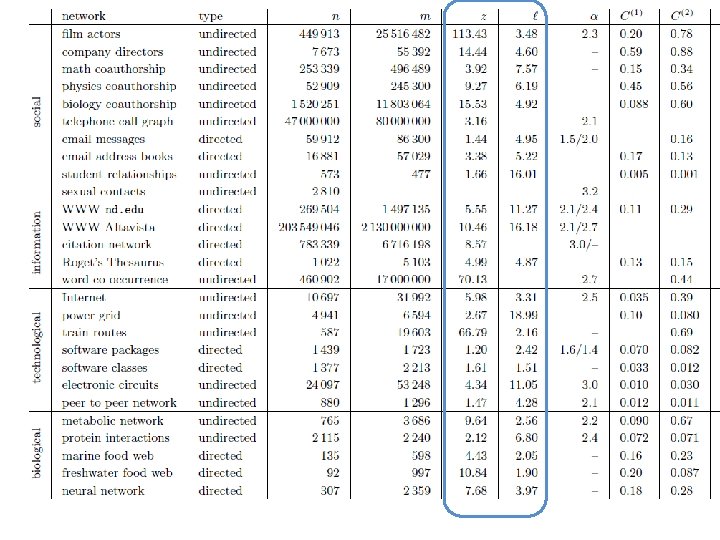
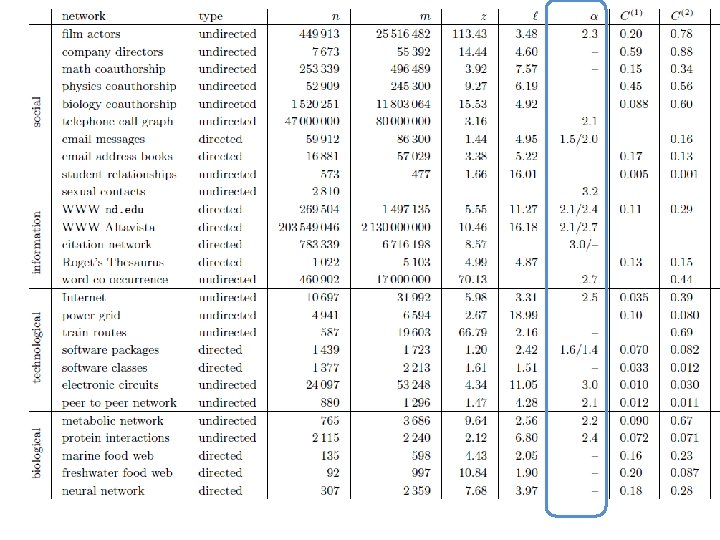
Graphs • Some common properties of graphs: – Distribution of node degrees: often scale-free – Distribution of cliques (e. g. , triangles) – Distribution of paths • Diameter (max shortestpath) • Effective diameter (90 th percentile) often small • Connected components usually one giant CC – … • Some types of graphs to consider: – Real graphs (social & otherwise) – Generated graphs: • Erdos-Renyi “Bernoulli” or “Poisson” • Watts-Strogatz “small world” graphs • Barbosi-Albert “preferential attachment” generates scale-free graphs • …
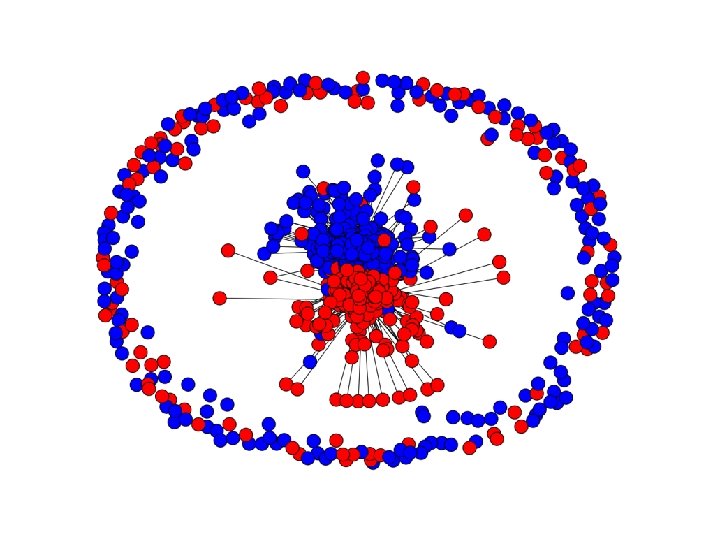
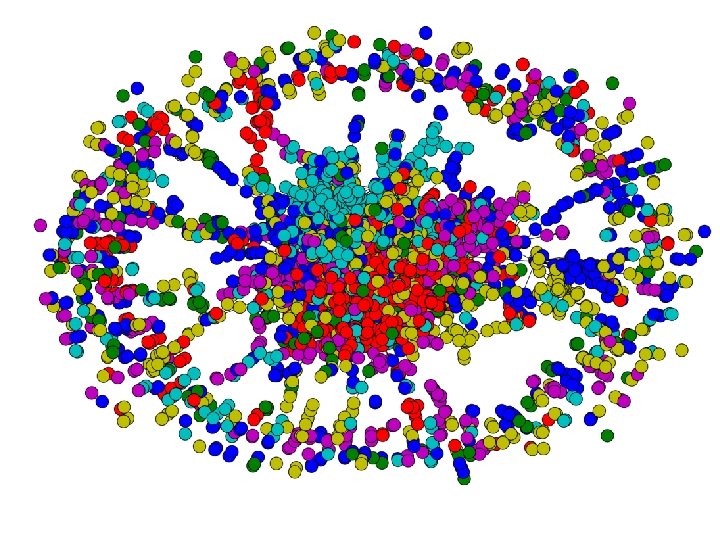
Barabasi-Albert Networks • Science 286 (1999) • Start from a small number of node, add a new node with m links • Preferential Attachment • Probability of these links to connect to existing nodes is proportional to the node’s degree • ‘Rich gets richer’ • This creates ‘hubs’: few nodes with very large degrees
Random graph (Erdos Renyi) Preferential attachment (Barabasi-Albert)
Graphs • Some common properties of graphs: – Distribution of node degrees: often scale-free – Distribution of cliques (e. g. , triangles) – Distribution of paths • Diameter (max shortestpath) • Effective diameter (90 th percentile) often small • Connected components usually one giant CC – … • Some types of graphs to consider: – Real graphs (social & otherwise) – Generated graphs: • Erdos-Renyi “Bernoulli” or “Poisson” • Watts-Strogatz “small world” graphs • Barbosi-Albert “preferential attachment” generates scale-free graphs • …
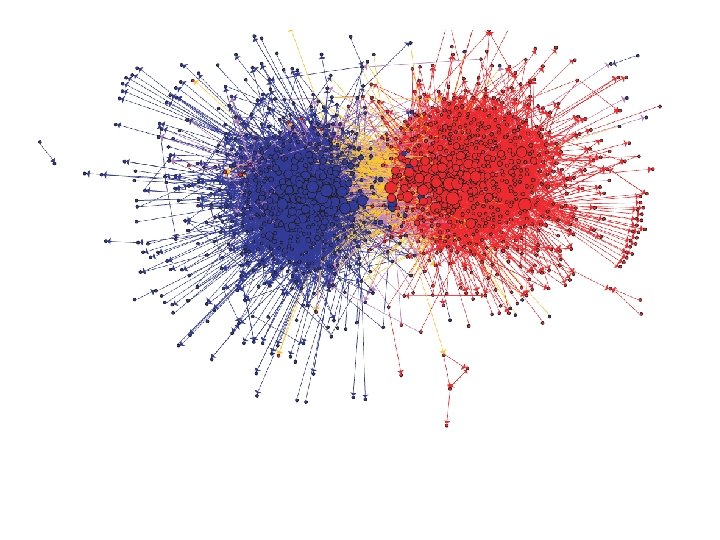
Homophily • One definition: excess edges between similar nodes – E. g. , assume nodes are male and female and Pr(male)=p, Pr(female)=q. – Is Pr(gender(u)≠ gender(v) | edge (u, v)) >= 2 pq? • Another def’n: excess edges between common neighbors of v
Homophily • Another def’n: excess edges between common neighbors of v
Homophily • In a random Erdos-Renyi graph: In natural graphs two of your mutual friends might well be friends: • Like you they are both in the same class (club, field of CS, …) • You introduced them
Watts-Strogatz model • Start with a ring • Connect each node to k nearest neighbors • homophily • Add some random shortcuts from one point to another • small diameter • Degree distribution not scale-free • Generalizes to d dimensions
An important question • How do you explore a dataset? – compute statistics (e. g. , feature histograms, conditional feature histograms, correlation coefficients, …) – sample and inspect • run a bunch of small-scale experiments • How do you explore a graph? – compute statistics (degree distribution, …) – sample and inspect • how do you sample?
KDD 2006
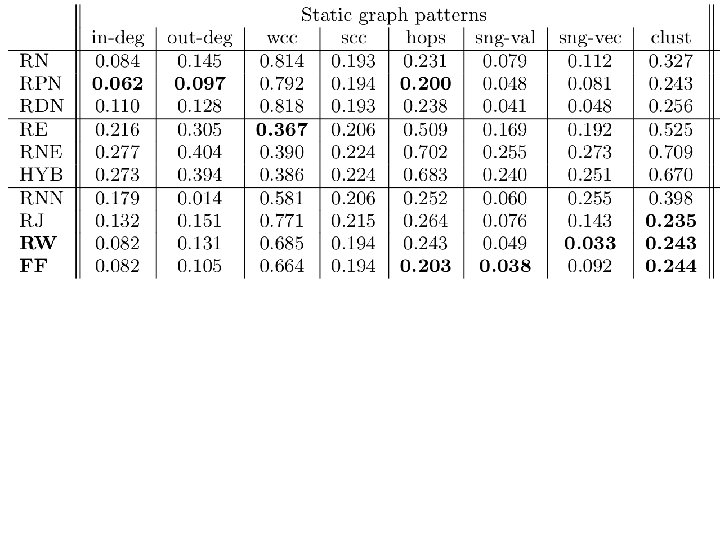
Brief summary • Define goals of sampling: – “scale-down” – find G’<G with similar statistics – “back in time”: for a growing G, find G’<G that is similar (statistically) to an earlier version of G • Experiment on real graphs with plausible sampling methods, such as – RN – random nodes, sampled uniformly –… • See how well they perform
Brief summary • Experiment on real graphs with plausible sampling methods, such as – RN – random nodes, sampled uniformly • RPN – random nodes, sampled by Page. Rank • RDP – random nodes sampled by in-degree – RE – random edges – RJ – run Page. Rank’s “random surfer” for n steps – RW – run RWR’s “random surfer” for n steps – FF – repeatedly pick r(i) neighbors of i to “burn”, and then recursively sample from them
10% sample – pooled on five datasets
d-statistic measures agreement between distributions • D=max{|F(x)-F’(x)|} where F, F’ are cdf’s • max over nine different statistics