
New Statistics Cumming 2014 Online workshop available at
New Statistics – Cumming (2014) • Online workshop available at www. psychologicalscience. org • Free download of Excel sheets = ESCI (Exploratory Software for Confidence Intervals) at http: //thenewstatistics. com/itns/esci/ • Goal to replace p values and NHST • Actually none of the statistics are new – Effect size (ES) – Confidence intervals (CIs) – Meta-Analysis
8 Step New Statistics Strategy • Formulate research questions in estimation terms – “How large is the effect? ” – “To what extent. . . ? ” – Avoid dichotomous thinking such as “Is this treatment better? ” • Identify the ES that will best answer the research questions – If research question is in terms of difference between 2 means, then that difference = ES required – If question is how well model described data, then ES is measure of goodness of fit • Declare full details of the intended procedure and data analysis – Preregistration
8 Step New Statistics Strategy • After running study, calculate point estimate and CIs for chosen ES • Make 1 or > figures including CIs – Use error bars in graphs to depict CIs not SEs –example later • Interpret the ES and CIs – Consider theoretical and practical implications – Discuss CI length = precision • Use meta-analytic thinking – Present results to facilitate their inclusion in future meta-analyses – Use meta-analyses to integrate findings • Reporting on 3 studies, then meta-analyze three studies at end of paper • Report – Make full and transparent description of research and analysis including raw data available to other researchers
Effect Size (ES) • Amount of anything of interest – Means, differences between means, frequencies, correlations, etc. – p value is not an ES – Cohen (1965) primary outcome of interest in research not p values • Sample ES = point estimate of population ES
ES and p Values • Can find effect is not statistically significant but is practically significant – Juvenile delinquency intervention d =. 11 (Wilson et al. , 2013) – May not seem like much but that small effect is a 5% difference in the recidivism rate • So it had a meaningful impact on a lot of juveniles’ lives • Alternatively statistically significant effects can be practically insignificant – May not even be noticeable
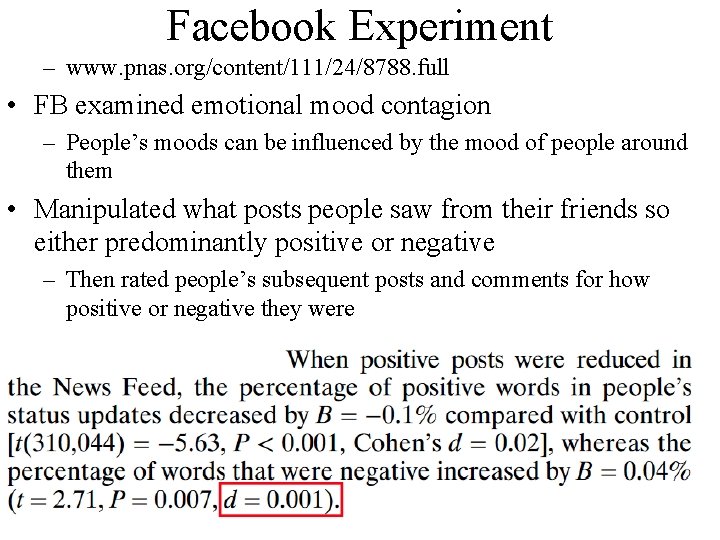
Facebook Experiment – www. pnas. org/content/111/24/8788. full • FB examined emotional mood contagion – People’s moods can be influenced by the mood of people around them • Manipulated what posts people saw from their friends so either predominantly positive or negative – Then rated people’s subsequent posts and comments for how positive or negative they were
Facebook Experiment • A number of ethical concerns – No informed consent – No IRB review – Other concerns: • Nancy J. Smyth, Dean of University of Buffalo’s School of Social Work: “There might even have bene increased self-harm episodes, out of control anger, or dare I say it, suicide attempts or suicides that resulted from the experimental manipulation. ” • How much effect did the manipulation really have? – d =. 001 can be translated into for every 3570 words a person typed, 1 more negative word in the negative condition • Unlikely anyone would even notice including person being manipulated – This tiny effect was significant because the N was enormous • df = 310, 044
Country Music Study • ES also can be implausibly large – Discussed last week with studies by Kanazawa and Duarte et al. – Makes wonder what really being studied • Stack & Gundlach (1992): > proportion of radio airtime devoted to country music > white suicide rates, r =. 54, p <. 05. – This is a large effect size, so should be noticeable • Saying country music accounts for nearly one-third (29%) of variance in suicide rates • Suicide is a low base rate behavior, so unlikely any one factor could identify to account for this much variance or predictive power – Won an Ig Noble prize for improbable research • http: //www. improbable. com/ig/ – Not surprisingly study was not replicated
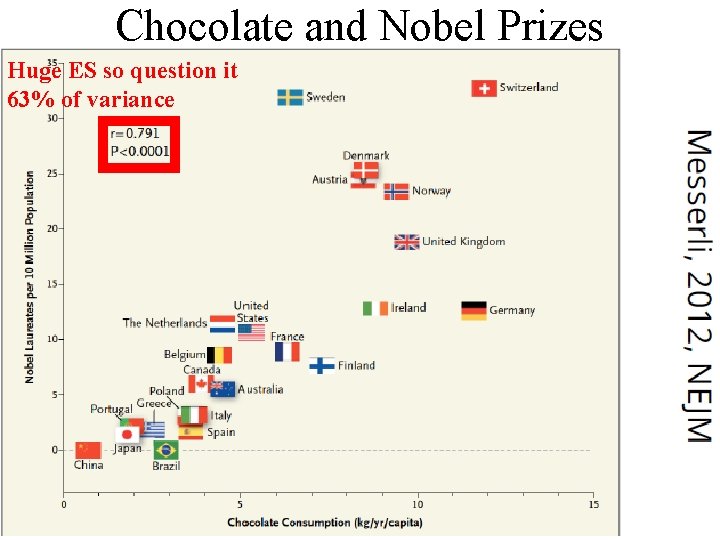
Chocolate and Nobel Prizes Huge ES so question it 63% of variance
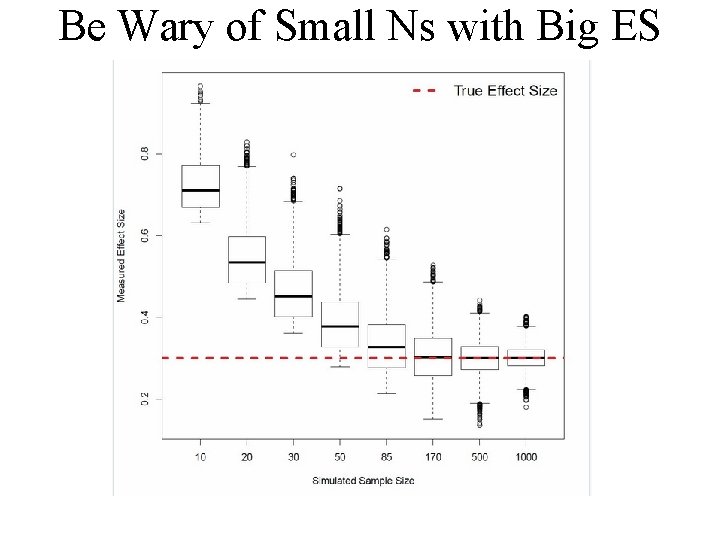
Be Wary of Small Ns with Big ES
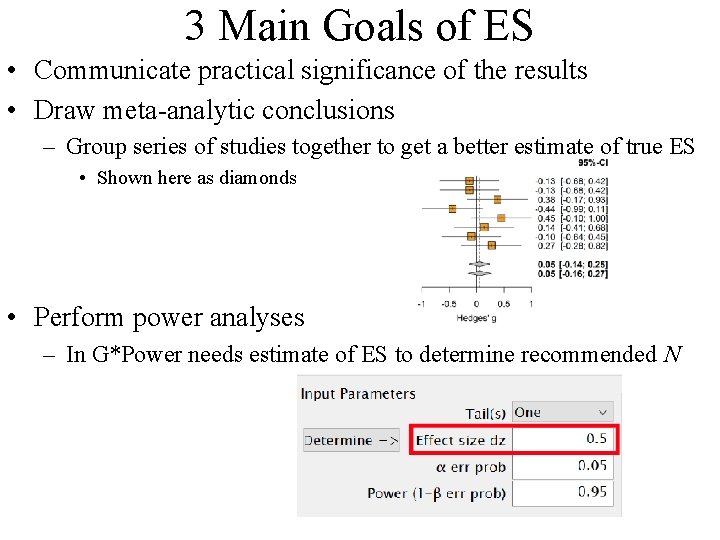
3 Main Goals of ES • Communicate practical significance of the results • Draw meta-analytic conclusions – Group series of studies together to get a better estimate of true ES • Shown here as diamonds • Perform power analyses – In G*Power needs estimate of ES to determine recommended N
Different Types of ES • Unstandardized ES – Keep scale in original metric – Simply report difference between 2 groups – For example, two racers: Unstandardized ES = difference in their 2 times in minutes or seconds – Very easy to understand = clear meaning, but few measures in psychology have meaningful metrics • For example, can use 1 -7 score or 1 -5 scale to measure the same construct • But a score of 5 will have a different meaning in 2 cases • Standardized ES – Not in original metric of measure but converted to a common metric – For example, Cohen’s d is in terms of SDs, whereas r is a correlation, so ES ranges from -1 to 1
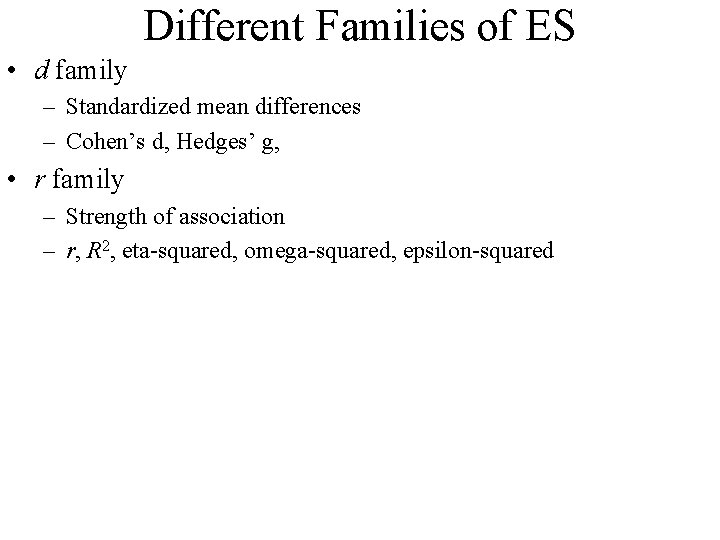
Different Families of ES • d family – Standardized mean differences – Cohen’s d, Hedges’ g, • r family – Strength of association – r, R 2, eta-squared, omega-squared, epsilon-squared
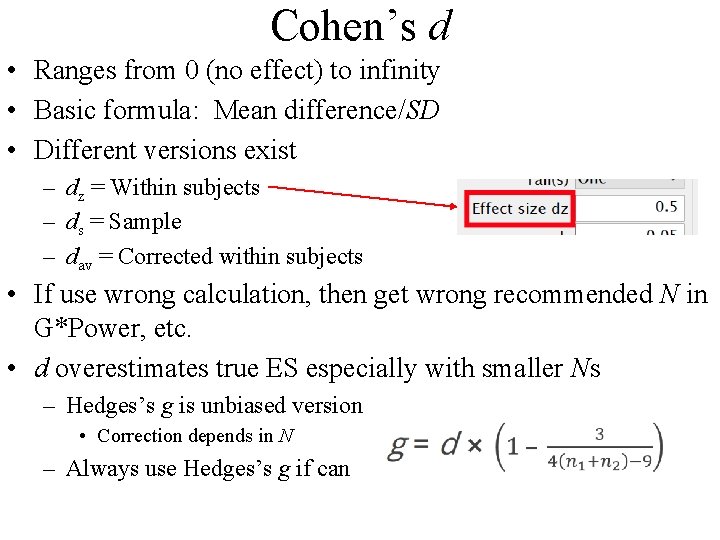
Cohen’s d • Ranges from 0 (no effect) to infinity • Basic formula: Mean difference/SD • Different versions exist – dz = Within subjects – ds = Sample – dav = Corrected within subjects • If use wrong calculation, then get wrong recommended N in G*Power, etc. • d overestimates true ES especially with smaller Ns – Hedges’s g is unbiased version • Correction depends in N – Always use Hedges’s g if can
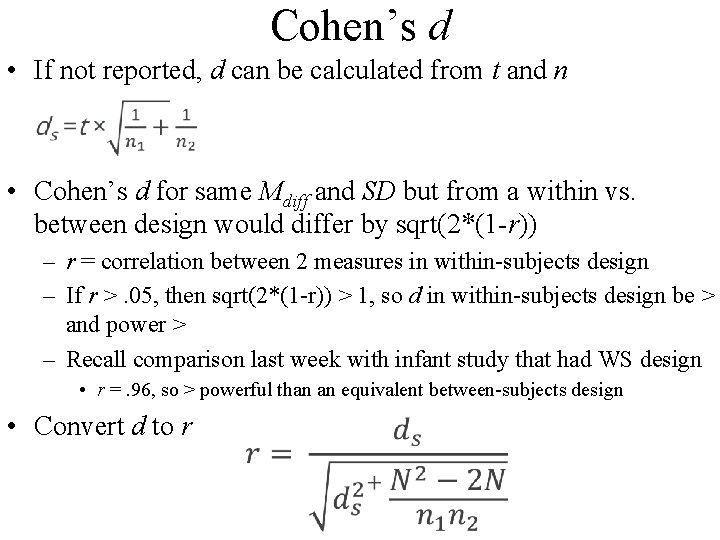
Cohen’s d • If not reported, d can be calculated from t and n • Cohen’s d for same Mdiff and SD but from a within vs. between design would differ by sqrt(2*(1 -r)) – r = correlation between 2 measures in within-subjects design – If r >. 05, then sqrt(2*(1 -r)) > 1, so d in within-subjects design be > and power > – Recall comparison last week with infant study that had WS design • r =. 96, so > powerful than an equivalent between-subjects design • Convert d to r
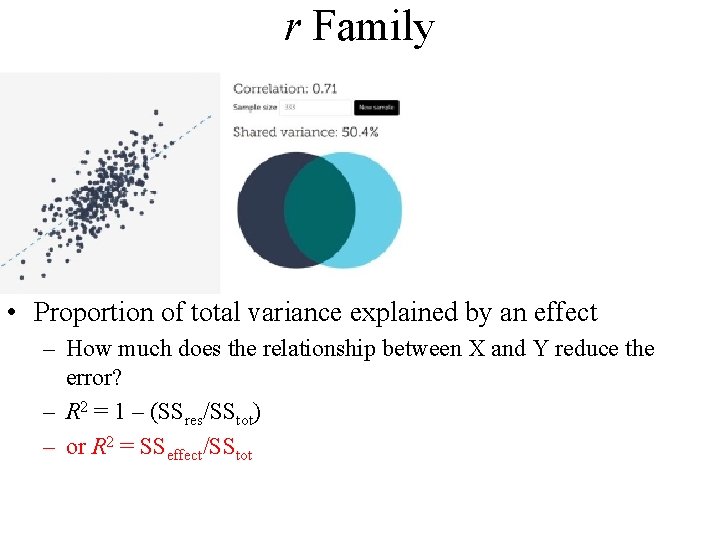
r Family • Proportion of total variance explained by an effect – How much does the relationship between X and Y reduce the error? – R 2 = 1 – (SSres/SStot) – or R 2 = SSeffect/SStot
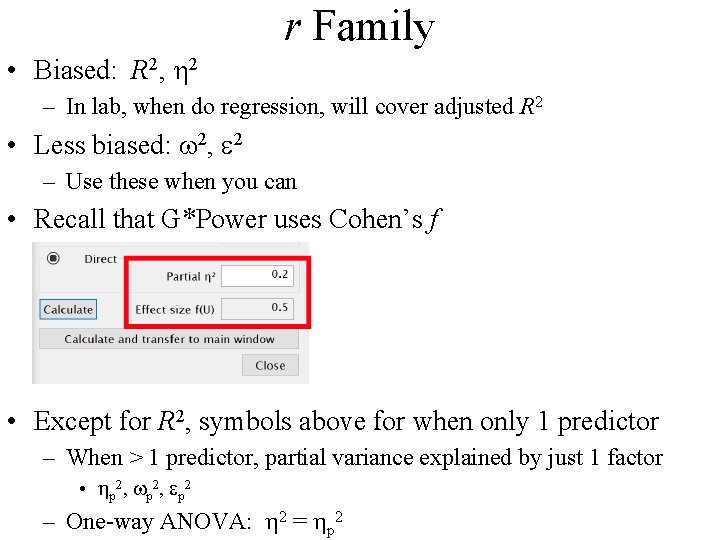
r Family • Biased: R 2, h 2 – In lab, when do regression, will cover adjusted R 2 • Less biased: w 2, e 2 – Use these when you can • Recall that G*Power uses Cohen’s f • Except for R 2, symbols above for when only 1 predictor – When > 1 predictor, partial variance explained by just 1 factor • hp 2 , wp 2 , e p 2 – One-way ANOVA: h 2 = hp 2
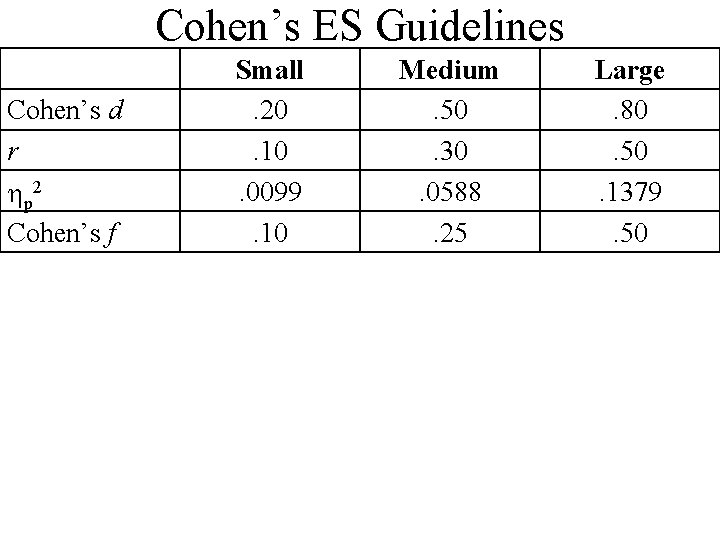
Cohen’s ES Guidelines Cohen’s d r hp 2 Cohen’s f Small. 20. 10. 0099. 10 Medium. 50. 30. 0588. 25 Large. 80. 50. 1379. 50
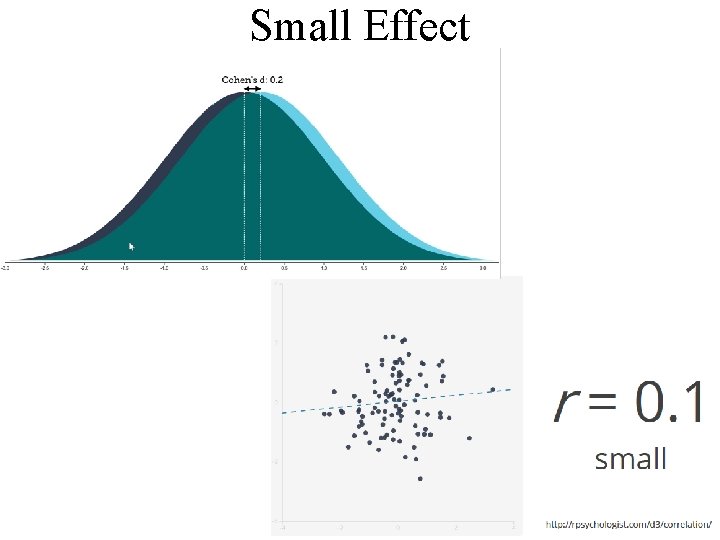
Small Effect
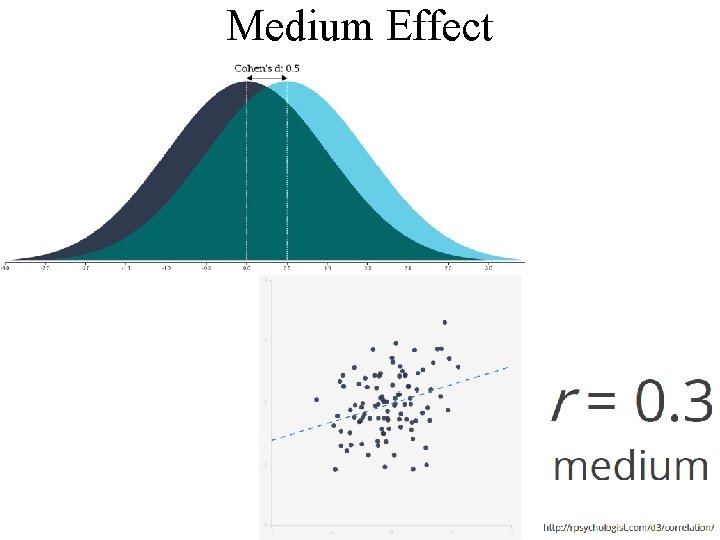
Medium Effect
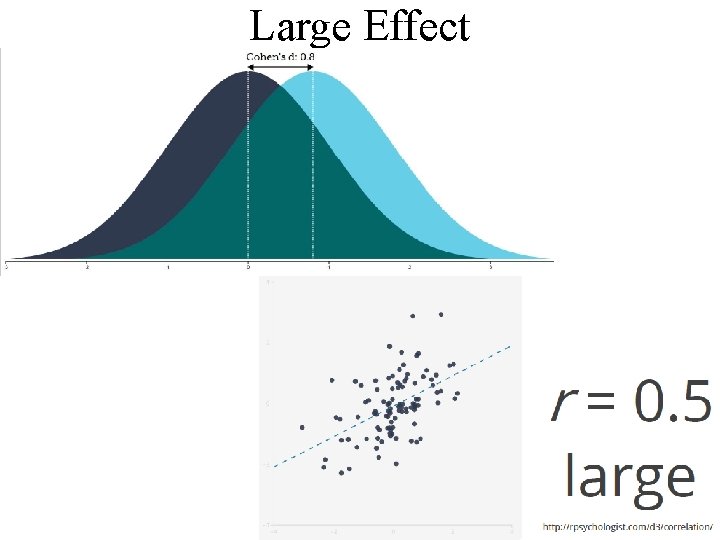
Large Effect
Caution about T-Shirt ES Guidelines • Made up by Cohen – No empirical basis, no validation, just his best guess. – So use with caution and only as a last resort • Better to relate your study’s ES to known effect in real world or something more pragmatic to help people understand (below from Cumming, 2014) – Pain research: Change in rating of 10 mm on 100 mm visual analog scale = smallest change of clinical importance – Decrease of 15% in memory score = smallest change of clinical interest – Beck Depression Inventory cut offs for mild, moderate, severe
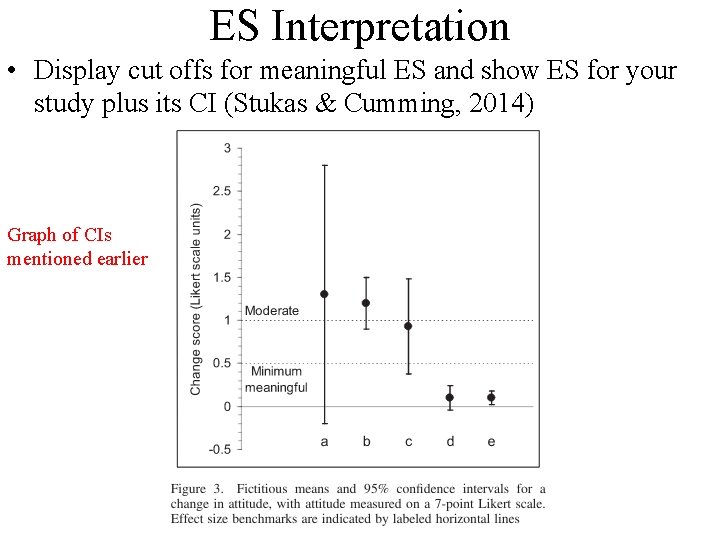
ES Interpretation • Display cut offs for meaningful ES and show ES for your study plus its CI (Stukas & Cumming, 2014) Graph of CIs mentioned earlier
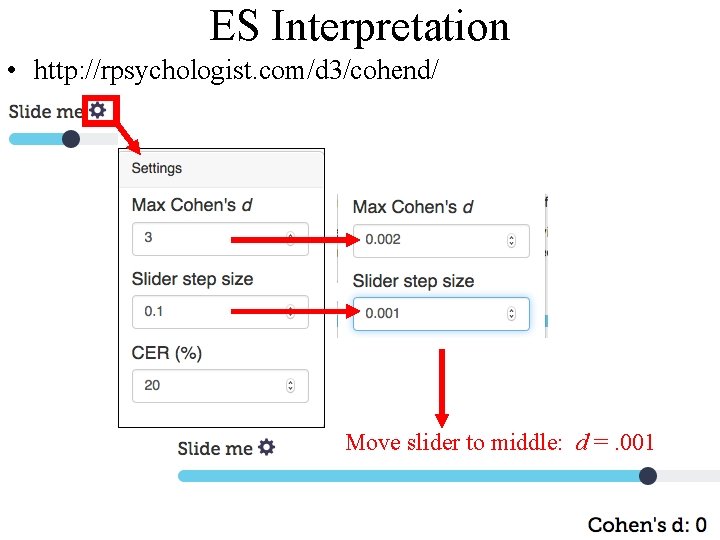
ES Interpretation • http: //rpsychologist. com/d 3/cohend/ Move slider to middle: d =. 001
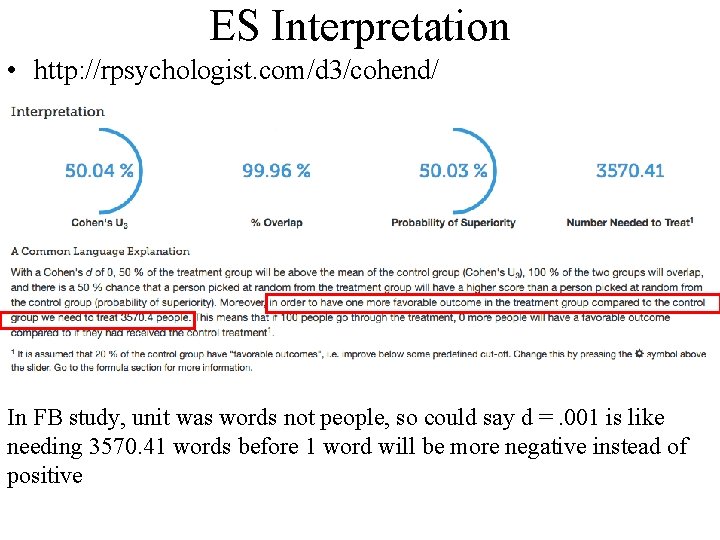
ES Interpretation • http: //rpsychologist. com/d 3/cohend/ In FB study, unit was words not people, so could say d =. 001 is like needing 3570. 41 words before 1 word will be more negative instead of positive
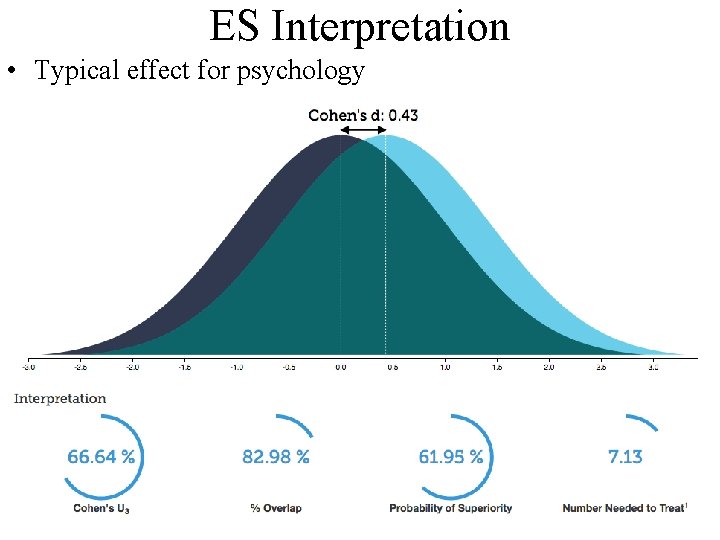
ES Interpretation • Typical effect for psychology
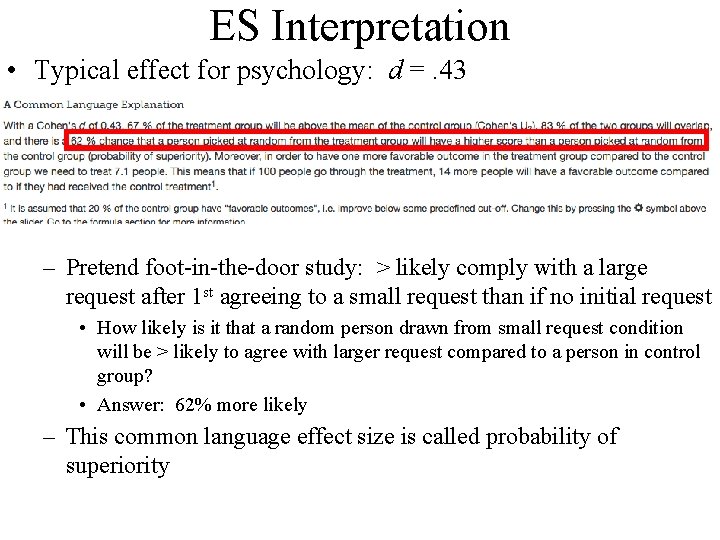
ES Interpretation • Typical effect for psychology: d =. 43 – Pretend foot-in-the-door study: > likely comply with a large request after 1 st agreeing to a small request than if no initial request • How likely is it that a random person drawn from small request condition will be > likely to agree with larger request compared to a person in control group? • Answer: 62% more likely – This common language effect size is called probability of superiority
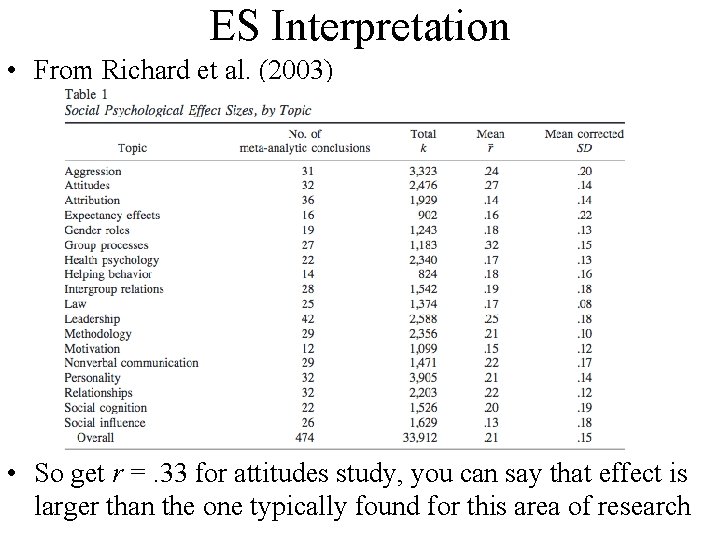
ES Interpretation • From Richard et al. (2003) • So get r =. 33 for attitudes study, you can say that effect is larger than the one typically found for this area of research
Criticisms of ES Approach – When Small Effects Are Impressive (Prentice & Miller, 1992) • Often insightful to show that minimal manipulation of IV still accounts for some variance in DV – Tajfel’s minimal group paradigm • Even though groups based on meaningless classification and had no contact, still preferred and benefited fellow group members – Demonstrates how fundamental ingroup favoritism or ethnocentrism is • Even when explicitly randomly assigned to group, still favored it – Even under most inauspicious circumstances, IV still affects DV • Alternatively showing IV can affect a hard to change DV – Effects of defendant physical attractiveness on judgments of guilt and punishments – Asch’s conformity studies – clearly wrong and still agreed • Goal here not application but understanding phenomenon
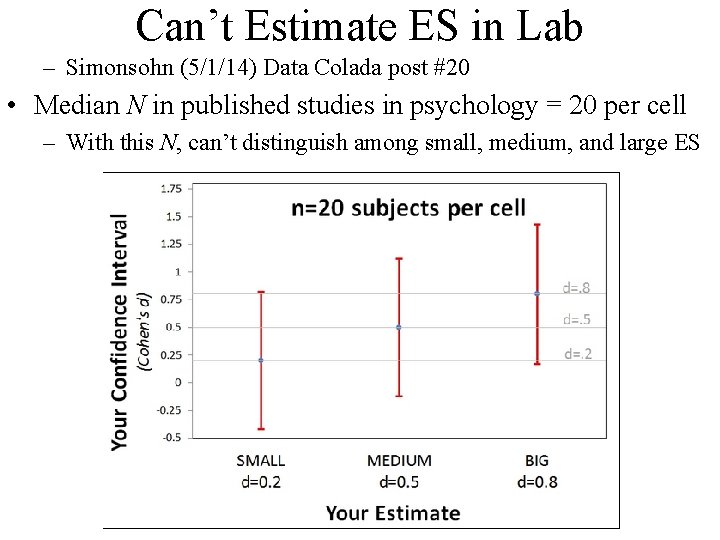
Can’t Estimate ES in Lab – Simonsohn (5/1/14) Data Colada post #20 • Median N in published studies in psychology = 20 per cell – With this N, can’t distinguish among small, medium, and large ES
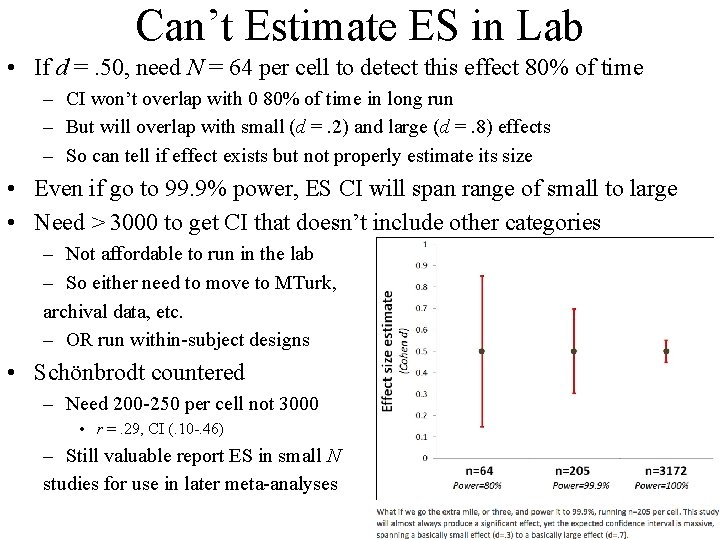
Can’t Estimate ES in Lab • If d =. 50, need N = 64 per cell to detect this effect 80% of time – CI won’t overlap with 0 80% of time in long run – But will overlap with small (d =. 2) and large (d =. 8) effects – So can tell if effect exists but not properly estimate its size • Even if go to 99. 9% power, ES CI will span range of small to large • Need > 3000 to get CI that doesn’t include other categories – Not affordable to run in the lab – So either need to move to MTurk, archival data, etc. – OR run within-subject designs • Schönbrodt countered – Need 200 -250 per cell not 3000 • r =. 29, CI (. 10 -. 46) – Still valuable report ES in small N studies for use in later meta-analyses
ES Criticisms • Already mentioned several times now that ES, at least in the literature, are likely inflated or biased estimates of true ES • So not clear how much should use them for evaluation
Readings • • http: //rpsychologist. com/d 3/cohend/ http: //rpsychologist. com/d 3/correlation/ http: //people. uncw. edu/galizio/PSY 589/Cummings 2014. pdf http: //www. psychologicalscience. org/members/new-statistics
- Slides: 33