SAMPLING LOUIS COHEN LAWRENCE MANION AND KEITH MORRISON
- Slides: 48
SAMPLING © LOUIS COHEN, LAWRENCE MANION AND KEITH MORRISON © 2018 Louis Cohen, Lawrence Manion and Keith Morrison; individual chapters, the contributors
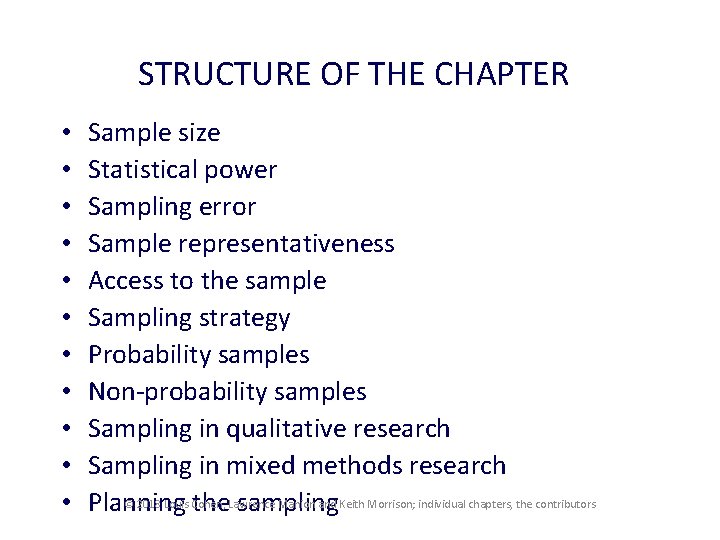
STRUCTURE OF THE CHAPTER • • • Sample size Statistical power Sampling error Sample representativeness Access to the sample Sampling strategy Probability samples Non-probability samples Sampling in qualitative research Sampling in mixed methods research © 2018 Louis Cohen, Manion and Keith Morrison; individual chapters, the contributors Planning the. Lawrence sampling
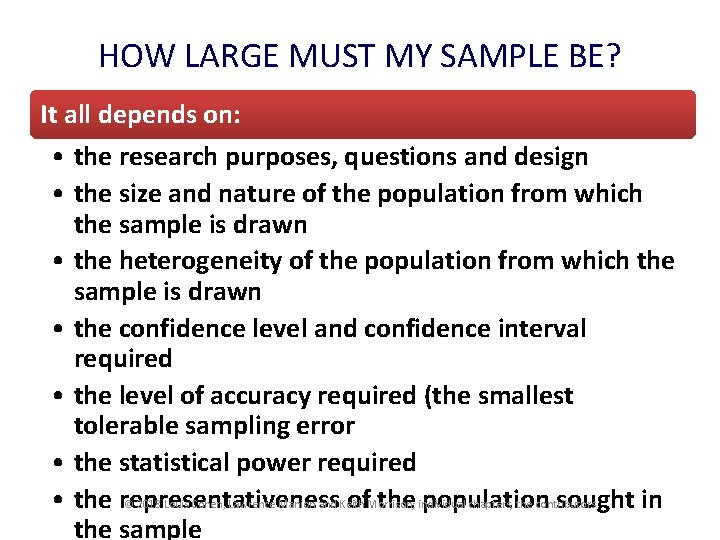
HOW LARGE MUST MY SAMPLE BE? It all depends on: • the research purposes, questions and design • the size and nature of the population from which the sample is drawn • the heterogeneity of the population from which the sample is drawn • the confidence level and confidence interval required • the level of accuracy required (the smallest tolerable sampling error • the statistical power required © 2018 Louis Cohen, Lawrence Manion and Keith chapters, the contributors • the representativeness of. Morrison; the individual population sought in the sample
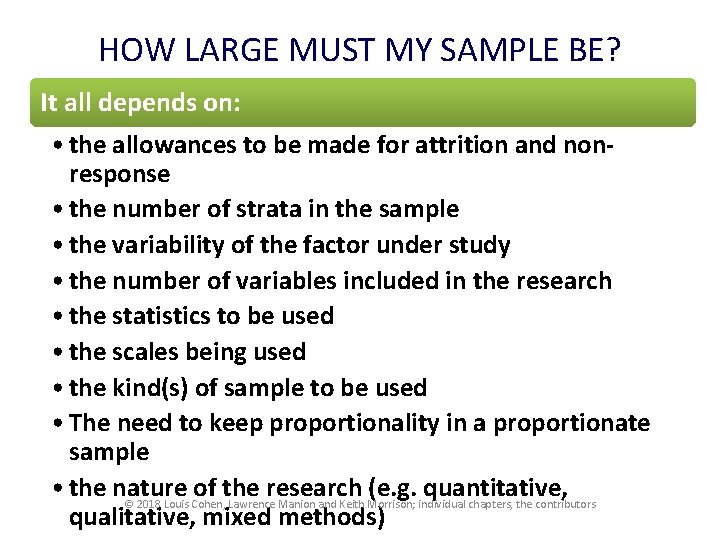
HOW LARGE MUST MY SAMPLE BE? It all depends on: • the allowances to be made for attrition and nonresponse • the number of strata in the sample • the variability of the factor under study • the number of variables included in the research • the statistics to be used • the scales being used • the kind(s) of sample to be used • The need to keep proportionality in a proportionate sample • the nature of the research (e. g. quantitative, © 2018 Louis Cohen, Lawrence Manion and Keith Morrison; individual chapters, the contributors qualitative, mixed methods)
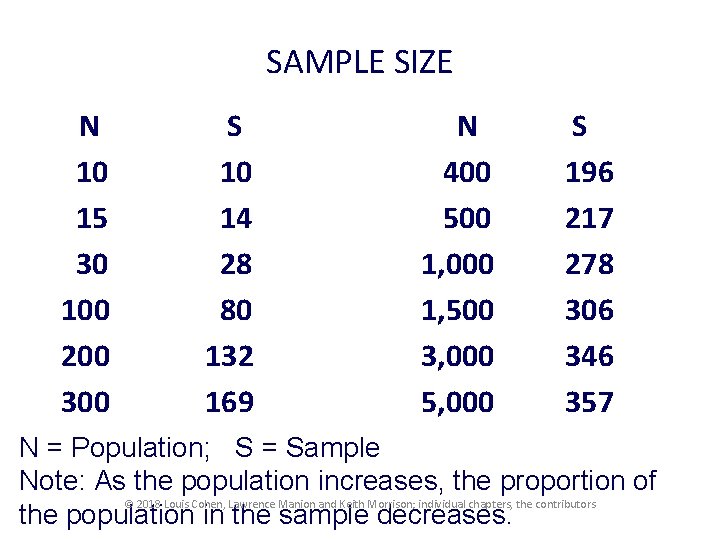
SAMPLE SIZE N 10 15 30 100 200 300 S 10 14 28 80 132 169 N 400 500 1, 000 1, 500 3, 000 5, 000 S 196 217 278 306 346 357 N = Population; S = Sample Note: As the population increases, the proportion of © 2018 Louis Cohen, Lawrence Manion and Keith Morrison; individual chapters, the contributors the population in the sample decreases.
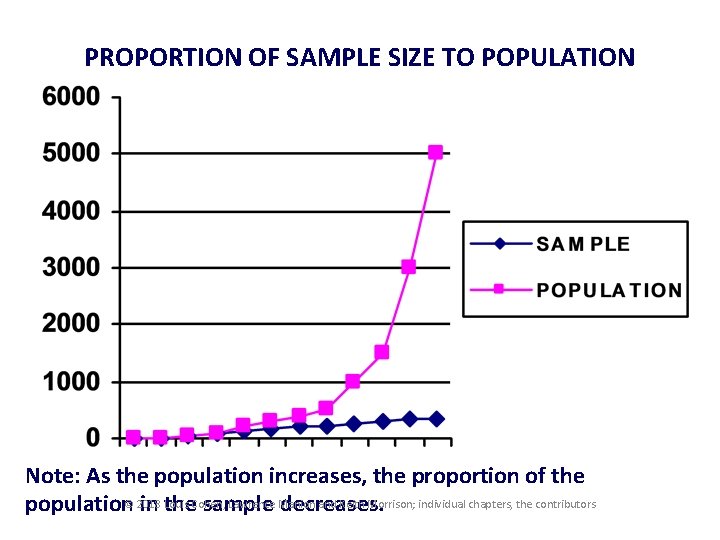
PROPORTION OF SAMPLE SIZE TO POPULATION Note: As the population increases, the proportion of the Lawrence Manion and Keith Morrison; individual chapters, the contributors population© 2018 in Louis the. Cohen, sample decreases.
SAMPLE SIZE • Ensure a sufficiently large sample for each variable. • Samples in qualitative research must be large enough to generate ‘thick descriptions’. • A large sample does not guarantee representativeness; representativeness depends on the sampling strategy. • Sample size also depends on the heterogeneity or homogeneity of the population: if it is highly homogeneous then a smaller sample may be possible. © 2018 Louis Cohen, Lawrence Manion and Keith Morrison; individual chapters, the contributors
SAMPLE SIZE Large samples are preferable when: • there are many variables; • only small differences or small relationships are expected or predicted; • the sample will be broken down into subgroups; • the sample is heterogeneous in terms of the variables under study; • reliable measures of the dependent variable are unavailable. © 2018 Louis Cohen, Lawrence Manion and Keith Morrison; individual chapters, the contributors
SAMPLE SIZE • A weighted sample may be required if there are small sub-groups of populations. • A weighted sample: where a higher proportion of the sub-group is sampled, and then the results are subsequently scaled down to be fairer in relation to the whole sample. © 2018 Louis Cohen, Lawrence Manion and Keith Morrison; individual chapters, the contributors
SAMPLE SIZE • Sample size depends on the style of research (e. g. surveys may require large samples, ethnographies may require smaller samples). • Sample size depends on the numbers of variables to be used, the kinds of variables, and the statistics to be calculated. • Sample size depends on the scales being used in measurement (the large the scale, the larger the sample). © 2018 Louis Cohen, Lawrence Manion and Keith Morrison; individual chapters, the contributors
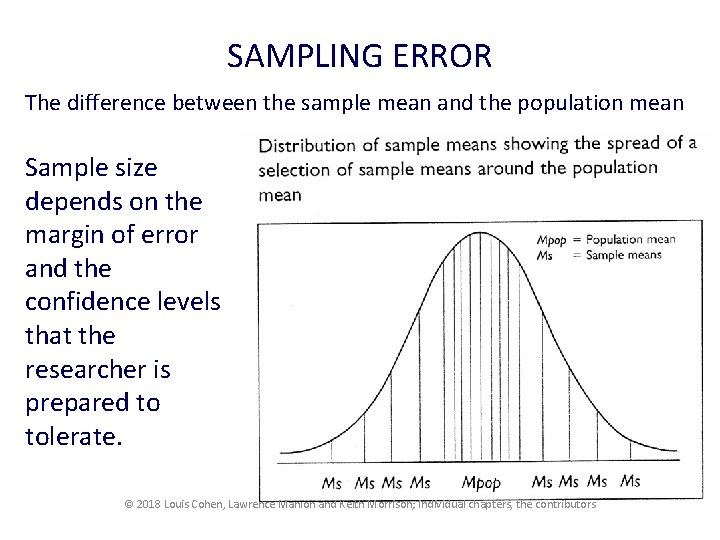
SAMPLING ERROR The difference between the sample mean and the population mean Sample size depends on the margin of error and the confidence levels that the researcher is prepared to tolerate. © 2018 Louis Cohen, Lawrence Manion and Keith Morrison; individual chapters, the contributors
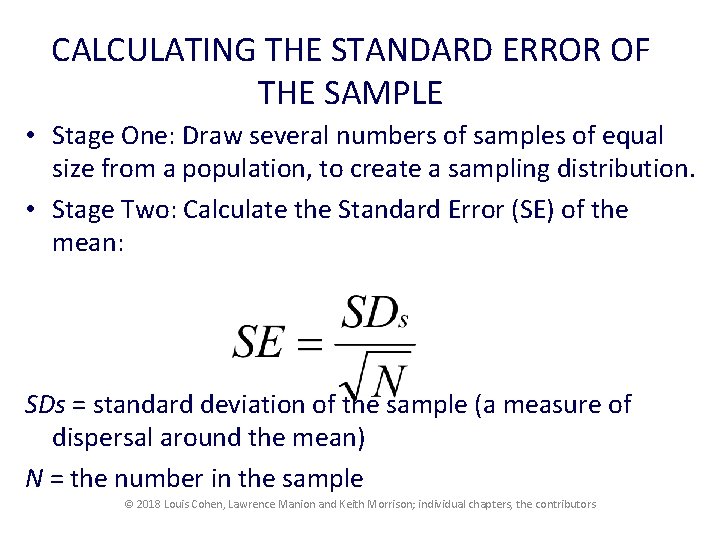
CALCULATING THE STANDARD ERROR OF THE SAMPLE • Stage One: Draw several numbers of samples of equal size from a population, to create a sampling distribution. • Stage Two: Calculate the Standard Error (SE) of the mean: SDs = standard deviation of the sample (a measure of dispersal around the mean) N = the number in the sample © 2018 Louis Cohen, Lawrence Manion and Keith Morrison; individual chapters, the contributors
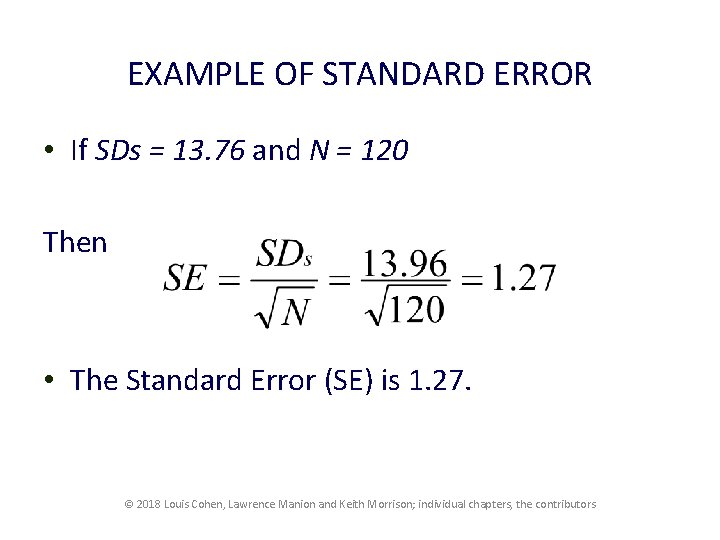
EXAMPLE OF STANDARD ERROR • If SDs = 13. 76 and N = 120 Then • The Standard Error (SE) is 1. 27. © 2018 Louis Cohen, Lawrence Manion and Keith Morrison; individual chapters, the contributors
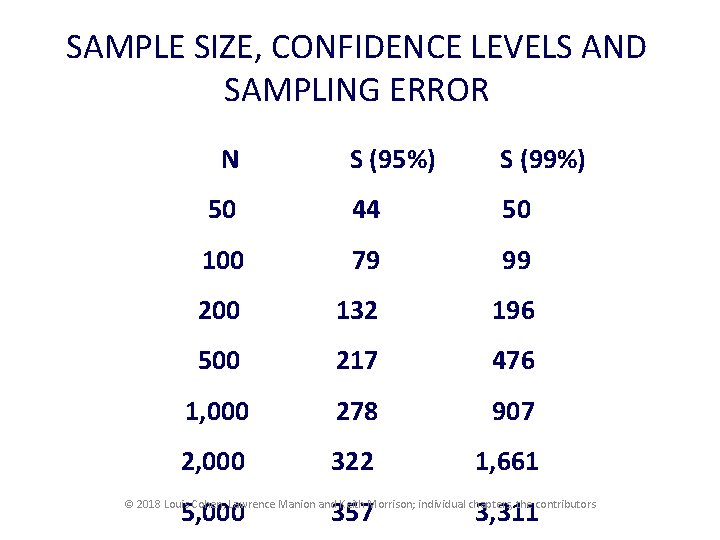
SAMPLE SIZE, CONFIDENCE LEVELS AND SAMPLING ERROR N S (95%) S (99%) 50 44 50 100 79 99 200 132 196 500 217 476 1, 000 278 907 2, 000 322 1, 661 5, 000 357 3, 311 © 2018 Louis Cohen, Lawrence Manion and Keith Morrison; individual chapters, the contributors
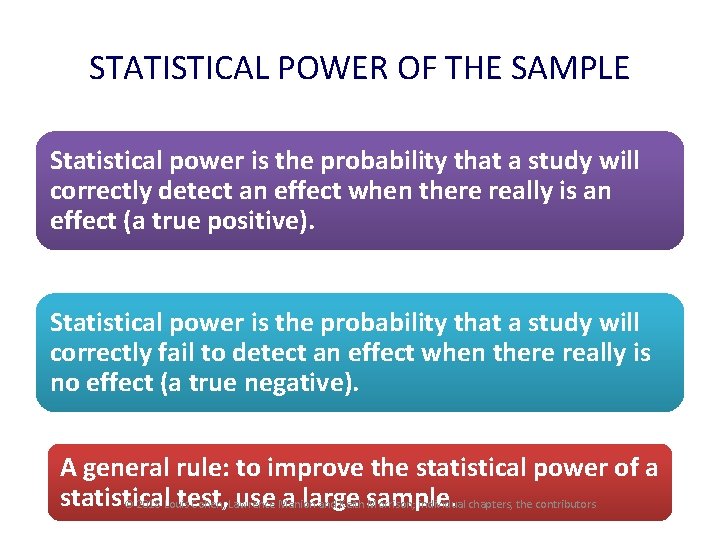
STATISTICAL POWER OF THE SAMPLE Statistical power is the probability that a study will correctly detect an effect when there really is an effect (a true positive). Statistical power is the probability that a study will correctly fail to detect an effect when there really is no effect (a true negative). A general rule: to improve the statistical power of a statistical test, use Manion a large. chapters, the contributors © 2018 Louis Cohen, Lawrence and Keith sample Morrison; individual
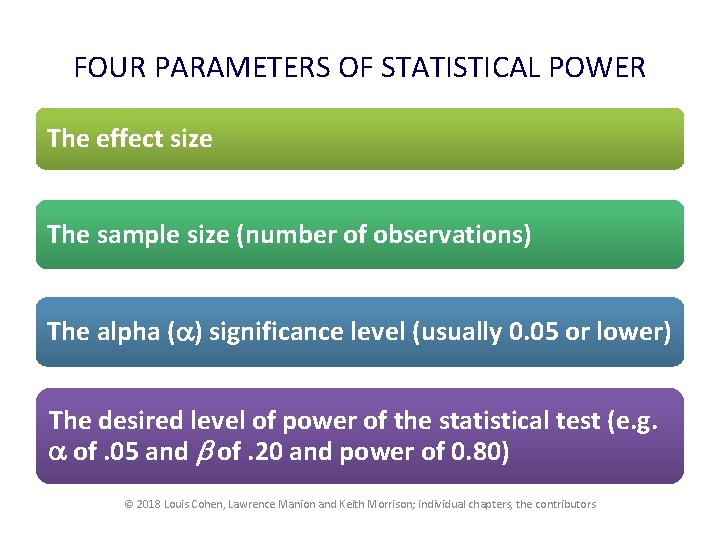
FOUR PARAMETERS OF STATISTICAL POWER The effect size The sample size (number of observations) The alpha ( ) significance level (usually 0. 05 or lower) The desired level of power of the statistical test (e. g. of. 05 and of. 20 and power of 0. 80) © 2018 Louis Cohen, Lawrence Manion and Keith Morrison; individual chapters, the contributors
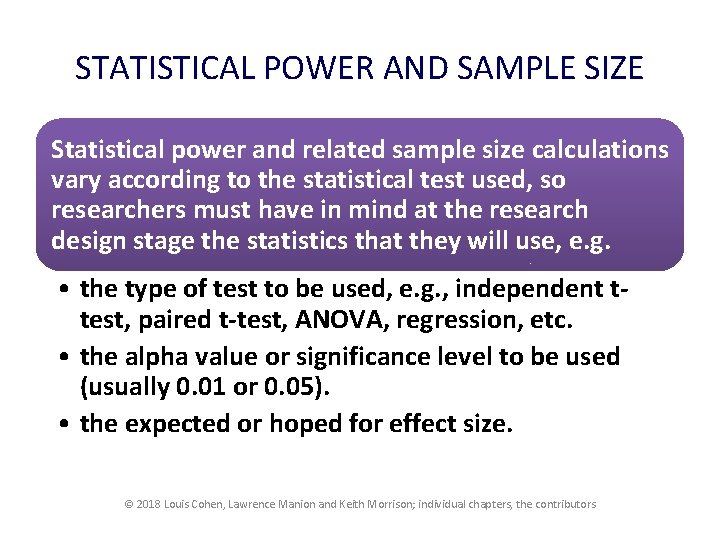
STATISTICAL POWER AND SAMPLE SIZE Statistical power and related sample size calculations vary according to the statistical test used, so researchers must have in mind at the research design stage the statistics that they will use, e. g. • the type of test to be used, e. g. , independent ttest, paired t-test, ANOVA, regression, etc. • the alpha value or significance level to be used (usually 0. 01 or 0. 05). • the expected or hoped for effect size. © 2018 Louis Cohen, Lawrence Manion and Keith Morrison; individual chapters, the contributors
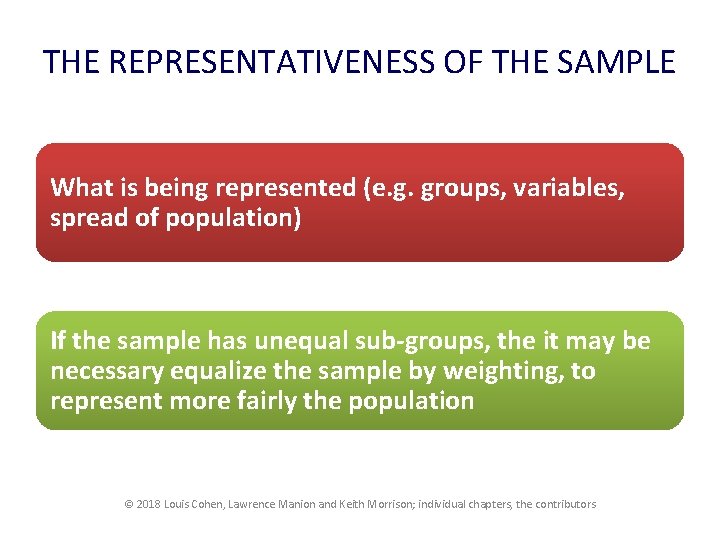
THE REPRESENTATIVENESS OF THE SAMPLE What is being represented (e. g. groups, variables, spread of population) If the sample has unequal sub-groups, the it may be necessary equalize the sample by weighting, to represent more fairly the population © 2018 Louis Cohen, Lawrence Manion and Keith Morrison; individual chapters, the contributors
ACCESS TO THE SAMPLE Is access to the sample permitted, practicable, realistic? Who will give/withhold/deny permission to access the sample? Who are the ‘gatekeepers’? © 2018 Louis Cohen, Lawrence Manion and Keith Morrison; individual chapters, the contributors
SAMPLING STRATEGIES Probability sample Non-probability sample © 2018 Louis Cohen, Lawrence Manion and Keith Morrison; individual chapters, the contributors
PROBABILITY SAMPLE Every member of the wider population has an equal chance to be included, choice is made on chance alone. The aim is for generalizability and wide representation. Less risk of bias in the sample. © 2018 Louis Cohen, Lawrence Manion and Keith Morrison; individual chapters, the contributors
RANDOM SAMPLE Drawing randomly from a list of the population (e. g. : names from a hat, using a matrix of random numbers). The probability of a member of the population being selected is unaffected by the selection of other members of the population, i. e. each selection is entirely independent of the next. © 2018 Louis Cohen, Lawrence Manion and Keith Morrison; individual chapters, the contributors
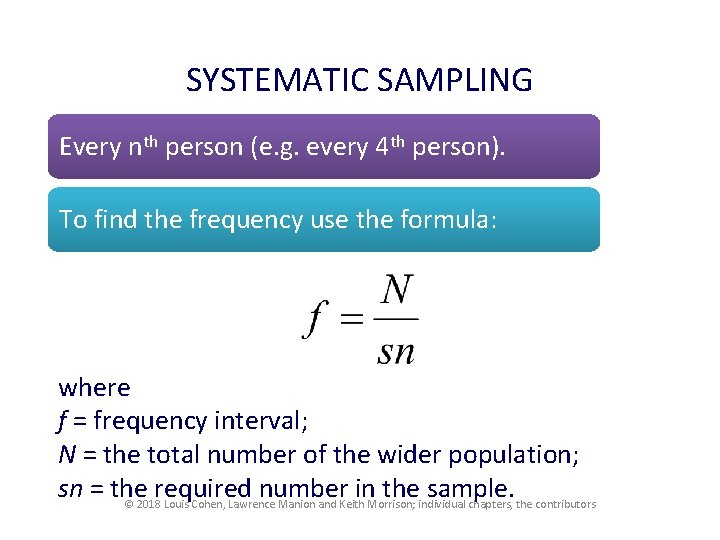
SYSTEMATIC SAMPLING Every nth person (e. g. every 4 th person). To find the frequency use the formula: where f = frequency interval; N = the total number of the wider population; sn = the required number in the sample. © 2018 Louis Cohen, Lawrence Manion and Keith Morrison; individual chapters, the contributors
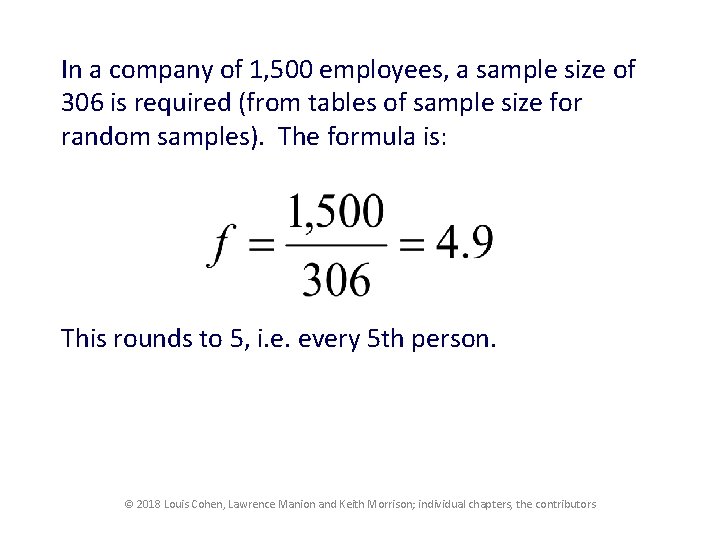
In a company of 1, 500 employees, a sample size of 306 is required (from tables of sample size for random samples). The formula is: This rounds to 5, i. e. every 5 th person. © 2018 Louis Cohen, Lawrence Manion and Keith Morrison; individual chapters, the contributors
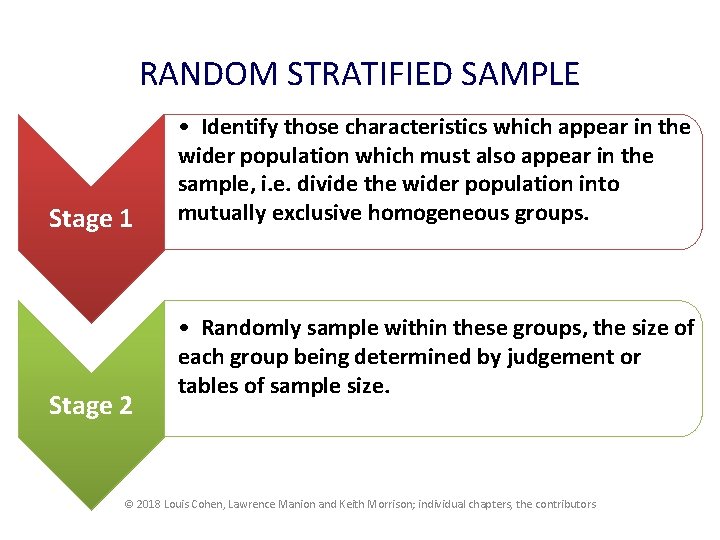
RANDOM STRATIFIED SAMPLE Stage 1 Stage 2 • Identify those characteristics which appear in the wider population which must also appear in the sample, i. e. divide the wider population into mutually exclusive homogeneous groups. • Randomly sample within these groups, the size of each group being determined by judgement or tables of sample size. © 2018 Louis Cohen, Lawrence Manion and Keith Morrison; individual chapters, the contributors
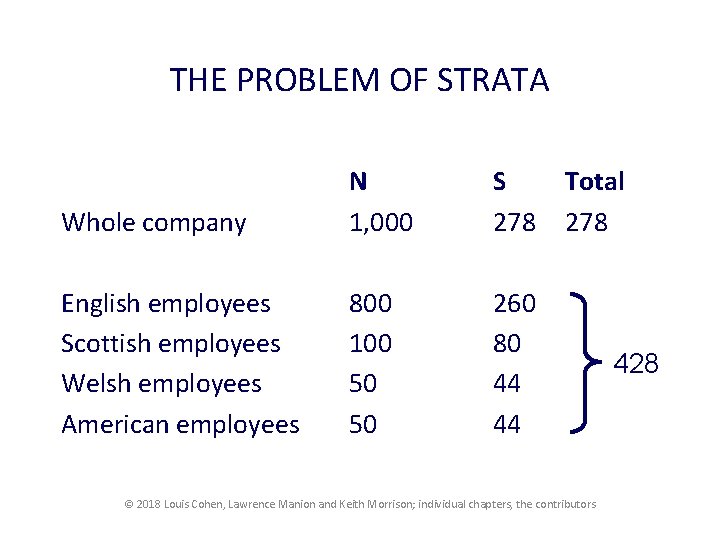
THE PROBLEM OF STRATA Whole company N 1, 000 S 278 English employees Scottish employees Welsh employees American employees 800 100 50 50 260 80 44 44 Total 278 © 2018 Louis Cohen, Lawrence Manion and Keith Morrison; individual chapters, the contributors 428
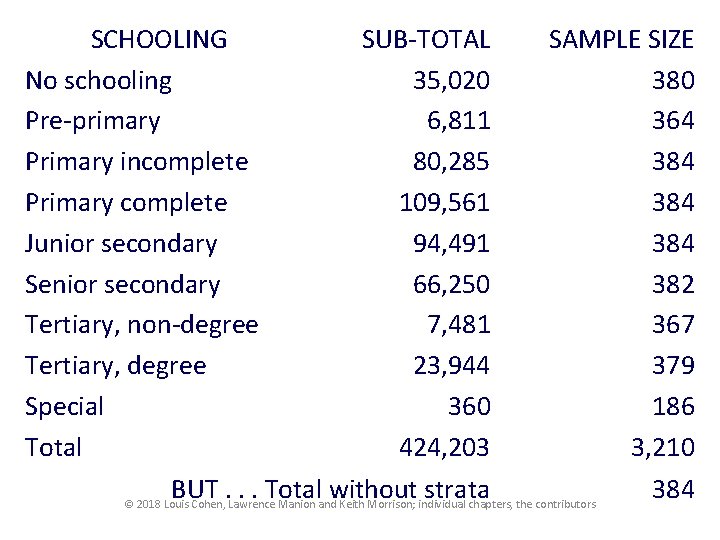
SCHOOLING SUB-TOTAL SAMPLE SIZE No schooling 35, 020 380 Pre-primary 6, 811 364 Primary incomplete 80, 285 384 Primary complete 109, 561 384 Junior secondary 94, 491 384 Senior secondary 66, 250 382 Tertiary, non-degree 7, 481 367 Tertiary, degree 23, 944 379 Special 360 186 Total 424, 203 3, 210 BUT. . . Total without strata 384 © 2018 Louis Cohen, Lawrence Manion and Keith Morrison; individual chapters, the contributors
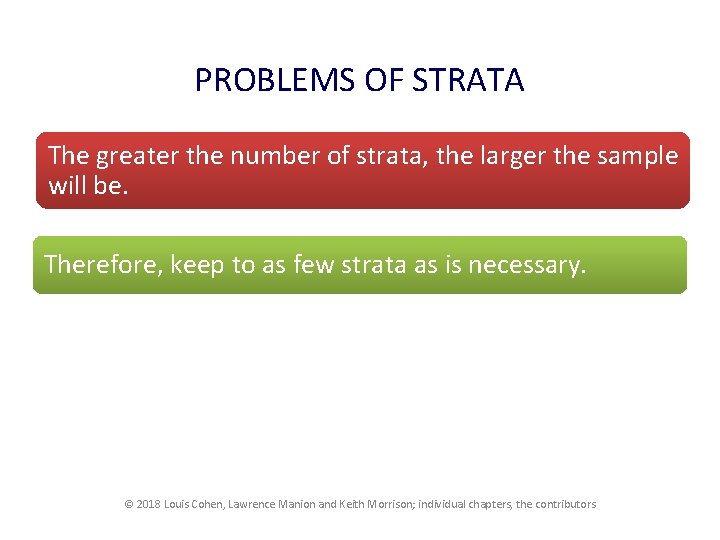
PROBLEMS OF STRATA The greater the number of strata, the larger the sample will be. Therefore, keep to as few strata as is necessary. © 2018 Louis Cohen, Lawrence Manion and Keith Morrison; individual chapters, the contributors
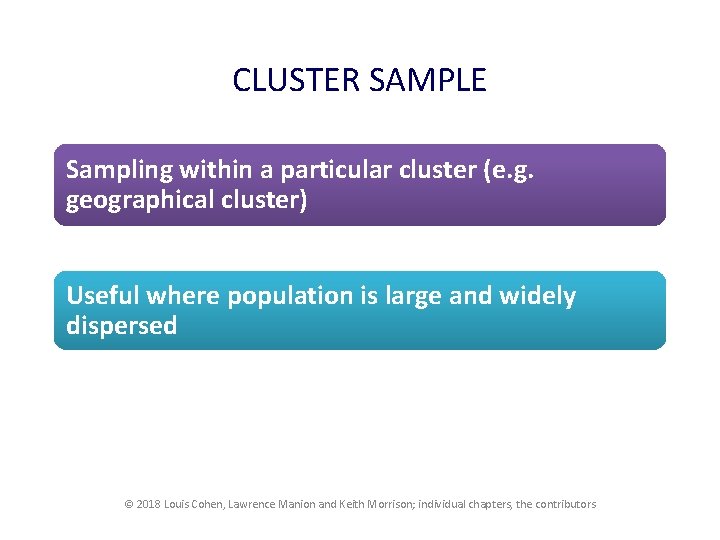
CLUSTER SAMPLE Sampling within a particular cluster (e. g. geographical cluster) Useful where population is large and widely dispersed © 2018 Louis Cohen, Lawrence Manion and Keith Morrison; individual chapters, the contributors
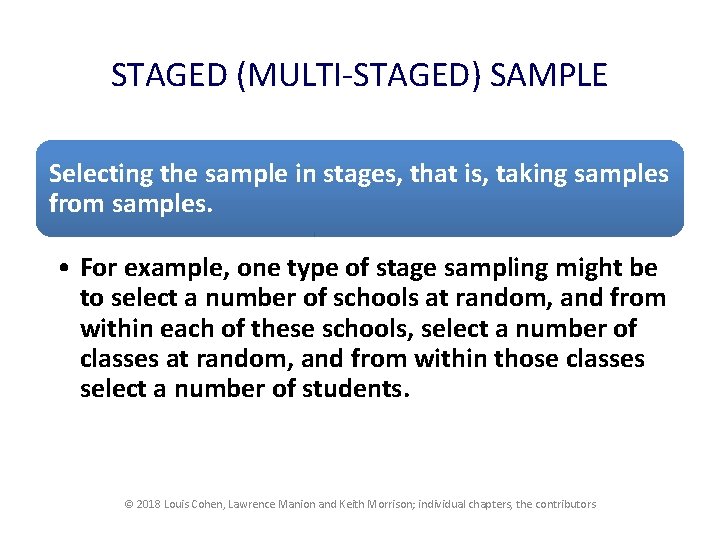
STAGED (MULTI-STAGED) SAMPLE Selecting the sample in stages, that is, taking samples from samples. • For example, one type of stage sampling might be to select a number of schools at random, and from within each of these schools, select a number of classes at random, and from within those classes select a number of students. © 2018 Louis Cohen, Lawrence Manion and Keith Morrison; individual chapters, the contributors
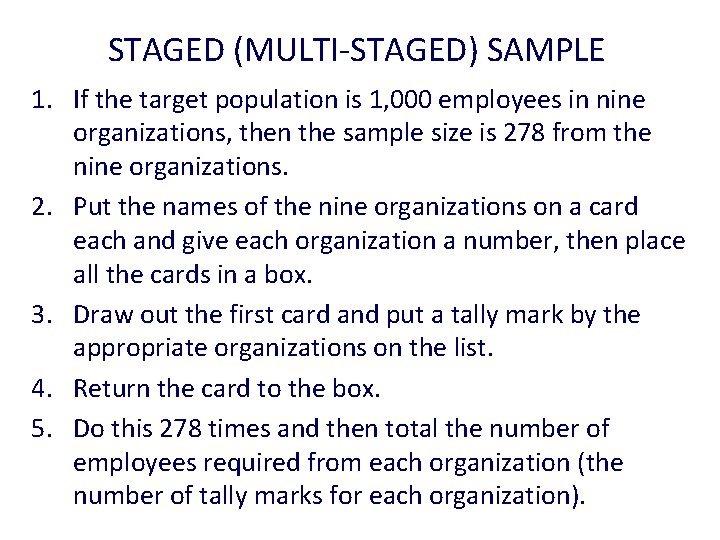
STAGED (MULTI-STAGED) SAMPLE 1. If the target population is 1, 000 employees in nine organizations, then the sample size is 278 from the nine organizations. 2. Put the names of the nine organizations on a card each and give each organization a number, then place all the cards in a box. 3. Draw out the first card and put a tally mark by the appropriate organizations on the list. 4. Return the card to the box. 5. Do this 278 times and then total the number of employees required from each organization (the number of tally marks for each organization).
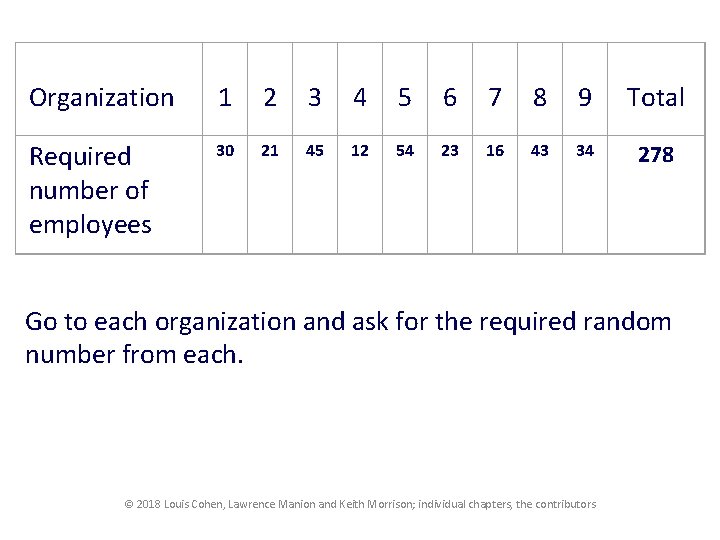
Organization 1 2 3 4 5 6 7 8 9 Total Required number of employees 30 21 45 12 54 23 16 43 34 278 Go to each organization and ask for the required random number from each. © 2018 Louis Cohen, Lawrence Manion and Keith Morrison; individual chapters, the contributors
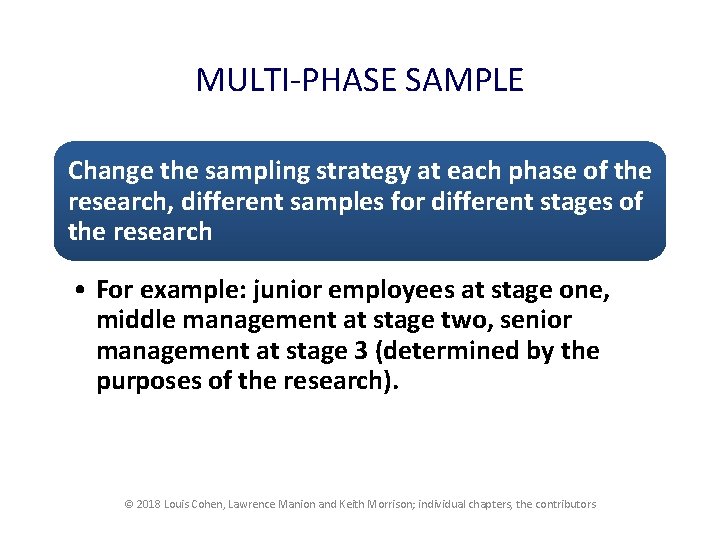
MULTI-PHASE SAMPLE Change the sampling strategy at each phase of the research, different samples for different stages of the research • For example: junior employees at stage one, middle management at stage two, senior management at stage 3 (determined by the purposes of the research). © 2018 Louis Cohen, Lawrence Manion and Keith Morrison; individual chapters, the contributors
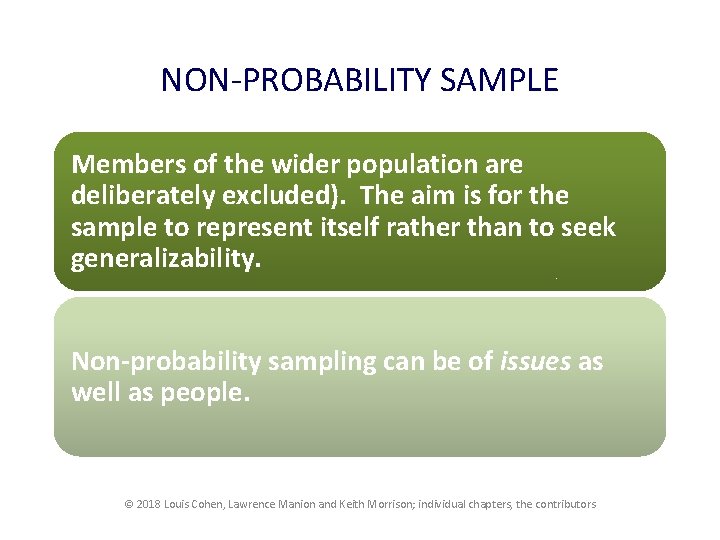
NON-PROBABILITY SAMPLE Members of the wider population are deliberately excluded). The aim is for the sample to represent itself rather than to seek generalizability. Non-probability sampling can be of issues as well as people. © 2018 Louis Cohen, Lawrence Manion and Keith Morrison; individual chapters, the contributors
CONVENIENCE SAMPLE Opportunity sample (often those to whom there is easy access). © 2018 Louis Cohen, Lawrence Manion and Keith Morrison; individual chapters, the contributors
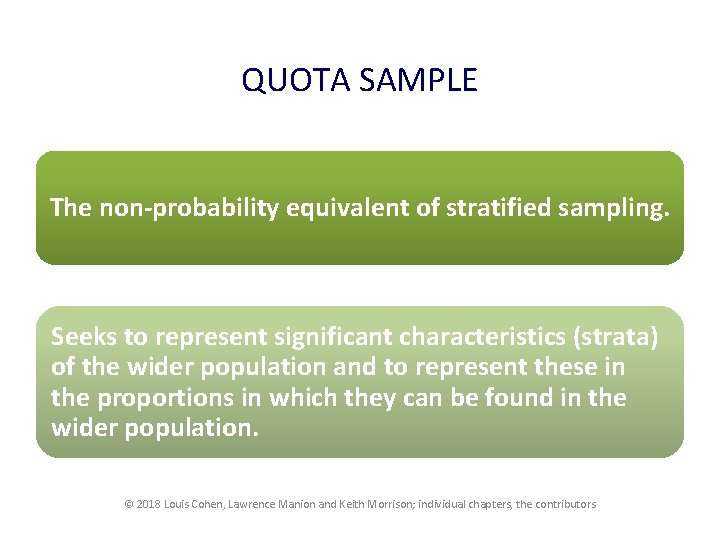
QUOTA SAMPLE The non-probability equivalent of stratified sampling. Seeks to represent significant characteristics (strata) of the wider population and to represent these in the proportions in which they can be found in the wider population. © 2018 Louis Cohen, Lawrence Manion and Keith Morrison; individual chapters, the contributors
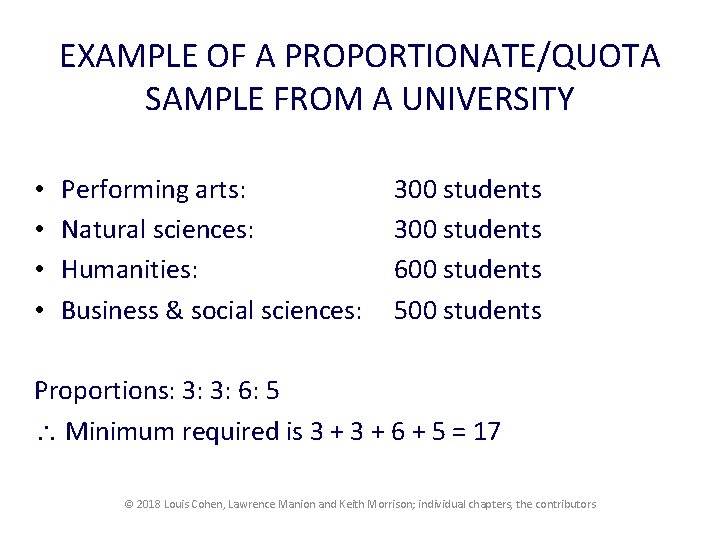
EXAMPLE OF A PROPORTIONATE/QUOTA SAMPLE FROM A UNIVERSITY • • Performing arts: Natural sciences: Humanities: Business & social sciences: 300 students 600 students 500 students Proportions: 3: 3: 6: 5 Minimum required is 3 + 6 + 5 = 17 © 2018 Louis Cohen, Lawrence Manion and Keith Morrison; individual chapters, the contributors
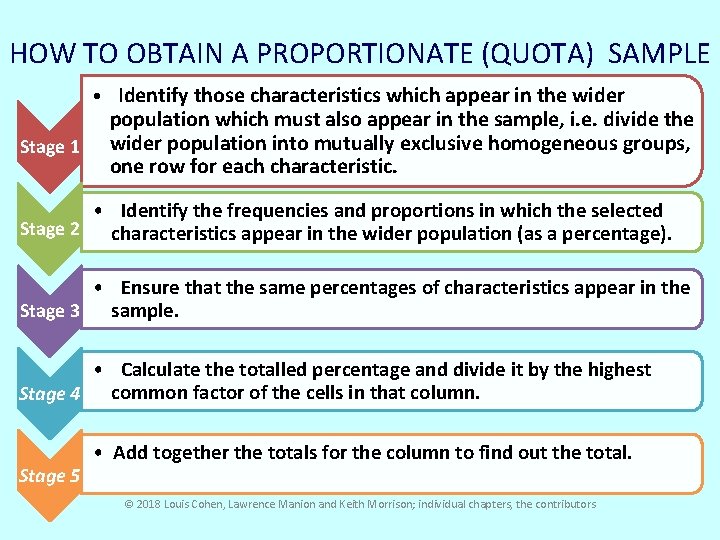
HOW TO OBTAIN A PROPORTIONATE (QUOTA) SAMPLE • Identify those characteristics which appear in the wider Stage 1 population which must also appear in the sample, i. e. divide the wider population into mutually exclusive homogeneous groups, one row for each characteristic. • Identify the frequencies and proportions in which the selected Stage 2 characteristics appear in the wider population (as a percentage). • Ensure that the same percentages of characteristics appear in the sample. Stage 3 • Calculate the totalled percentage and divide it by the highest common factor of the cells in that column. Stage 4 Stage 5 • Add together the totals for the column to find out the total. © 2018 Louis Cohen, Lawrence Manion and Keith Morrison; individual chapters, the contributors
PURPOSIVE SAMPLE Deliberately chosen for specific purposes. © 2018 Louis Cohen, Lawrence Manion and Keith Morrison; individual chapters, the contributors
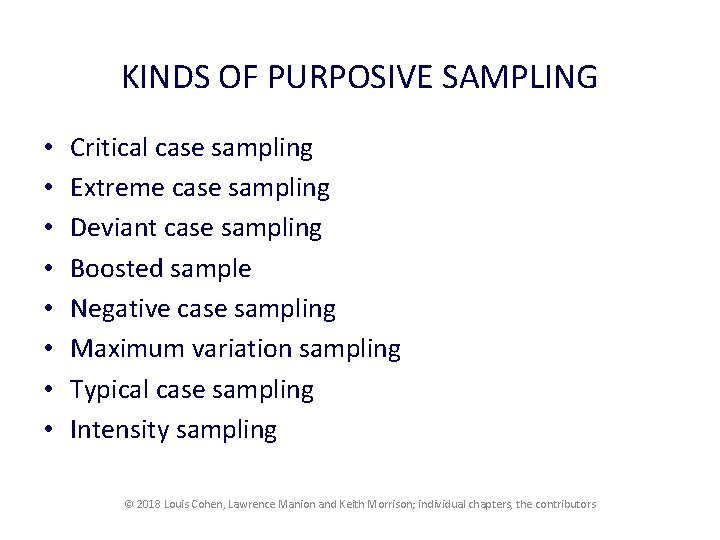
KINDS OF PURPOSIVE SAMPLING • • Critical case sampling Extreme case sampling Deviant case sampling Boosted sample Negative case sampling Maximum variation sampling Typical case sampling Intensity sampling © 2018 Louis Cohen, Lawrence Manion and Keith Morrison; individual chapters, the contributors
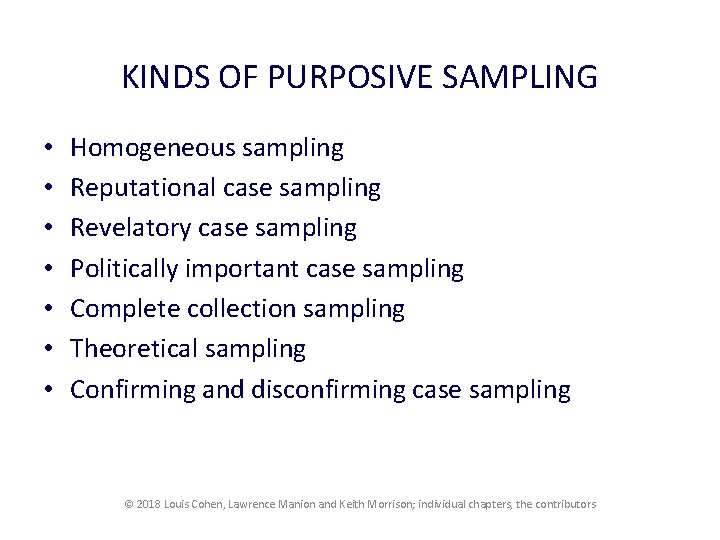
KINDS OF PURPOSIVE SAMPLING • • Homogeneous sampling Reputational case sampling Revelatory case sampling Politically important case sampling Complete collection sampling Theoretical sampling Confirming and disconfirming case sampling © 2018 Louis Cohen, Lawrence Manion and Keith Morrison; individual chapters, the contributors
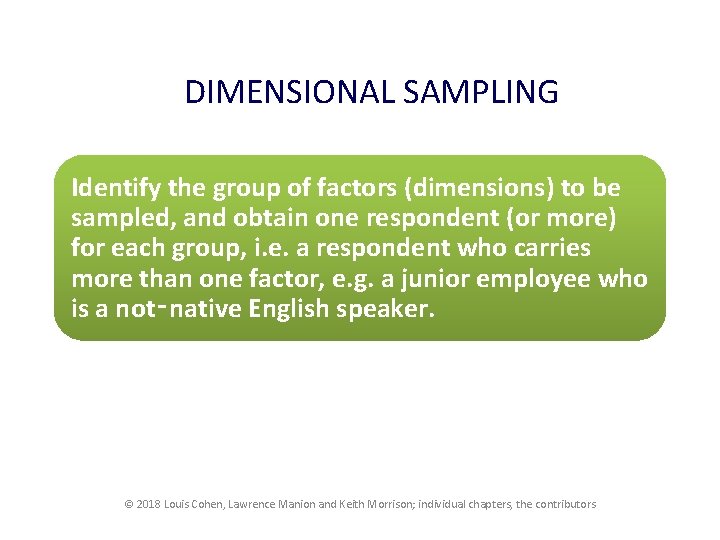
DIMENSIONAL SAMPLING Identify the group of factors (dimensions) to be sampled, and obtain one respondent (or more) for each group, i. e. a respondent who carries more than one factor, e. g. a junior employee who is a not‑native English speaker. © 2018 Louis Cohen, Lawrence Manion and Keith Morrison; individual chapters, the contributors
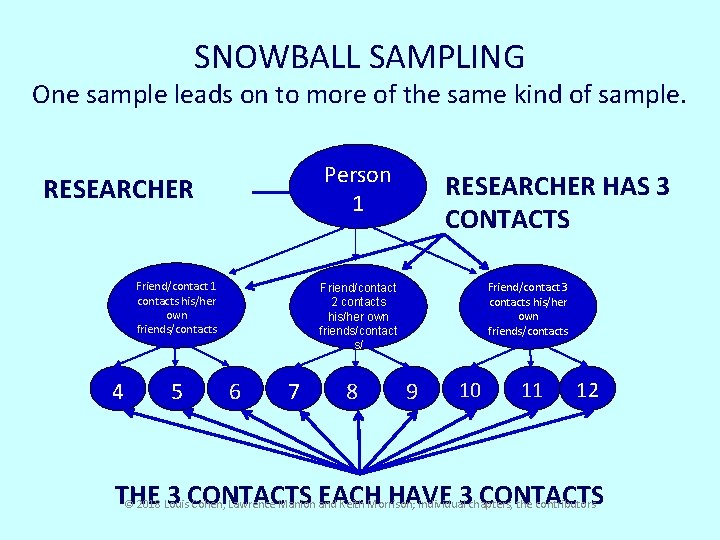
SNOWBALL SAMPLING One sample leads on to more of the same kind of sample. Person 1 RESEARCHER Friend/contact 1 contacts his/her own friends/contacts 4 5 RESEARCHER HAS 3 CONTACTS Friend/contact 3 contacts his/her own friends/contacts Friend/contact 2 contacts his/her own friends/contact s/ 6 7 8 9 10 11 12 THE 3 CONTACTS EACH HAVE 3 chapters, CONTACTS © 2018 Louis Cohen, Lawrence Manion and Keith Morrison; individual the contributors
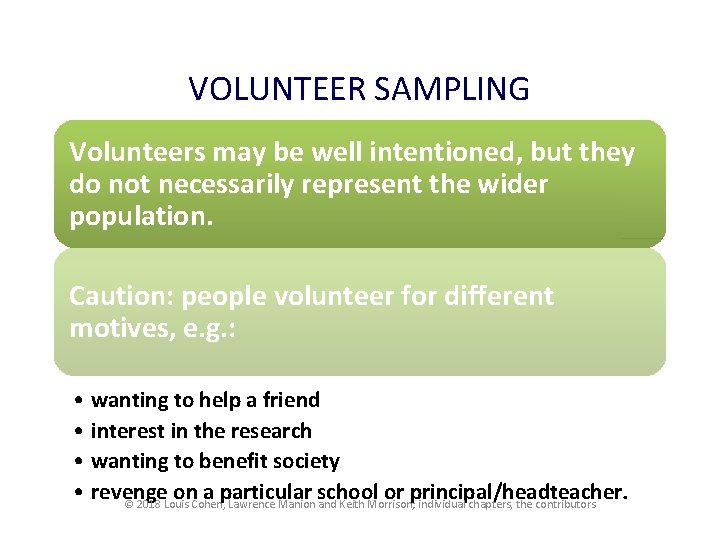
VOLUNTEER SAMPLING Volunteers may be well intentioned, but they do not necessarily represent the wider population. Caution: people volunteer for different motives, e. g. : • wanting to help a friend • interest in the research • wanting to benefit society • revenge on a particular school or principal/headteacher. © 2018 Louis Cohen, Lawrence Manion and Keith Morrison; individual chapters, the contributors
THEORETICAL SAMPLING • The researcher must have sufficient data to be able to generate and ‘ground’ theory in the research context, i. e. to create a theoretical explanation of what is happening in the situation, without having any data that do not fit theory. • The researcher proceeds in gathering more and more data until theory remains unchanged, until no modifications to the grounded theory are made in light of the constant comparison method. © 2018 Louis Cohen, Lawrence Manion and Keith Morrison; individual chapters, the contributors
MIXED METHOD SAMPLING DESIGNS • • • Parallel mixed methods sampling Sequential mixed methods sampling Multilevel mixed methods sampling Stratified purposive sampling Purposeful random sampling Nested sampling designs © 2018 Louis Cohen, Lawrence Manion and Keith Morrison; individual chapters, the contributors
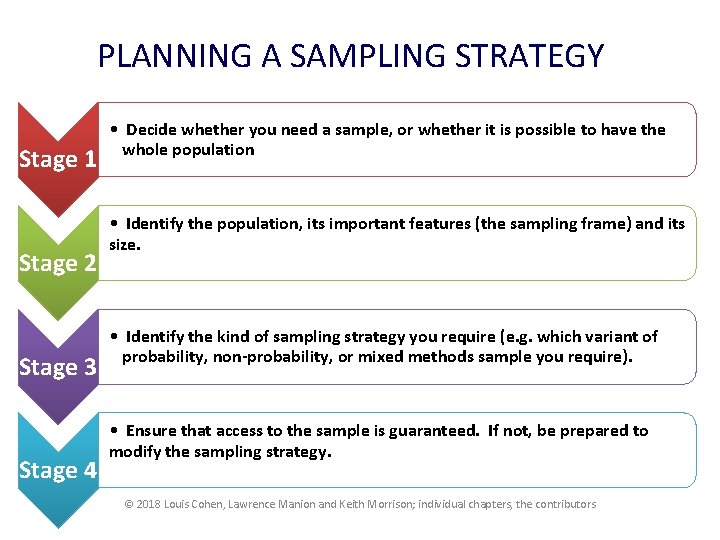
PLANNING A SAMPLING STRATEGY Stage 1 Stage 2 Stage 3 Stage 4 • Decide whether you need a sample, or whether it is possible to have the whole population • Identify the population, its important features (the sampling frame) and its size. • Identify the kind of sampling strategy you require (e. g. which variant of probability, non-probability, or mixed methods sample you require). • Ensure that access to the sample is guaranteed. If not, be prepared to modify the sampling strategy. © 2018 Louis Cohen, Lawrence Manion and Keith Morrison; individual chapters, the contributors
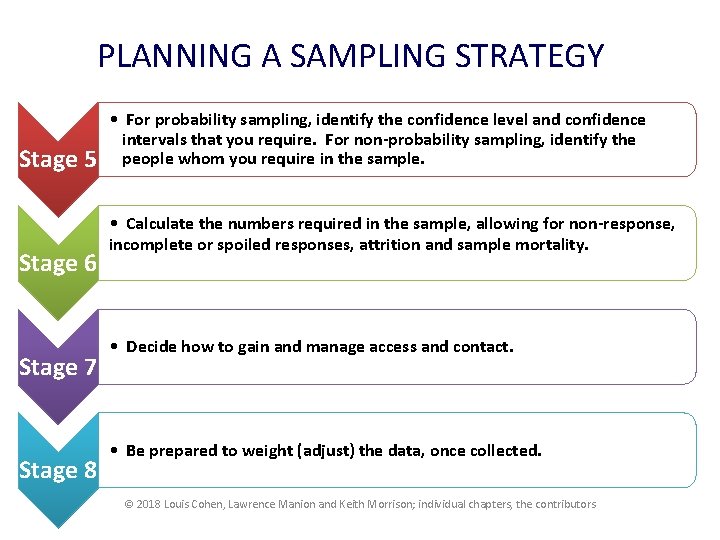
PLANNING A SAMPLING STRATEGY Stage 5 Stage 6 Stage 7 Stage 8 • For probability sampling, identify the confidence level and confidence intervals that you require. For non-probability sampling, identify the people whom you require in the sample. • Calculate the numbers required in the sample, allowing for non-response, incomplete or spoiled responses, attrition and sample mortality. • Decide how to gain and manage access and contact. • Be prepared to weight (adjust) the data, once collected. © 2018 Louis Cohen, Lawrence Manion and Keith Morrison; individual chapters, the contributors