GeoInformation Spatial Datatypes Babu Ram Dawadi Introduction we

Geo-Information & Spatial Datatypes Babu Ram Dawadi

Introduction we identified geographic phenomena as the study of objects or the field of GIS represents phenomena digitally in a computer (Spatial Data) We can also use the GIS to create visualizations from the computer representation, either on-screen, printed on paper, or otherwise

Objects of study in GIS Application Geographic Phenomena Computer Representation Visualizations Simulation World Real World Application Computing

Geographic Phenomena Any geographic phenomenon can be represented in various ways: the choice which representation is best depends upon mostly on two issues: What original, raw data ( from sensors or otherwise) is available, and What sort of data manipulation does the application want to perform?

Geographic Phenomena Geographic phenomenon is as something of interest that Can be named or described Can be geo-referenced, and Can be assigned a time (interval) at which it is/was present In water management, the objects of study can be river basins, agro-ecologic units, measurements of actual evapotranspiration, ground water levels, irrigation levels etc… observe that all of these can be named/described, geo- referenced and provided with a time interval at which each exists

Geo-phenomena We do not claim that all relevant phenomena come as triplets (description, georeferenced, time interval), though many do. If the georeference is missing, we seem to have something of interest that is not position in space. Types of Geo-Phenomena Geographic Fields Geographic Objects

Geo-Phenomena some phenomenon manifests themselves essentially every where in the study area, while others only occur in certain localities. A (Geographic) field is a geographic phenomenon for which, for every point in the study area, a value can be determined. Ex: temperature, barometric pressure and elevation Fields are continuous in nature Examples of discrete fields are land use and soil classification

Geo-phenomena. . Many other phenomena do not manifest themselves every where in the study area, but only in certain localities which are called geographic objects. (Geographic) Objects populate the study area, and are usually well distinguishable, discrete, bounded entities. The space between them is potentially empty. Ex: building, railroad, temple etc. . A general rule-of-thumb is that natural geographic phenomena are more often fields, and man-made phenomena are more often objects.

Geographic Fields A field is a geographic phenomenon that has a value everywhere in the study space If (x, y) is a position in the study area then f (x, y) stands for the values of the field f at locality (x, y). Fields can be discrete and continuous, and if they are continuous, they can be differentiable Discrete fields cutup the study space in mutually exclusive, bounded parts, with all locations in one part having the same field value.

Fields. . Continuous Field Discrete Field

Geographic Objects There position in space is determined by a combination of one or more of the following parameters. Location (where it is) Shape (what form it is) Size (how big it is) Orientation (in which direction it is facing)

Objects. . It is sometimes useful to view the geographic phenomena also at this aggregated level and look at characteristics like coverage, connectedness, capacity and so on. Typical questions are: Which part of the rail road network is within 5 KM of patrol station? (a coverage question) What is the shortest route between two cities via the road network? ( a connectedness question) How many cars can optimally travel from one city to another in an hour? ( a capacity question)

Boundries Where shape and or size of contiguous areas matter, the notion of boundary comes into play Location, shape and size are fully determined if we know area’s boundary Type Crisp boundary Fuzzy boundary

Boundries A crisp boundary is one that can be determined with almost arbitrary precision, dependent only upon the data acquisition technique applied Fuzzy boundaries contrast with crisp boundaries in that the boundary is not a precise line, but rather itself an area of transition Crisp boundaries are more common in man-made phenomena; where as fuzzy boundaries are more common with natural phenomena.

Computer Representation Various geographic phenomena have the characteristics of continuous functions over geometrically bounded, yet infinite domains of space When we want to represent such a phenomena faithfully in computer memory, we could either: try to store as many (location, elevation) pairs as possible, or try to find a symbolic representation of the elevation function, as a formula in x and y-like (3. 08 x 2 + 20. 8 x 7. 34 y) or so-which after evaluation will give us the elevation value at a given (x, y).

Computer Representation Both approaches have their drawbacks The first suffers from the fact that we will never be able to store all elevation values for all locations (infinite Locations) The second approach suffers from the fact that we have no clue what such a function should be, or how to derive it In GIS, typically a combination of both approaches is taken

Representation… the stored values are paired with an interpolation functions that allows inferring a reasonable elevation value for locations that are not stored. spatial autocorrelation Attribute values are related according to their spatial relationship, geographically, measurements that are closer together in space tend to be more similar than those farther apart

The Data Model Geographical variation in the real world is infinitely complex. Therefore, we require a set of rules (‘the data model’) to convert real geographical variation into discrete objects. ‘A set of guidelines for the representation of the logical organisation of the data in a database … (consisting) of named logical units of data and the relationships between them. ’ 18

Data Model In a data model, reality is simplified into just Three spatial entities, or elements, which can be used to represent the real world The Point The Line The Area/surfaces

Types of data model The Raster Model Equivalent of a continuous grid covering the surface, whereby each cell in the grid represents a square on the ground. The Vector Model Attempts to represent objects as exactly and precisely as possible by storing points, lines (arcs) and polygons (areas) in a continuous co-ordinate space 20

Vector and Raster Models in GIS Representation of Lines Raster Vector Courtesy of GIS LAB 21

Raster The Raster data model is the simpler of the two and is based on the division of reality into a regular grid of identically shaped cells Each cell is assigned a single value which represents the attribute for the area of that cell

Raster Data Structure …Raster data is ideally suited for GIS Modeling

Raster Data Structure

Raster Data Storage Format Single “flat” file or database table with each data “field” (column) stored as a separate map (implicit spatial topology)

GIS Database Organization

Tesselation In GIS, fields are usually implemented with a tessellation approach, and objects with a (topological) vector approach A Tessellation is a partition of space into mutually exclusive cells that together make up the complete study space.

Tessellation Types Regular Tessellation Irregular Tessellation Regular tessellation Uses only one type of regular polygon Rules: the tessellation must tile an infinite floor without gaps or overlapping the tiles must all be the same regular polygon each vertex must look the same

What polygons will form a regular tessellation? Triangles – Yes Squares – Yes Pentagons– No Hexagons– Yes Heptagon– No

Irregular Tessellation Regular tessellations provide simple structures with straightforward algorithms, which are, however, not adaptive to the phenomena they represent partitioned of space into mutually disjoint cells, but now the cells may vary in size and shape, allowing them to adapt to the spatial phenomena that they represent Irregular tessellations are more complex than the regular ones, but they are also more adaptive, which typically leads to a reduction in the amount of memory used to store the data.

Irregular Tessellation. . A well known data structure in this family-upon which many more variations have been based -is the region quad tree It is based on regular tessellations of square cells In main memory, the nodes of a quadtree (both circles and the squares) are represented as records B A C D

Region Quadtree

Vector Data Model An objects shape is represented by dots which are located where the shape of the object changes The GIS vector data model is slightly more complex as each vertex, arc, node and polygon is uniquely identified and the relationships between them are stored in the database

Vector Data Structure …Vector data is ideally suited for Computer Mapping and Spatial Database Management

Vector Data Structure

Vector Data Storage Format Series of linked files establishing explicit spatial topology (relationships among map features) #F 4
 and accurate area calculations Pleasing visuals due to")
VECTOR METHODS Advantages: Accurate graphics (positional) and accurate area calculations Pleasing visuals due to retention of detail Compact data structure => small storage requirements Disadvantages: Complex data structures Spatial analysis hard to perform, very complex or impossible Cannot handle remotely sensed data

RASTER METHODS Advantages: Easy to perform spatial analysis Simple data structures Can import, display and manipulate remotely sensed data Disadvantages: Inaccurate graphics and area calculations Blocky appearance with loss of detail as pixel size increases Large storage requirements
 The relationships between the elements of a vector data model, in")
Topology (Vector Data) The relationships between the elements of a vector data model, in terms of relative location and connections, are known as Topology The spatial relationships can be interpreted identification of connecting lines along a path definition of the areas enclosed within these lines identification of contiguous areas In digital maps, these relationships are depicted using ‘Topology’ Topology = A mathematical procedure for explicitly defining spatial relationship Topology is the description of how the spatial objects are related with spatial meaning

Topological data models Three types of topological concepts Arc, Node and polygon topologies Arcs have directions and left and right polygons (=contiguity) Nodes link arcs with start and end nodes (=connectivity) Polygon Arcs that connect to surround an area define a polygon (=area definition) 40

Terms and concepts Connectivity - from and to nodes Contiguity - Polygon Enclosure Adjacency - from Direction To Node Left Polygon Arc Right Polygon From Node 41

Topology…. 0 -simplex 1 -simplex 2 -simplex 3 -simplex Simplicial Complex

Trade-offs of topology Advantages Spatial data is stored more efficiently Analysis process faster and efficient for large data sets By topological relationships, we can perform spatial analysis functions, Modelling flow through the connection of lines in a network (i. e. buffering) Combining adjacent polygons with similar characteristics (i. e. spatial merge) Overlaying geographical features (i. e. spatial overlay) 43

Disadvantages Extra cost and time creating topological structure does impose a cost Topology should be always updated when a new map or existing map is updated Additional batch job working To avoid the extra efforts, GIS systems need to run a batch job (i. e. a process that can be run without user interactions); 70% of total GIS costs Autoexec. bat in DOS Macro languages such as AML (Arc/Info), Avenue (Arc. View), Map. Basic (Map. Info) and etc 44

Conclusions of topology When topology is created, we can identify Know its positions of spatial features Know what is around it Understand its geographical characteristics by virtue of recognising its surroundings Know how to get from A to B 45

Spatial Data Organization Two different object’s layers can be overlaid to look for spatial correlations

Digital Elevation Model Surface Representation of geography Digital Terrain Model: another term for the same Digital Elevation Model (DEM) is a digital cartographic/geographic dataset of elevations in xyz coordinates. The terrain elevations for ground positions are sampled at regularly spaced horizontal intervals. Derived from contour lines
 can")
DEM Terrain was/is traditionally represented by contours Terrain is continually varying Contours (isolines) can represent continuous variation Conceptually a contour is a closed nested polygon See More at: http: //ibis. geog. ubc. ca/courses/klink/gis. notes/ncgia/ u 38. html

Contour Maps

TIN: Triangular Irregular Network Triangular Irregulated Network. TIN data model is also a vector representation It is one of the standard implementation techniques for digital terrain models, but it can be used to represent any continuous field. irregularly spaced sample points can be adapted to the terrain, with more points in areas of rough terrain and fewer in smooth terrain an irregularly spaced sample is therefore more efficient at representing a surface

TIN… in a TIN model, the sample points are connected by lines to form triangles within each triangle the surface is usually represented by a plane by using triangles we ensure that each piece of the mosaic surface will fit with its neighboring pieces. each triangle's surface would be defined by the elevations of the three corner points it might make sense to use more complex polygons as mosaic tiles in some cases, but they can always be broken down into triangles

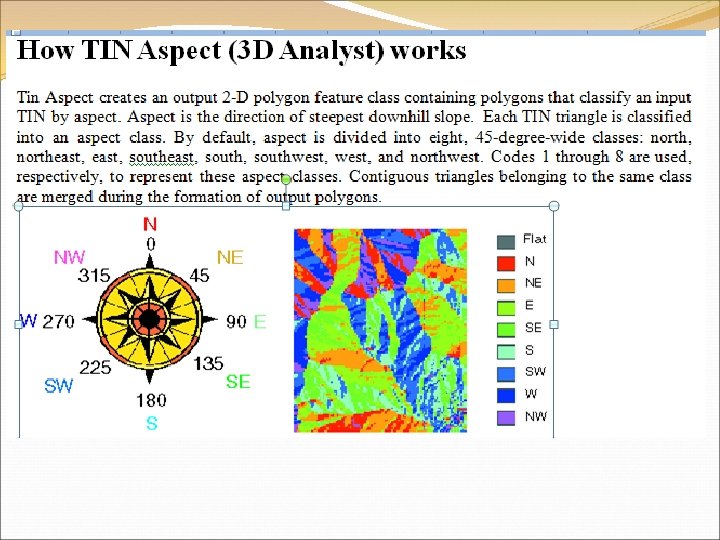
TIN… for vector GIS, TIN can be seen as polygons having attributes of slope, aspect (compass direction of slope) and area, with three vertices having elevation attributes and three edges with slope and direction attributes certain types of terrain are very effectively divided into triangles with plane facets triangles work best in areas with sharp breaks in slope, where TIN edges can be aligned with breaks, e. g. along ridges or channels

TIN… 990 P 1340

TIN… in three-dimensional space, three points uniquely determine a plane A plane fitted through these points has a fixed aspect (compass direction of slope) and gradient, and can be used to compute approximations for a single location

Spatio-Temporal Databases

Spatiotemporal data Besides having geometric, thematic and topological properties, geographic phenomena change over time temporal characteristics who the owners of the land parcel were in 1980 Change Detection Change detection addresses such questions as: Where and when did change take place? What kind of change occurred? With what speed did change occur? What else can be understood about the pattern of change?

Introduction Spatio-temporal Databases: manage spatial data whose geometry changes over time Geometry: position and/or extent Global change data: climate or land cover changes Transportation: cars, airplanes Animated movies/video DBs

ST DBs A Spatio Temporal Database All the features of temporal database Attributes can be spatial also Extension of Spatial Databases Objects change instead of being static At any timestamp it is a conventional Spatial Database

Spatio-temporal Objects

ST Queries Selection Queries: “find all objects contained in a given area Q at a given time t” Nearest Neighbor queries: “find which object became the closest to a given point s during time interval T, ” Aggregate queries: “find how many objects passed through area Q during time interval T, ” or, “find the fastest object that will pass through area Q in the next 5 minutes from now”

ST Queries join queries: “given two spatiotemporal relations R 1 and R 2, find pairs of objects whose extents intersected during the time interval T, ” or “find pairs of planes that will come closer than 1 mile in the next 5 minutes” similarity queries: “find objects that moved similarly to the movement of a given object o over an interval T”

SP Data Types Moving Points Extent does not matter Each object is modeled as a point (moving vehicles in a GIS based transportation system) Moving regions Extent matters! Each object is represented by an MBR(minimum bounding rectangle), the MBR can change as the object move (airplanes, storm, …)

SP Data Types Different Type of changes: Changes are applied discretely Urban planning: appearance or disappearance of buildings Changes are applied continuously Moving objects (eg. Vehicles)

Trajectories Moving objects create trajectories Usually we can sample the positions of the objects at periodic time intervals Dt Linear Interpolation: easy and usually accurate enough Trajectory: a sequence of 2 or 3 -dim locations

Spatio-temporal data and applications Examples: Continuously report the closest gas station on my way home? Remind me to buy drinks when I’m close to a supermarket Predict how many vehicles will be in the CBD in the next hour. In summary, queries involve spatial objects (e. g. , points, lines, polygons) and time
 Two types of")
Temporal Environment Transaction or Valid time: (usually we assume transaction time) Two types of environments: Predicting the future positions: Each object has a velocity vector. The DB can predict the location at any time t>tnow assuming linear movement. Queries refer to the future Storing the history. Queries refer to the past states of the spatial database

The Historical Environment Spatio-temporal Evolution
- Slides: 68