Fall 2010 Community Health Lillian Wald 1912 Epidemiology


* o o o o o Heart")


 Southern Nevada Health District (2009). Statistics, surveillance,")


 o The Office")


 o Epi. Info http: //www. cdc. gov/epiinfo/ o Studying Populations o http:")


- Slides: 67
Fall, 2010 Community Health Lillian Wald 1912 Epidemiology The Broad Street Pump Reference: Nies, M. & Mc. Ewen, M. (2007). Community / public health nursing: Promoting the health of populations, 4 th Ed. Saunders-Elsevier: St. Louis, MO J. Carley MSN, MA, CNE Fall, 2010
Communicable Disease
John Snow Pub Broad Street, London
An Outline of Sorts……. o o o Introduction to Epidemiology Historical Perspective of Nursing Epidemiology Worldwide Implications Local Implications Group 2 -hour Mini-Project: o Each group research & prepare 10 -15 minute presentation related to epidemiology (broad subject!) See Next Slide o Each group prepare two test (assessment questions related to epidemiology) Evaluations required o
About “Statistics…. ”& Health, Politics o o “Demagogue” / “Demagoguery” a leader who makes use of popular prejudices and false claims and promises in order to gain power Keep in mind when this is being done, and how so… o o “Infant Mortality Rate” “Women are under represented in medical studies” Tendency to accept or reject …. depending upon your political point of view…Used to sway the “undecided. ” Satel, Sally (2000) Politically correct, M. D. : How political correctness is corrupting medicine. Basic Books: New York
o From wiki—ways to demigog…
Terminology: o o o o o Epidemiology Levels of Prevention Primary Prevention Secondary Prevention Tertiary Prevention Epidemic Endemic Pandemic Distribution Determinants Incidence rate Risk Prevalence proportion Attack rate Case Fatality Rate Mortality rate Morbidity o o o Attributable Risk Proportionate Mortality Rate Adjusted mortality & morbidity rates Yield Attack Rate Case-Specific Mortality Rate
1918 World War I is rapidly drawing to its bloody conclusion. Millions have died in the carnage, including an entire generation of French, English, and Germans. Peace is at hand, the guns have been silenced, yet many more will die. Many more will die. 1918
Song sung by children in U. S. , 1918 I had a little bird, Its name was Enza. I opened the window, And in-flu-enza.
ENDEMIC………………………. ……. EPIDEMIC PANDEMIC Russell, Kansas Fall, 1917 WWI Combat Deaths Asia Summer 1918 Trenton, N. J. June, 1917 Fall, 1917 Trenton, N. J. France Fall, 1917 Nationwide, Spring 1918 Europe, 1918 Africa, 1918 ***Number of Mortalities to date attributed to Influenza Outbreak: (Each Figure equals one million deaths)
“Phase Shift” ? Mortalities 20 18 16 14 12 10 8 6 4 2 “Spanish Flu” Deaths World Wide = 20, 000 – 40, 000 WHO DIES FROM INFLUENZA ? Typically, The very young and the very old. Spanish flu mortalities selected out the healthiest portion of the population, Those between 20 & 40 years old. Additionally, as with most infectious Disease Outbreaks: HEALTH CARE WORKERS, CONTEXT: i. e. , NURSES, DIED @ AIDS Deaths DISPROPORTIONATE RATES. World Wide = ~19, 000 Millions Year 1 2 3 4 5 6 7 8 9 10 11 12 14 15 16 17 18 19 20
http: //www. pandemicflu. gov/storybook/
Pandemic Influenza: The Phie Family All eight family members were admitted to the emergency hospital in Loveland Colorado, and between October 30 and November 9, 1918: Jessie, age 40 (died Oct. 30); Florence, age 19 (died Nov. 1); Charlie, age 45 (died Nov. 2); Bobbie, age 8 (died Nov. 4); Harry, age 10 (died Nov. 5); Willie, age 4 (died Nov. 5). Tommy, age 16 (died Nov. 7); Davie, age 6 (died Nov. 9). All eight died from the flu. They were all buried in Eaton, Colorado where they had lived previously. The Phie Family
http: //www. fluwikie. com/index. php ? n=Main. Multimedia
http: //www. cdc. gov/nchs/fastats/lcod. htm
10 Leading Causes of Death, U. S. (2004)* o o o o o Heart disease (654, 092) Cancer (550, 270) Stroke (150, 147) Chronic lower respiratory diseases (123, 884) Accidents (108, 694) Diabetes (72, 815) Alzheimer's disease ( 65, 829) Influenza/Pneumonia (61, 472) Nephritis, nephrotic syndrome, and nephrosis (42, 762) Septicemia (33, 464) *Retrieved from: Center for Disease Control & Prevention’s National Center for Health Statistics Fast. Stats at: http: //www. cdc. gov/nchs/fastats/lcod. htm
http: //www. cdc. gov/mmwr/PDF/wk/mm 5553. pdf
o Collaborative Learning / Research in Epidemiology & Communicable Disease o For the assigned ‘reportable’ communicable disease describe the disease, e. g. , pathophysiology. Describe and ‘plug-in’ the components of the disease as related to the epidemiological triangle (agent, host, environment, vector). Is the disease vaccine preventable? Using MMWR provided, discuss the total monthly and yearly total reported cases for 2006. Discuss how the disease is diagnosed. Discuss treatment for the disease. Discuss morbidity & mortality for disease for year 2006. Discuss incidence of the disease by: Geographical region Age group Sex / gender Race Discuss reported cases of the assigned disease process for Clark County, NV this year (to date). Discuss primary, secondary, and tertiary prevention as it relates to assigned disease process. 5 Minute report by each group starting with group 11— 10— 9— 8— 7— 6— 5— 4— 3— 2 --1 o o o o
Epidemiology o o o Introduction Definitions Epidemiology – “The study of the distribution and determinants of health-related states or events in specific populations, and the application of this study to control of health problems”. (Last, 2001, pp. 62) http: //www. waldenu. edu/c/Schools_6955. htm
Epidemiology o o Introduction Definitions Distributions – the patterns of health events in specific populations http: //www. cdc. gov/mmwr/ Determinants – factors or variables that affect patterns and health events Example: analysis of how and why a population has different health trends, financial factors, diet, sanitation, recent catastrophes, etc….
Epidemiology o o Introduction Definitions Incidence rate – the rate of health problems that are developing in new cases Risk – the probability that the health event will occur within a specific time, i. e. the risk of breast cancer over a lifetime in the United States
Epidemiology o o Introduction Definitions Prevalence – the actual measurement of existing disease at a particular time in a specific group Prevalence Proportion – the proportion of the group which has the existing disease at a particular time
Epidemiology o o Introduction Definitions Attack rate – The proportion of people who are exposed to the disease and get the illness. Mortality Rate – a rate that indicates the proportion of a population who has died from any cause in a certain period of time, i. e. one year.
Epidemiology o o o Introduction Definitions Morbidity = RATE of which an illness or health event occurs in a specific population, usually expressed as a proportion; determined by dividing the affected population by the total number of population in that group.
Epidemiology o o o Introduction Definitions Epidemic – an incidence of disease that is more than usual in a specific population – see example of West Nile Virus on CDC site
Epidemiology Introduction o Definitions Pandemic – a worldwide incidence of disease that is more than usual in world populations o
Epidemiology o o § § § Introduction Definitions Pandemic – WHO Organization has six stages of alert for pandemics and a global preparedness plan. The stages range from Level I, which is the lowest risk of human cases to Level VI – Efficient and sustained “human – to – human transmission.
Epidemiology History of Epidemiology o Moses – wrote the laws for Exodus o 4 th Century B. C. E. = Hippocrates, defined symptoms of disease, prevalence, and cure rates ( descriptive epidemiology – the who, where, and when) o 1400’s – Turkish women inoculated children with a needle and pieces of dried smallpox scabs to vaccinate them against future plagues. o
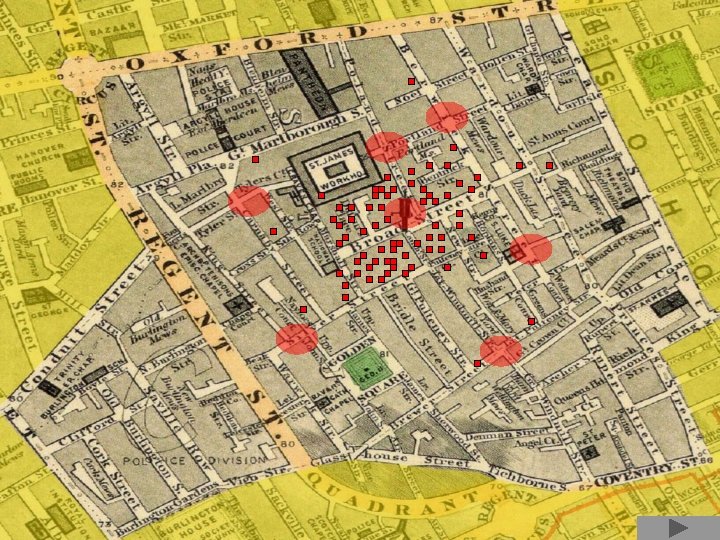
Epidemiology o o History of Epidemiology 1853 -William Snow – the father of Epidemiology, mapped the incidence and locality of cholera in relationship to the location of the water source, first use of a comparison group, above the city, or downstream from the city. 1870’s – Robert Koch – discovered the causative bacteria anthrax, T. B. , and cholera 1952 s -– Dr. Jonas Salk’s Production of Polio Vaccine Salk Snow Pasteur Koch
The Broad Street Pump
Miasma Theory
Intervention Which Stopped the Cholera Outbreak:
Epidemiology o o o History of Epidemiology World War I – the Public Health Nurse Corp was formed by the Red Cross in answer to the 1919 worldwide influenza pandemic. World War II – as nurses were called overseas in the Navy and Army Nurse Corps, Public Health nursing became the back up for the rural Americans with a local public health department for any population >50, 000.
Epidemiology o o o History of Epidemiology 1960’ CDC was formed as a government institution separately from the military biological warfare labs. 1983 – cause of AID’s was discovered
Epidemiology Epidemiological Concepts in Nursing o Epidemiologic Triangle Changes in any one triangle component will either increase or decrease your risk of disease o
Epidemiology o Epidemiological Concepts in Nursing Agents – infectious diseases; bacterium, fungi, viruses or parasites. May also be toxic chemicals or physical agents which create illness or injury. o Host –a host is the person or subject that is susceptible to an agent o Vector – a carrier or source that transmits the agent to or from the host. Example: the vector for the West Nile virus is the mosquito, the agent is the virus, and the host can be human, horse, or bird. The environment requires standing water o
The New Mothers Project Epidemiology o o o Epidemiology Levels of Prevention Think outside of the Box – International! Example: AID’s in Africa: Primary Prevention: counseling young females and school children on STD prevention and use of condoms. Secondary Prevention: Screening pregnant females for HIV. Tertiary Prevention – Providing AZT and instructions to pregnant mothers with HIV so that they do not transmit the disease
Prevalence: Levels of Prevention o o othe actual measurement of existing disease at a oparticular time in a specific group Incidence: the rate of health problems that are developing in new cases Primary Prevention We use primary prevention methods before the person gets the disease. Primary prevention aims to prevent the disease from occurring. So primary prevention reduces both the incidence and prevalence of a disease. Encouraging people to protect themselves from the sun's ultraviolet rays is an example of primary prevention of skin cancer.
Epidemiology o o Primary, Secondary, Tertiary Epidemiology Levels of Prevention Give an example of Primary Prevention for this Influenza? Give an example of Secondary Prevention for this Influenza? What are some of the Tertiary Prevention interventions that could be used to prevent influenza?
PEWSS (Pediatric Early Warning Sentinel Surveillance ) Southern Nevada Health District (2009). Statistics, surveillance, and reports: PEWSS Reports. Retrieved from http: //www. southernnevadahealthdistrict. org/stats-reports/influenza. php o o The Pediatric Early Warning Sentinel Surveillance (PEWSS) program was initiated in June 2010. This innovative respiratory surveillance program monitors the level of respiratory virus activity within the community year round. The PEWSS program provides laboratory surveillance data of four influenza viruses (Influenza AH 1, Influenza 2009 A (H 1 N 1), Influenza AH 3, and Influenza B), and six noninfluenza viruses (Adenovirus, Human metapneumovirus, Human parainfluenza virus 1, Human parainfluenza 2, Human parainfluenza virus 3, and Respiratory Syncytial Virus).
Epidemiology Current Epidemics in the United States o HIV o STD’s / STI’s o Smoking o Heart Disease o Hepatitis B & C o Lyme’s Disease o West Nile Virus o Obesity
Epidemiology Current Epidemics of the World: o AIDS – number one – 38, 000 people were infected as of 2005 o Avian Flu o West Nile virus o Tobacco use o SARS o Starvation o TB
Epidemiology o o o o Current Epidemics in Clark County – from the CCHD http: //www. southernnevadahealthdistrict. org/epidemiology/disease_statistics. htm Chlamydia/Gonorrhea HIV/AID’s Syphilis Smoking & Lung Disease West Nile Encephalitis Rotavirus
Epidemiology Environmental Health from Healthy People 2010 Clark County Priorities q Cultural programs q Access to health care q Bioterrorism response improvement q Reduce second hand smoke exposure q Increase food safety education q Drowning in toddlers q Reduce Suicide rate q Decrease in low birth weight rate q Use of seatbelts and child car restraints
Challenges for Public Health Nursing: o o o Promote the health of communities Need for a bimodal focus on prevention, health promotion, and home care Education to meet the needs of the aggregate Concern for cost-benefit ratios Population approach for nursing care
Disease Detective http: //library. thinkquest. org/06 aug/01865/index. html
Outbreak at Water’s Edge o http: //www. mclph. umn. edu/watersedge/play. html
Some Good Sites……………. o WHOSIS (World Health Organization Statistical Information System) o The Office of Minority Health Brazos-Nurse. Org Community Health Page The Public Health Nursing Pages o o
Research Topic ------ Cite Sources o o o Gp 1: Legionella Gp 2: Botulism (food borne & infant) Gp 3: Coccidiomycosis Gp 4: Gonorrhea Gp 5: Syphilis Gp 6: Chlamydia Gp 7: Typhus Gp 8: Shigellosis Gp 9: Tuberculosis Gp 10: Pertusis Gp 11: Psittacosis
“Cold Cases: Itinerant Nursing in South West Alaska” http: //www. medscape. com/viewarticle/488041
American Anthrax Outbreak of 2001 Medical Mystery o American Anthrax Outbreak of 2001 http: //www. ph. ucla. edu/epi/bioter/detect/antdetect_intro. html o SUPERCOURSE: Anthrax o http: //www. pitt. edu/~super 1/lecture/lec 1221/index. htm
Cool Sites: o http: //wonder. cdc. gov/Welcome. T. html http: //www. cdc. gov/nchs/fastats/default. htm http: //www. cdc. gov/epiinfo/ o http: //www. southernnevadahealthdistrict. org/epidemiology. htm o o http: //www. bt. cdc. gov/surveillance/syndromedef/index. asp
DOWNLOADS (Free) o Epi. Info http: //www. cdc. gov/epiinfo/ o Studying Populations o http: //www. dundee. ac. uk/~cdvflore/SPUpdates. htm o
APPENDIX 121 Cities Mortality Reporting System o o o In the late 1800's and early 1900's pneumonia and influenza deaths were reported to state and federal health officials only in times of an epidemic. Health officials would then conduct personal interviews to collect information about the age, sex, severity of illness, and other demographic information regarding cases in the household. The results of these interviews were the only source of mortality information available to researchers for measurement of the impact of an epidemic or prediction of future trends (Collins, et al. 1951).
o o In response to the influenza pandemic of 1918 -1919, the U. S. Bureau of the Census reported one of the first quantitative measurements of the epidemic impact on mortality. In the March 4, 1919, issue of the "Weekly Health Index, " the death rates for 31 large cities for the period of September 18, 1918 -March 1, 1919 were compared to the death rates for the same period in 1917 -1918, and the difference between them was calculated as the "excess mortality" during the epidemic.
o o Selwyn Collins further refined this concept of a quantitative measure or index of the impact of influenza epidemics in the 1930's. He used his refined method to characterize influenza epidemics for data collected monthly from 35 cities (1910 -1919) and weekly from 90 cities (1920 -1942), 56 cities (1943 -1950), and 62 cities (1951 -1956).
o In 1957, fear of the Asian flu prompted the CDC (formerly Communicable Disease Center) to develop a method of early detection of an epidemic using a modification of Collins' procedures. At this time, the system consisted of 108 cities from which Collins had previously been collecting weekly (unpublished) data (Serfling, et al. 1962).
o In 1962, after responsibility for publication of the Morbidity and Mortality Weekly Report (MMWR) was transferred to CDC from the National Office of Vital Statistics, CDC continued to collect weekly mortality data reported voluntarily by a number of selected cities in the United States.
o o o Today, the 121 Cities Mortality Reporting System continues to serve as the most timely source of mortality data in the United States. Despite changes in the methods for reporting and the cities participating, the system has consistently captured one-third of the nation's deaths. Furthermore, evaluations have shown that the 121 Cities Mortality Reporting System detects trends and patterns in pneumonia and influenza deaths similar to those shown by mortality statistics for the entire nation (Baron, et al. 1988). An updated evaluation of the representativeness of the 121 cities and the mortality patterns observed is currently underway. The Influenza Branch, National Center for Infectious Diseases, also relies on this system for timely estimates of the impact of epidemic influenza on mortality each influenza season.
“ 121 cities” surveillance system E. N. CENTRAL EASTERN o Boston, MA Bridgeport, CT Cambridge, MA Fall River, MA Hartford, CT Lowell, MA Lynn, MA New Bedford, MA New Haven, CT Providence, RI Somerville, MA Springfield, MA Waterbury, CT Worcester, MA MID ATLANTIC Albany, NY Allentown, PA Buffalo, NY Camden, NJ Elizabeth, NJ Erie, PA Jersey City, NJ New York City, NY Newark, NJ Paterson, NJ Philadelphia, PA Pittsburgh, PA Reading, PA Rochester, NY Schenectady, NY Scranton, PA Syracuse, NY Trenton, NJ Utica, NY Yonkers, NY Akron, OH Canton, OH Chicago, IL Cincinnati, OH Cleveland, OH Columbus, OH Dayton, OH Detroit, MI Evansville, IN Fort Wayne, IN Gary, IN Grand Rapids, MI Indianapolis, IN Lansing, MI Milwaukee, WI Peoria, IL Rockford, IL South Bend, IN Toledo, OH Youngstown, OH W. N. CENTRAL Des Moines, IA Duluth, MN Kansas City, KS Kansas City, MO Lincoln, NE Minneapolis, MN Omaha, NE St. Louis, MO St. Paul, MN Wichita, KS S. ATLANTIC Atlanta, GA Baltimore, MD Charlotte, NC Jacksonville, FL Miami, FL Norfolk, VA Richmond, VA Savannah, GA St. Petersburg, FL Tampa, FL Washington, DC Wilmington, DE o PACIFIC o Berkeley, CA Fresno, CA Glendale, CA Honolulu, HI Long Beach, CA Los Angeles, CA Pasadena, CA Portland, OR Sacramento, CA San Diego, CA San Francisco, CA San Jose, CA Santa Cruz, CA Seattle, WA Spokane, WA Tacoma, WA o MOUNTAIN o Albuquerque, NM Boise, ID Colorado Springs, CO Denver, CO Las Vegas, NV Ogden, UT Phoenix, AZ Pueblo, CO Salt Lake City, UT Tucson, AZ E. S. CENTRAL Birmingham, AL Chattanooga, TN Knoxville, TN Lexington, KY Memphis, TN Mobile, AL Montgomery, AL Nashville, TN W. S. CENTRAL Austin, TX Baton Rouge, LA Corpus Christi, TX Dallas, TX El Paso, TX Ft. Worth, TX Houston, TX Little Rock, AR New Orleans, LA San Antonio, TX Shreveport, LA Tulsa, OK
Evidence-Based Public Health http: //phpartners. org/tutorial/04 -ebph/index. html
finis