Diverse clinical issues in Epidemiological Studies of the


 PWV = D ÷ DT m/sec D A B is")


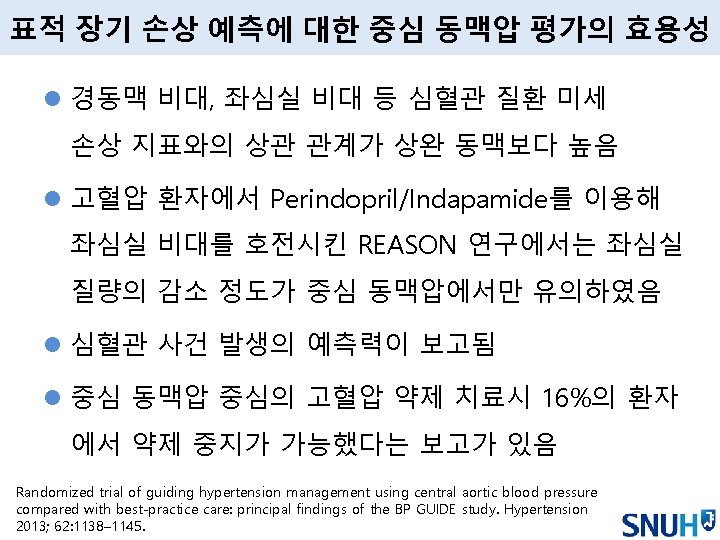

 180 * mean±SD *:p< 0.")
 180 mean±SD *:p< 0. 001")
@75 ※The augmentation Index adjusted as the heart beat")
 13 * mean±SD *:p< 0.")


")


")
")
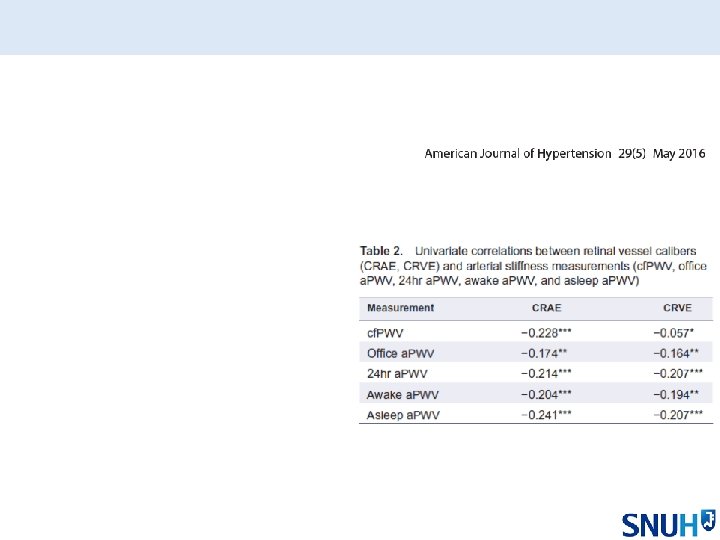
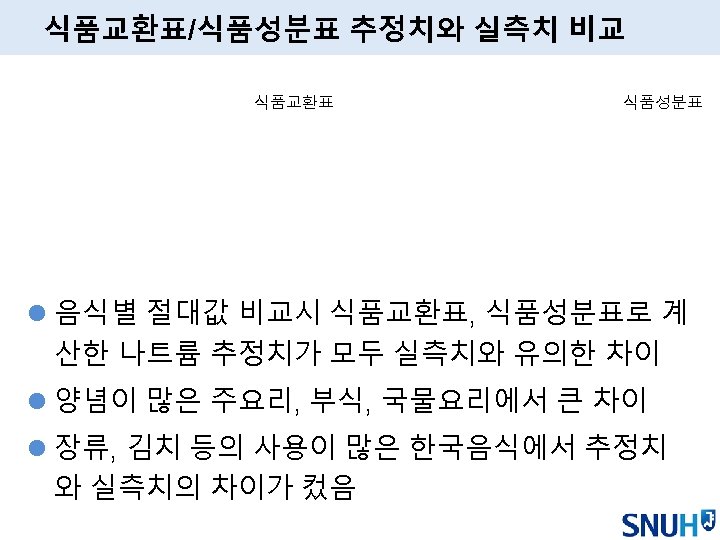
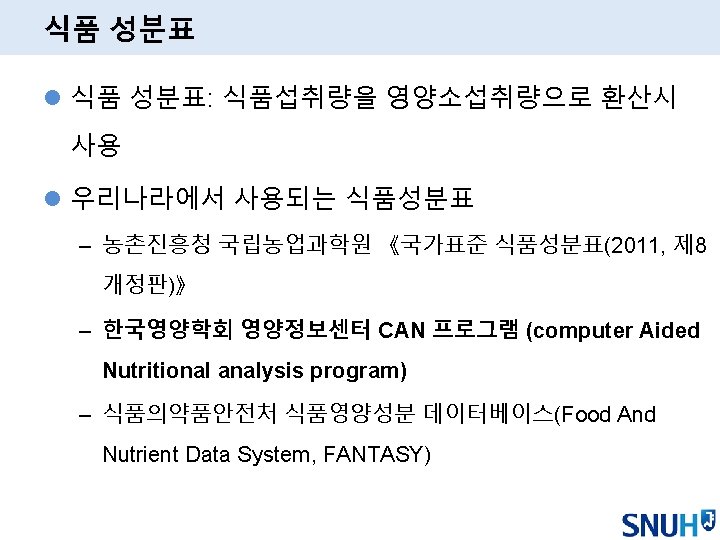
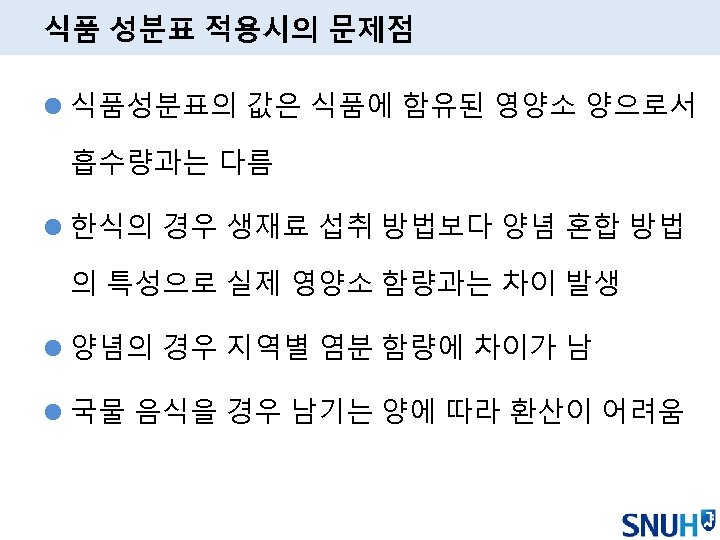
 39, 192– 198")


")
 1. 5 60")


- Slides: 69
Diverse clinical issues in Epidemiological Studies of the Vascular Disease others - Issues on arterial stiffness - Issues on sodium intake: urinary versus others 이해영 서울대학병원 순환기 내과
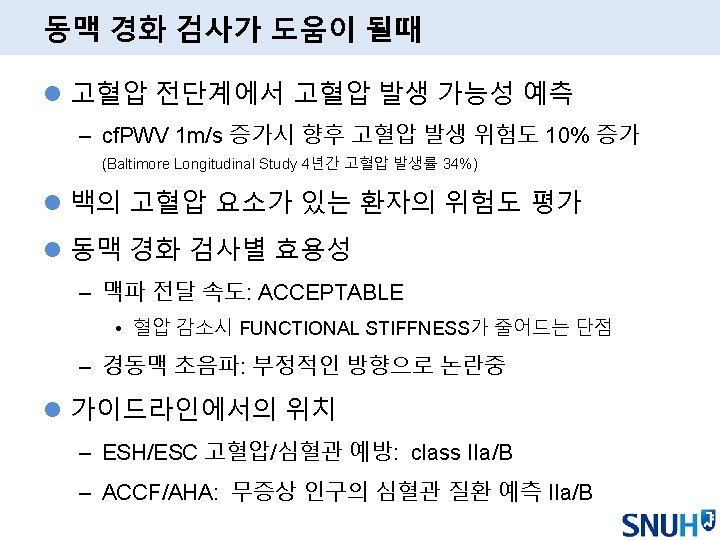
임상 연구에서 이용되는 동맥경화도 검사 l Carotid-femoral pulse wave velocity l Brachial-ankle pulse wave velocity l Central hemodynamics/wave reflections
Pulse Wave Velocity (PWV) PWV = D ÷ DT m/sec D A B is mainly determined by: the elastic and geometric properties of the arterial wall Higher velocity = higher stiffness = lower distensibility = lower compliance
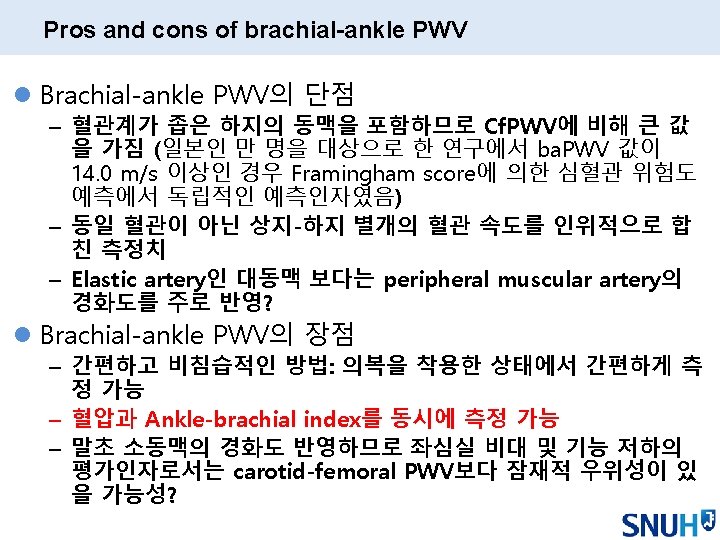
Rationale of carotid-femoral PWV measurement Central Conduit Stiffness = Characteristic Impedence = Carotid- Femoral PWV Peripheral (muscular) Conduit Stiffness = Carotid- Brachial PWV = Carotid- Radial PWV
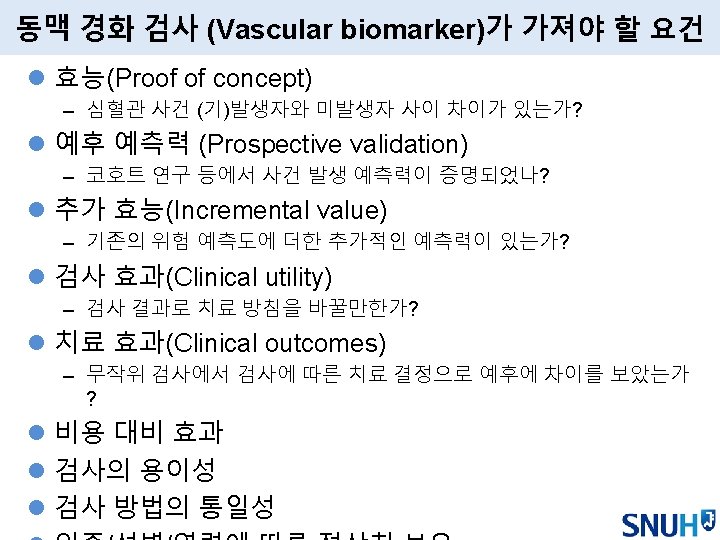
C-F PWV in prospective cohort study l In the Framingham study, 15. 7% Pts at intermediate risk reclassified into a higher (14. 3%) or lower (1. 4%) risk category. l In multivariable analysis, higher aortic PWV was associated with a 48% increase in CVD (95% CI, 1. 161. 91 per SD; P = 0. 002). l After PWV added to a standard risk factor model, integrated discrimination improvement was 0. 7% (95% CI, 0. 05 -1. 3%; P <0. 05). l For carotid-femoral PWV, the inverse transform was used, and results were expressed per 1 SD lower inverse values (which correspond to higher PWV). Circulation. 2010; 121: 505 -511
Noninvasive estimation of aortic blood pressure Noninvasive measurement underestimate actual SBP by ~4. 5 mm. Hg compared with ‘gold standard’ invasive catheter measurement J of hypertension. 2016; 34: 1237 -48
P 2 -P 1 Augmentation index = Pulse pressure P 2 P 1
Indirect, non-invasive methods for estimating central pressure l Radial arterial tonometry: Sphygmo. Cor, HEM 9000 AI l High-sensitivity cuff oscillometry: ARCsolver device incorporated in Mobil-O-Graph
중심 동맥압이 상완 동맥압에 비해 경동맥 비대/ 죽상 경화 예측에 우월함 *Statistical comparison of central vs brachial correlation Roman MJ, Devereux RB. Hypertension. 2014; 63: 1148 -1153
중심 동맥압이 상완 동맥압에 비해 좌심실 질량 / 좌심실 비대 예측에 우월함 *Statistical comparison of central vs brachial correlation Roman MJ, Devereux RB. Hypertension. 2014; 63: 1148 -1153
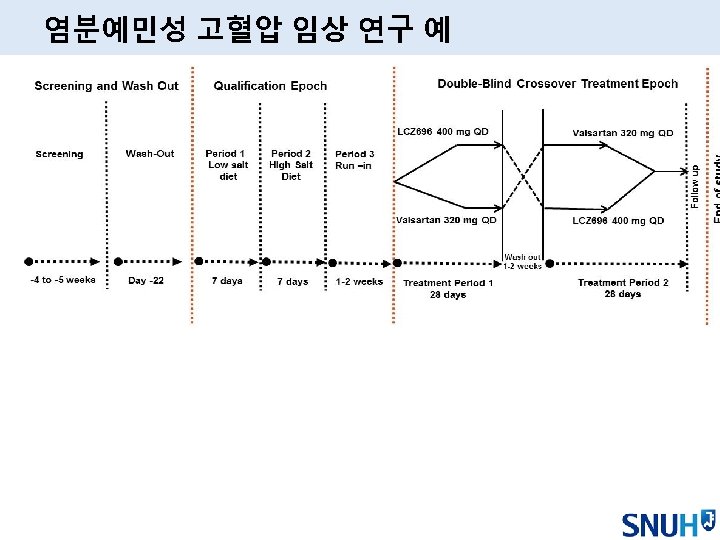
Differential effects on central BP between ARB/CCB vs ARB/HCT in hypertensive patients J-CORE Study: 24 -week, prospective, randomized, openlabel, blinded end point, parallel-group study with 2 treatment arms, evaluating the effects of olmesartan/azelnidipine and olmesartan/HCT on central SBP and ABPM J-CORE study by Kario K et al. Hypertension. 2009; 54(2): 409 -4
Change of the Brachial Systolic Blood Pressure (mm. Hg) 180 * mean±SD *:p< 0. 001 ANCOVA 170 Brachial Systolic Blood Pressure 160 150 140 130 155. 0 ± 19. 4 ARB +HCTZ (n=104) 153. 9 134. 4 ± 18. 3 ± 21. 2 ARB+CCB (n=103) ⊿ 2. 6 mm. Hg NS ANCOVA※ 131. 8 120 ± 18. 8 110 * 100 Before starting the additional injection [Matsui Y, Kario K, et al:Hypertension 2009; 54(4), 716 -723] NS:No significant change When the additional injection is ended (after 24 weeks) ※Adjusted according to the age, gender, BMI, treatment power of the depressurizing drug, and baseline
Change of the Central Systolic Blood Pressure (mm. Hg) 180 mean±SD *:p< 0. 001 ANCOVA * 170 160 Central Systolic Blood Pressure 150 140 130 120 145. 1 ± 19. 5 ARB +HCTZ (n=104) 125. 3 143. 8 ± 21. 4 ± 17. 5 ARB+CCB (n=103) p=0. 039 ANCOVA※ 120. 1 110 100 ⊿ 5. 2 mm. Hg ± 18. 4 * Before starting the additional injection [Matsui Y, Kario K, et al:Hypertension 2009; 54(4), 716 -723] When the additional injection is ended (after 24 weeks) ※Adjusted according to the age, gender, BMI, treatment power of the depressurizing drug, and baseline
※ Change of the Augmentaion index(AIx)@75 ※The augmentation Index adjusted as the heart beat rate of 75 beats/min. (%) 38 mean±SD 36 34 32 AIx@75 30 28 26 31. 4 ± 6. 8 ARB +HCTZ (n=104) 31. 7 28. 4 ± 6. 3 ± 7. 9 ARB+CCB (n=103) 24 P< 0. 001 ANCOVA※ 26. 0 ± 7. 5 20 18 ⊿ 2. 8% Before starting the additional injection [Matsui Y, Kario K, et al:Hypertension 2009; 54(4), 716 -723] When the additional injection is ended (after 24 weeks) ※Adjusted according to the age, gender, BMI, treatment power of the depressurizing drug, and baseline
Change of the Aortic Pulse Wave Velocity (m/sec. ) 13 * mean±SD *:p< 0. 001 ANCOVA 12 Aortic PWV 11 10. 3 ± 2. 2 ARB +HCTZ (n=104) 10 10. 2 9 ± 2. 0 ARB+CCB (n=103) 9. 8 ± 2. 2 ⊿ 0. 8 m/sec. p< 0. 001 ANCOVA※ 8. 9 ± 1. 9 8 7 * Before starting the additional injection [Matsui Y, Kario K, et al:Hypertension 2009; 54(4), 716 -723] When the additional injection is ended (after 24 weeks) ※Adjusted according to the age, gender, BMI, treatment power of the depressurizing drug, and baseline
고혈압 환자의 위험도 평가에 중심 동맥압이 Reclassification 효과가 있음 l Overlap in aortic SBP despite no overlap in brachial SBP, in healthy men and women (n = 5648). l > 70% of individuals with high-normal BP had aortic SBP in common with individuals with stage 1 hypertension. Hypertension 2008; 51: 1476– 1482
Pulse pressure rapidly increases in women over forties Central pulse pressure --- : Male --- : Female Peripheral pulse pressure
Age effect on vascular stiffness is greater in women Augmentation index @ 75 --- : Male --- : Female Aortic PWV Leg PWV
Arteries becomes stiff following aging Age, years Korean Arterial Aging Study (KAAS)
Impact of heart rate on central pressures and hemodynamics CAFÉ-Heart rate. JACC 2009
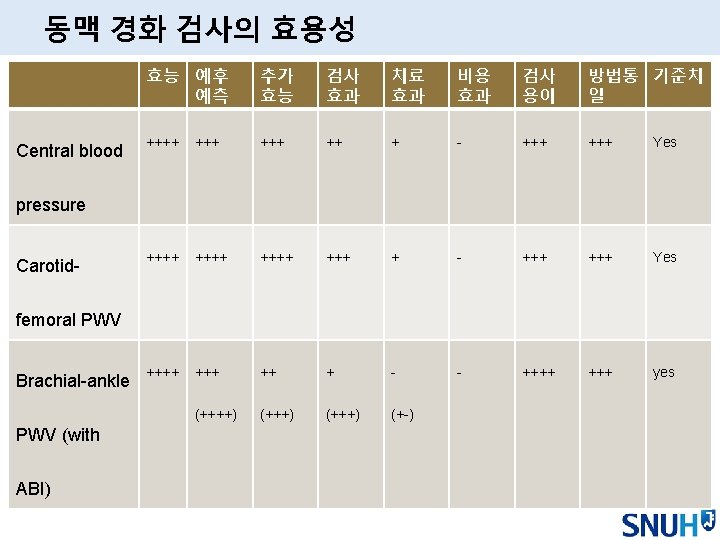
Sensitivity to detect treatment-induced changes by markers of asymptomatic OD Markers LVH/ECG LVH/Echo Sensitivity for change Low Moderate Time Prognostic values to change of changes > 6 month Yes e. GFR Urinary protein Moderate > years No data High weeks-months Moderate Carotid a thickness PWV ABI Very low High Low > years No weeks-months Limited data No data
치료법에 따른 동맥경화도, 중심동맥압 변화 속도 l 치료에 따른 변화의 경우 소형 동맥(muscular artery) 이 대형 동맥(elastic artery)에 비해 용이할 것이다. l 중재에 따른 동맥경화지표의 변화 기전 및 소요 시간 – Distension BP and flow modifications: 수시간-수주 – Arterial wall muscular fibers affecting the vasomotion function (constriction and dilation): > 4 -6개월 – Arterial wall structure by affecting the elastin/collagen fibers content and organization: > 4 -6개월
24시간 동맥경화도 측정 l Mobil-O-Graph NG-ambulatory blood pressure monitor – oscillometric method (ARCSolver algorithm) with an upper-arm blood pressure cuff. – The standard cuff, inflated to just above the diastolic pressure, is used to record the brachial artery waveforms. – Then, a generalized transfer function is applied to the averaged waveform to generate a corresponding aortic waveform, which is scaled to the recorded brachial diastolic and mean pressures. l Comparing the Mobil-O-Graph with the gold standard Sphygmo. Cor, mean difference in estimated aortic SBP of only 0. 1 mm. Hg and a difference in aortic Aix of 1. 2%. l An acceptable accuracy between PWV measured by the Mobil-O-Graph and PWV derived from the invasive intraaortic catheter measurements – Moderately higher PWV values in Mobil-O-Graph
24시간 동맥경화도 측정 기기 Hypertension Research (2016) 39, 192– 198
24시간 중심 동맥압, 동맥 경화도 측정의 배경 l Demonstration of the circadian variation of systolic central BP with lower PP amplification during sleep l Aortic 24 -h pulse pressure is associated more closely than brachial 24 -h PP with left ventricular mass and diastolic dysfunction
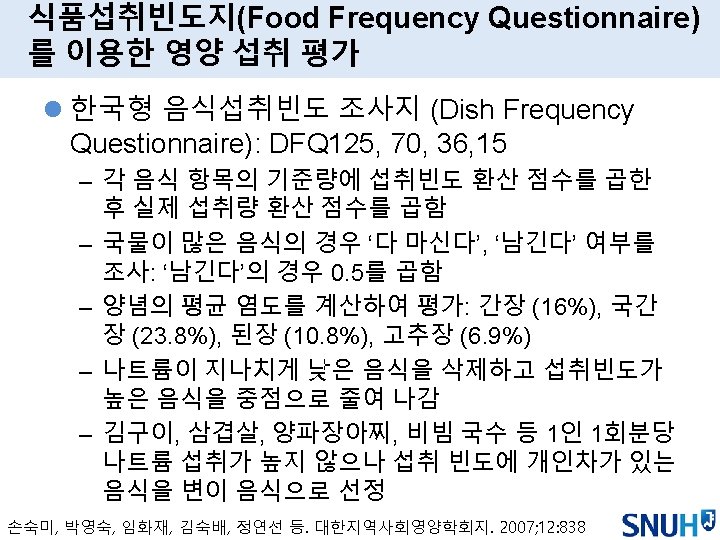
Methods to Measure Sodium Intake 방법 장점 단점 적절한 사례 24 -hour urine analysis Gold standard Objective Day-to-day variation Time, Costs Low compliance Individual level Patient monitoring Spot-urine analysis Time, Costs Objective Within-day variation Day-to-day variation Population level Food diary Prospective 여러날(3 -day) 측정가능 Day-to-day variation Low compliance Smaller epi studies 24 -hour recall Time Compliance Day-to-day variation Interviewer effect Cost for conversion Dietary education Food frequency questionnaire DTD variation 영향 적음 다른 영양소 정보 Seasonal var. Interviewer effect Cost for conversion Larger epi studies
염분 예민성 고혈압의 평가 l Patients maintained a low sodium diet (50 mmol/day, 1– 3 g Na. Cl per day) for 7 days, followed by a high sodium diet (320 mmol/day, 12– 15 g Na. Cl per day) for the next 7 days l Bartter's definition: Mean arterial pressure (MAP) based on office BP measurements increased by ≥ 10% when switching from low to high sodium diet
한국인 고혈압 환자에서의 저-레닌 고혈압 특성 분석 이해영, 김철호, 손대원, 오병희, 박영배, 최윤식 Cardiovascular Center, Department of Internal Medicine, Seoul National University Hospital Cardiovascular Center
Low renin hypertension o Characterized by high ratio of aldosterone to plasma renin activity, which may suggest inappropriately increased aldosterone biosynthesis o Widely recognized subset of essential hypertension, marked by distinct physiological features n Salt-sensitivity n Diuretic-responsiveness n Favorable natural history
Contributors and ethnicity of low renin hypertension o Intrinsic renal causes: greatly reduced nephron numbers o Intrinsic mineralocorticoid hormone excess : primary aldosteronism o Familial forms of salt-sensitive hypertension : genetic polymorphism regarding RAA system o Ethnicity n Black HT patients: 52% have low renin profile n White HT patients: 10 -30% n Japan HT patients: 10 -14% o High salt intake?
Method Electric medical record search for patients visiting SNUH from 2001/1 -2006/4 with terms: Hypertension, renin, cardiology Category of renin activity - Low: < 0. 65 ng/m. L/hr - Medium: 0. 66 -4. 50 ng/m. L/hr - High: > 4. 50 ng/m. L/hr 3005 potential patients found Exclusion by medical records review - Current anti-HT medication - Secondary hypertension 1243 patients enrolled Evaluation of patient characteristics according to renin activity - Demographic profiles - Biochemical characteristics - Response to anti-HT medication: CCB, ACEI/ARB
Distribution of renin activity according to gender in Korean HT patients Prevalence 70 (%) 60 63 50 66 59 Total P= 0. 006 Male 40 Female 30 20 10 30 24 18 14 16 11 0 Low renin Medium renin High renin
Renin activity significantly correlates with age Log renin 2 Prevalence (%) 1. 5 60 50 1 40 0. 5 30 0 20 -0. 5 10 0 -1 < 30 31 -50 51 -65 > 65 Low Medium High Significant difference in renin activity between age groups, p < 0. 0001 Age -1. 5 20 40 60 80 Age Significant (negative) correlation Between age and renin activity, p < 0. 0001, r = 0. 33
Relation of biochemical parameters and renin activity Low value Renin 0. 35 0. 18 Aldo. 109 56 Hb 13. 9 1. 5 0. 0001 Hct 41. 1 4. 3 < 0. 0001 Chol. 203 34 Uric acid 5. 0 1. 4 Glucose 102 25 BUN 13. 9 3. 3 Cr 0. 94 0. 16 Na 141 2 Medium 2. 05 1. 04 121 58 14. 7 1. 5 43. 4 4. 1 199 35 5. 3 1. 4 101 16 13. 3 3. 5 0. 98 0. 18 141 2 High p 8. 87 5. 23< 0. 0001 186 83 < 0. 0001 15. 0 1. 8 < 44. 9 5. 1 199 36 5. 8 1. 7 100 19 14. 4 1. 05 0. 24 0. 58 0. 004 0. 849 0. 07 0. 001 140
No difference in BP reduction by Calcium channel blockers according to renin status BP (mm. Hg) 200 180 160 140 120 Initial SBP Initial DBP F/U SBP F/U DBP 100 80 60 40 20 0 Low renin Medium renin High renin
Different BP reduction potential by ARB/ACEI in patients following renin status BP P = 0. 23 (mm. Hg) 200 P = 0. 04 180 160 140 120 Initial SBP Initial DBP F/U SBP F/U DBP 100 80 60 40 20 0 Low renin Medium renin High renin
1회 소변 측정을 통한 나트륨 섭취량 추정 l 24 -hr urine creatinine level was estimated based on the spot random urine creatinine. – Cockcroft-Gault (CG) equation: 24 -hr urine Cr level (mg) = {8–[0. 2 × age (yr)]} × weight(kg), (if women, × 0. 85) l 24 -hr urine sodium level calculated – 33. 409 × XNA 0. 347 – XNA = {spot urine Na (m. Eq/L)/[10 × spot urine Cr (mg/d. L)]} x estimated 24 -hr urine Cr level
1회 소변 측정을 통한 나트륨 섭취량 추정의 신뢰도 l The correlation coefficients between the estimated and measured 24 -hr urine Cr was 0. 896, l After estimating the 24 -hr urine sodium levels, the correlation coefficients between the estimated and measured 24 -hr urine sodium levels was 0. 516 l The sensitivity to estimate the measured 24 -hr urine sodium ≥ 100 m. Eq/day using the estimated amount ≥ 100 m. Eq/day was and 84. 8%. In the Bland-Altman plot, the probability that the difference between the measured and estimated values existed within -1. 96 SD and+1. 96 SD of the mean value was 95. 5%