Chapter 2 Transmission Fundamentals Transmission Terminology Transmission communication


 (discrete) Analog and Digital Waveforms")


 Sine wave is the fundamental periodic analog signal It")


 Phase ( ) • • Phase describes the position of the")

 = A sin(2 ft + )")
 • Wavelength of a signal is the distance traveled by one")


: Frequency-domain decomposition of the composite signal of Fig")


 • There an infinite number of simple sine frequencies (waves)")

 All integer frequencies between 1000 and")


 • Broadband transmission means changing the digital signal to an")


 Bandwidth in hertz, refers to the range")


 and baud rate (Bd) are")
 is used, the capacity of the")
")
 • But communication channels are always affected by noise and distortions.")


 therefore: 20 = 10 log 10(S/N) 2")

- Slides: 71
Chapter 2 – Transmission Fundamentals
Transmission Terminology • Transmission – communication of data by propagation and processing of signals • Data transmission occurs between a transmitter & receiver via some medium • Transmission media is classified as Guided or Unguided • Data must be transformed to electromagnetic waves, in both cases • Guided medium – The waves are guided along a physical path – eg. twisted pair, coaxial cable, optical fiber • Unguided / wireless medium – The waves are not guided – eg. air, seawater, vacuum, outer space
Data • Data can be analog or digital • Analog data are continuous and take continuous values • Analog data can be converted to an analog or modulated into a digital signal • Digital data have discrete states and take discrete values (0 s and 1 s) • Digital data can be converted to a digital signal or modulated into an analog signal for transmission across a medium
Signals • Signal is the electric or electromagnetic representation of data. • Defination: . • A signal is a physical quantity which varies with respect to timespace & contain information from source to destination. • A signals a function that conveys information about the behavior or attributes of some phenomenon" • An electromagnetic signal is generated by the transmitter and then transmitted over a medium • Signals can also be analog or digital • Analog signal • An analog signal has infinitely many levels of intensity over a period of time. As the wave moves from value A to value B, it passes through and includes an infinite number of values along its path. – Signal intensity varies in a smooth way over time. . – It has infinitely many levels of intensity (values) along its path over a period of time. . – There are no breaks or discontinuities in the signal e. g; speech
Signal…. . • Digital signal – Signal intensity maintains a constant level for some period of time and then changes to another constant level e. g; binary 1 s and 0 s – A digital signal can have only a limited number of defined values (often 0 and 1) • A Signal is a function of time, but it can also be expressed as a function of frequency • There are two concepts of data transmission Time domain view and frequency domain view of a signal 2 -5
Analog Data • Analog data take on continuous values in some interval • E. g. voice, video, temperature, and pressure are continuously varying patterns of intensity • freq range of sound wave is 20 Hz-20 k. Hz • human speech spectrum range is 100 Hz-7 k. Hz • Audio signals are easily and directly converted into electromagnetic signals • All sound freqs, whose amplitude is measured in terms of loudness, are converted into electromagnetic freqs, whose amplitude is measured in volts • The standard spectrum for a voice channel is 300 -3400 Hz
Digital Data • Digital data take on discrete values e. g. text, integers, etc • Textual data cannot be easily stored or transmitted by data processing and communication systems • Communication systems are designed for binary data • Therefore some text codes have been devised by which characters a represented by a sequence of bits • Commonly used text code: IRA (international reference alphabet) • IRA-encoded characters are using 8 bits per character • 8 th bit is a parity bit used for error detection • Thus binary data is generated by terminals and computers etc and then converted into digital voltage pulses for transmission • The signal uses two constant dc components (voltage levels) 0 or 1 2 -8
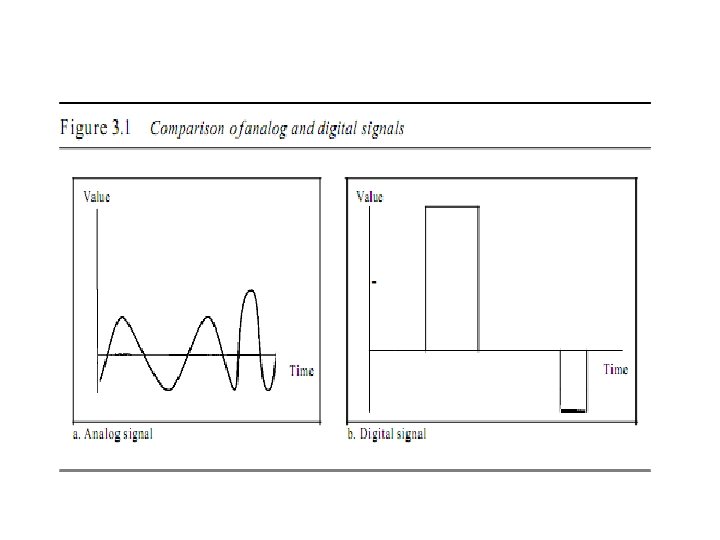
Analog Signals
Digital Signals
Time Domain Concepts • Time Domain Concepts: – Electromagnetic signals are viewed as a function of time – The time-domain plot shows changes in signal amplitude with respect to time – It is an amplitude-versus-time plot 2 -11
Analogue & Digital Signals (continuous) (discrete) Analog and Digital Waveforms
Periodic and Non-periodic Signals • Periodic signal – – A signal completes a pattern within a measurable time frame called a Period. one full pattern is called a cycle If same signal pattern repeats over subsequent identical periods called periodic signal. • Non-periodic signal • pattern not repeated over time • Both analog and digital signals can be periodic or non-periodic – (a) shows periodic continuous signal (sine wave) – (b) shows periodic discrete signal (square wave) • In data comm. , we commonly use periodic analog signals and non-periodic digital signals. .
Cont. . example
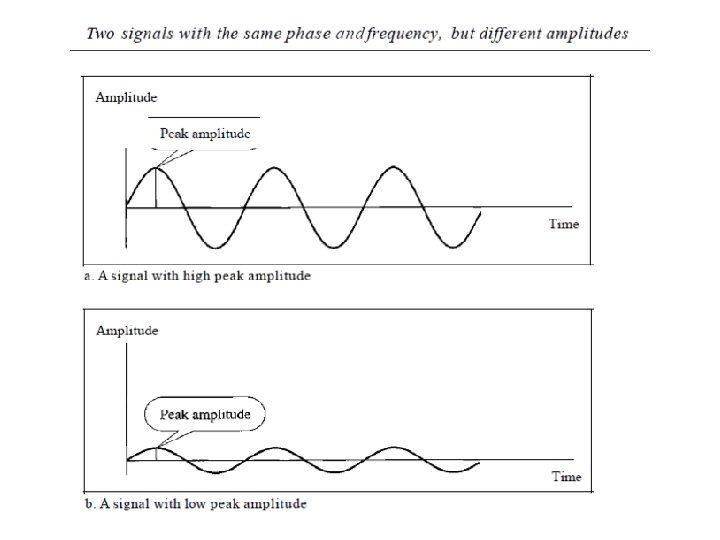
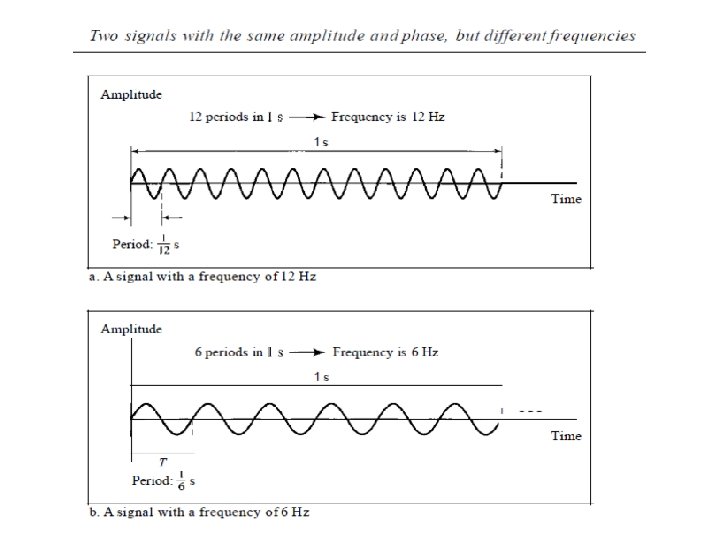
Sine Wave • • 1) Sine wave is the fundamental periodic analog signal It is represented by three parameters: Peak amplitude (A) • • • 2) Highest intensity (value) of a signal over time Proportional to the energy it carries Measured in volts frequency (f) • • Number of cycles per second. Rate of change of signal (rate at which signal repeats) Measured in Hertz (Hz) Period refers to the amount of time, in seconds, a signal needs to complete 1 cycle. Frequency refers to the number of periods in I s. period = time required for one repetition (one cycle) =T T = 1/f or f = 1/T Period and frequency are the inverse of each other
Example The power we use at home has a frequency of 60 HZ What is the period of this sine wave? Solution: • wave can be determined as follows: • T= 1/f = 1/60 • = 0. 0166 s = 0. 0166 x 10 pow 3 ms=16. 6 ms
Example
Questions Q#1 A signal has a fundamental frequency of 1000 Hz. What is its period? Q#2 Given the following periods, calculate the corresponding frequencies. (i) 50 s (ii) 5 s (iii) 10 s 2 -20
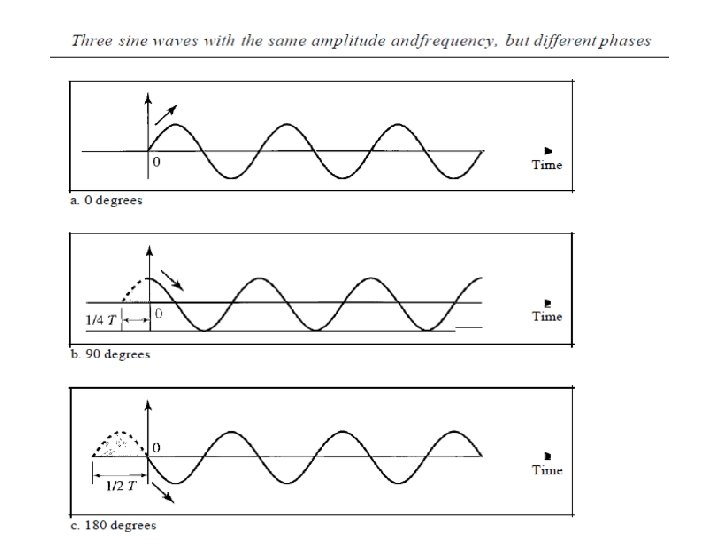
Cont. . 3) Phase ( ) • • Phase describes the position of the waveform relative to time 0 Measure of the relative position in time within a single period of signal Phase is the fractional part t/T of the period T through which t has advanced relative to an arbitrary origin If we think of the wave as something that can be shifted backward or forward along the time axis, phase describes the amount of that shift The origin is usually taken as the last previous passage through zero is sometimes referred to as a phase-shift, because it represents a "shift" from zero phase. Phase shift is any change that occurs in the phase of one signal, or in the phase difference between two or more signals.
Cont. . • Phase is measured in degrees or radians • 360° is 2π rad; 1° is 2π/360 rad; and 1 rad is 360/(2 π) • A phase shift of 360° corresponds to a shift of a complete period • a phase shift of 180° corresponds to a shift of onehalf of a period; and • a phase shift of 90° corresponds to a shift of onequarter of a period (see Figure).
Varying Sine Waves s(t) = A sin(2 ft + )
Wavelength ( ) • Wavelength of a signal is the distance traveled by one cycle • Distance between two points of corresponding phase of two consecutive cycles • Wavelength can be calculated if one is given the propagation speed and the period of the signal. • Assume signal is traveling with velocity v then = v. T • or equivalently = v/ f • wavelength is normally measured in micrometers (μm)
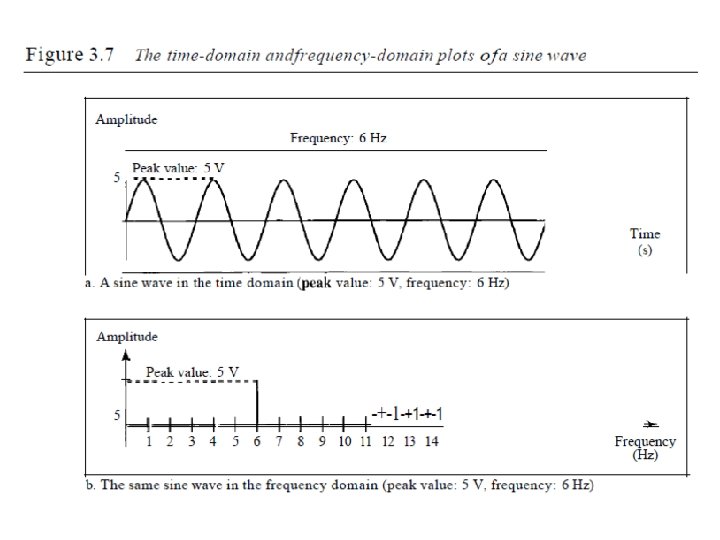
Frequency Domain Concept • Time-domain plot shows changes in signal amplitude with respect to time • A frequency-domain plot is concerned with only the peak value and the frequency of the signal as a whole. • Changes of amplitude during one period are not shown. • A complete sine wave in the time domain can be represented by one single spike in the frequency domain. (see fig) • The position of the spike shows the frequency and its height shows the peak amplitude
Cont. . • The frequency domain is more compact and useful when we are dealing with more than one sine wave. • Figure below shows three sine waves, each with different amplitude and frequency. • All can be represented by three spikes in the frequency domain
Composite Signals • • • A single frequency sine wave is not useful in data communications If we had only one single sine wave to convey a conversation over the phone, it would make no sense and carry no information. We would just hear a buzz we need to send a composite signal to communicate data. Any composite signal is a combination of simple sine waves with different frequencies, amplitudes, and phases as shown in fig (c) The fig (a) fig (b) shows the components of fig (c) which are just simple sine waves of frequencies f and 3 f Their sine waves are: – Fig (a): s(t) = sin(2 ft) – Fig (b): s(t) = (1/3) sin(2 (3 f)t) The second freq is the integer multiple of the first freq. Thus first freq component is called Fundamental freq. The period of the composite signal is equal to the period of the fundamental freq as in fig (c) The composite signal generated from fig (a) & (b) will be: – Fig (c): s(t) = (4/ ) [sin(2 ft) + (1/3) sin(2 (3 f)t)]
Decomposition of a composite signal in time domain
Frequency Domain Representations • Fig (d): Frequency-domain decomposition of the composite signal of Fig (c)
Periodic/ Non- Periodic Composite signals • A composite signal can be periodic or non-periodic • A periodic composite signal can be decomposed into a series of simple sine waves with discrete frequencies. • Discrete Frequencies have integer values (1, 2, 3, ……) • A non-periodic composite signal can be decomposed into a combination of an infinite number of simple sine waves with continuous frequencies • Continuous Frequencies have real values. • For composite periodic signal see previous fig (c) • Fig (a) & (b) shows decomposition of fig (c) • For its freq-domain decomposition see fig (d), it shows discrete frequencies
Example: Non-periodic Composite Signal
Example (Cont. . ) • There an infinite number of simple sine frequencies (waves) in a non-periodic composite signal created by a microphone • A normal human being can create a continuous range of frequencies between 0 and 4 k. Hz • Frequency decomposition of this signal produces a continuous curve. • There an infinite number of frequencies between 0. 0 and 4000. 0 (real values). • The height of the vertical line is the amplitude of the corresponding frequency
Spectrum & Bandwidth • Spectrum of a signal – range of frequencies contained in a composite signal – For the signal of fig (c), the spectrum extends from f to 3 f • Bandwidth of a signal – Width of the spectrum (diff. b/w max & min freq of the spectrum) – In case of fig (c), the bandwidth is 2 f • Effective bandwidth – Most of the composite signal energy is contained in a relatively narrow band of frequencies – This band is called effective bandwidth – often called bandwidth
§Fig. shows the spectrum and bandwidth § (a) All integer frequencies between 1000 and 5000 §(b) frequencies are continuous between 1000 and 5000 § High amplitude at the center of both figs shows effective bandwidth
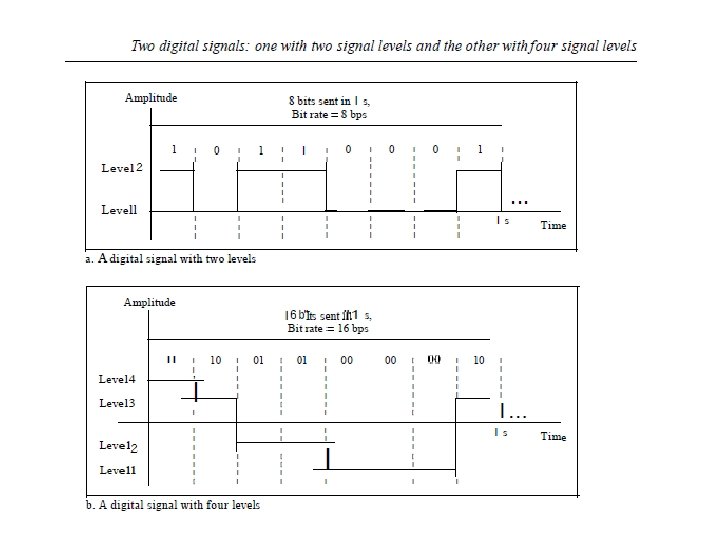
Digital Signal • An electronic signal transmitted as binary code that can be either the presence or absence of current, high and low voltages or short pulses at a particular frequency • An arbitrary bit stream; 1 can be encoded as a high (positive) voltage and 0 as low (non-positive) voltage • Digital format is ideal for electronic communication as the string of 1 s and 0 s can be transmitted by a series of "on/off" signals represented by pulses of electricity or light. • A pulse "on" can represent a 1, and the lack of a pulse "off" can represent a 0 • Most digital signals are non periodic • A digital signal can have more than two levels • In this case, we can send more than 1 bit for each level (see fig) • (a) shows 1 bit per level • (b) shows 2 bits per level • If a signal has L levels then no. of bits per level = log 2 L
Signal Element Versus Data Element • In data communications, our goal is to send data elements • A data element is the smallest entity that can represent a piece of information: this is the bit. • In digital data communications, a signal element carries data elements. • A signal element is the shortest unit (time wise) of a digital signal. • data elements are what we need to send; signal elements are what we can send. • Data elements are being carried; signal elements are the carriers.
Data Rate or Bit Rate • The data rate defines the number of data elements (bits) sent in 1 sec. • The unit is bits per second (bps) • The data rate is sometimes called the bit rate • Frequency is not appropriate characteristic for digital signal • The term-bit rate is used to describe digital signals
Bit Length • The concept of wavelength is for an analog signal: that is the distance one cycle occupies on the transmission medium. • For a digital signal Bit length is used instead of wavelength. • Bit length is the distance one bit occupies on the transmission medium.
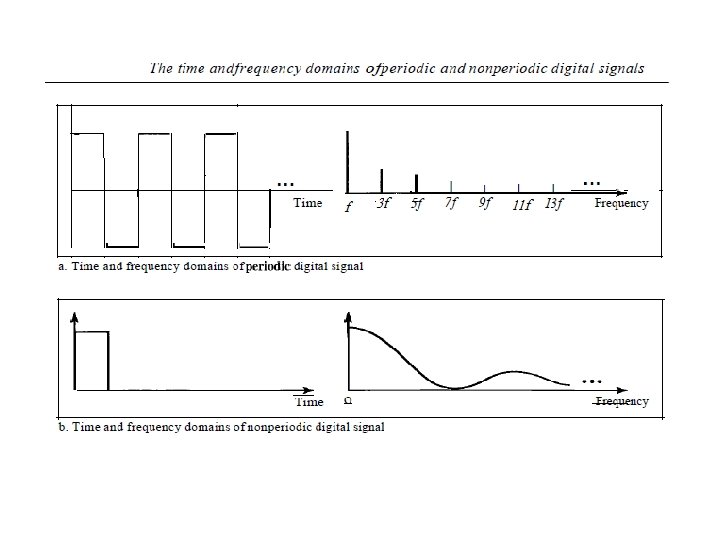
Digital Signal as a Composite Analog Signal • Based on Fourier analysis, a digital signal is a composite analog signal. • Having only infinite bandwidth • A digital signal, in the time domain (see fig), comprises connected vertical and horizontal line segments. • A vertical line in the time domain means a frequency of infinity (sudden change in time) • A horizontal line in the time domain means a frequency of zero (no change in time). • Going from a frequency of zero to a frequency of infinity (and vice versa) implies all frequencies in between are part of the domain. Hence infinite bandwidth • If the digital signal is periodic, which is rare in data communications, the decomposed signal has a frequency domain representation with an infinite bandwidth and discrete frequencies (see fig). • If the digital signal is non-periodic, the decomposed signal still has an infinite bandwidth, but the frequencies are continuous (see fig)
Transmission of Digital Signals • Thus a digital signal, periodic or non-periodic, is a composite analog signal with frequencies between zero and infinity. • In data communications, we consider the case of a non-periodic digital signal. • A digital signal can be transmitted by using one of two different approaches: – baseband transmission or – broadband transmission (using modulation).
Baseband Transmission • Means sending a digital signal over a channel without changing to an analog signal. See Fig below • Baseband transmission requires a low-pass channel • It is a channel with a bandwidth that starts from zero freq. . • This is, the entire bandwidth of a cable connecting two computers is one single channel (a dedicated medium) • Baseband transmission of a digital signal that preserves the entire shape (bandwidth) of the digital signal is possible only if we have a low-pass channel with an infinite or very wide bandwidth e. g; coaxial cable or fiber optic • It will also be needed to send bits faster
Broadband Transmission (Using Modulation) • Broadband transmission means changing the digital signal to an analog signal for transmission. • Modulation allows us to use a Bandpass channel • It is a channel with a bandwidth that does not start from zero freq. • we cannot send the digital signal directly to this channel; we need to convert the digital signal to an analog signal before transmission
Example
Relationship b/w Data Rate and Bandwidth • Any transmission system ( transmitter + medium + receiver) accommodates only a limited band of frequencies • This limits the data rate that can be carried on the medium • A square waveform (digital) has an infinite no. of frequency components and hence an infinite bandwidth • Furthermore, the greater the bandwidth of a channel, the greater the cost • On the other hand limiting the bandwidth of a channel increases distortion • The higher the data rate of a signal, the greater is its required effective bandwidth • There is a direct relationship between data rate & bandwidth
Bandwidth • Used in two context 1) Bandwidth in hertz, refers to the range of frequencies in a composite signal or the range of frequencies that a channel can pass. – If a telephone channel can transmit frequencies from 300 Hz to 3400 Hz, it has a BW of 3100 Hz. 2) Bandwidth in bits per second, refers to the speed of bit transmission in a channel or link – The bandwidth of a Fast Ethernet network is a maximum of 100 Mbps. This means that this network can send 100 Mbps. • An increase in bandwidth in hertz means an increase in bandwidth in bits per second 2 -49
Channel and Channel Capacity • A path that connects the sender and recipient, and could take the form of cables, circuits or even satellite transmission links is called a Channel • Max bit rate at which data can be transmitted on communication channel/path is called Channel Capacity • Channel capacity is a function of – data rate: rate in bits per second (bps) – Bandwidth: bandwidth in hertz or in bps – noise : average noise over communications path – error rate: rate at which errors occur • Error is the reception of 1 when 0 transmitted or 0 when 1 transmitted • We want the most efficient use of the capacity • Because the greater the bandwidth of a facility, the greater the cost
Bandwidth categories of a Channel • Narrowband: – This is for the channels with BW less than 4000 Hz. – E. g. a telegraph channel has a BW of 200 Hz. • Voiceband: – This is the range of frequencies transmitted over a normal telephone network channel i. e. 4000 Hz. • Wideband: – Channels which have a BW exceeding 4000 Hz are usually placed under this category. 2 -51
Other Terms • Pass Band: – a particular range of frequencies which can be passed through the transmission equipment. – e. g a telegraph circuit could have a pass band between 1200 to 1400 Hz, and a BW of 200 Hz. • Cut-off frequencies: – The cut-off frequencies of the telegraph channel above are 1200 Hz and 1400 Hz. – A frequency at which the attenuation of a device begins to increase sharply, such as the limiting frequency below which a traveling wave in a given mode cannot be maintained in a waveguide, or the frequency above which an electron tube loses efficiency rapidly. – Also known as critical frequency or corner frequency. 2 -52
Throughput • It is a measure of how fast we can actually send data through a network. • Although, bandwidth in bits per second and throughput seem the same, but they are different. • In other words, the bandwidth is a potential measurement of a link; the throughput is an actual measurement of how fast we can send data. • E. g; we may have a link with a bandwidth of 1 Mbps, but the devices connected to the end of the link may handle only 256 kbps. This means that we cannot send more than 256 kbps through this link. 2 -53
Transmission Impairments • Signals travel through transmission media, which are not perfect • Thus signal received may differ from signal transmitted causing: – For analog signals - degradation of signal quality – For digital signals - bit errors (1 becomes 0 or 0 becomes 1) • Called Transmission Impairments • Most significant impairments are – – Attenuation (weak signals) Delay distortion (delay due to distortion) Jitters (variation in delay) Noise (unwanted signals)
Attenuation • When signal strength falls off with distance due to medium imperfection is called Attenuation • received signal strength must be: – strong enough to be detected – sufficiently higher than noise to be received without error • Solution: Strength can be increased using amplifiers/repeaters • To show that a signal has lost or gained strength, engineers use the unit of the decibel. • The decibel (d. B) measures the relative strengths of two signals or one signal at two different points (P 1 & P 2). • Note that the decibel is negative if a signal is attenuated and positive if a signal is amplified.
Delay Distortion or Distortion • Distortion means the signal changes its form or shape • Distortion can occur in a composite signal made of different frequencies. • Each signal component has its own propagation speed through a medium • Hence various components arrive at the receiver at different times • Resulting in phase shifts between the different frequencies if the received signal is distorted due to varying delays experienced at its component frequencies • Differences in delay may create a difference in phase if the delay is not exactly the same as the period duration.
Cont. . • • The shape of the composite signal is therefore not the same. (See Figure) It only occurs in guided media It is particularly critical for digital data Because some signal components of one bit position will run over into other bit positions, causing inter-symbol interference
Jitters • Due to variation in phase delay • We can roughly say that jitter is a problem if different packets of data encounter different delays and the application using the data at the receiver site is timesensitive (audio and video data) • For example, If the delay for the first packet is 20 ms, for the second is 45 ms, and for the third is 40 ms, then the real -time application that uses the packets suffers jitter • Attenuation, distortion and the modulation of the telephone channel causes variation in the propagation delay at any single signal • This is known as Jitter. 58
Noise • Additional undesired signals added between transmitter and receiver • Thermal noise – Due to random motion of electrons in a wire which creates an extra signal – It is a function of temperature – Uniformly distributed across the bandwidth – Present in all electronic devices and transmission media – Also called white noise – Particularly significant for satellite communication
Noise • Intermodulation noise – When signal at different frequencies share the same transmission medium – Produce new signals at a freq that is the sum, difference, or multiple of the two original frequencies sharing the same medium • Crosstalk noise – – Crosstalk is the interference of one wire on the other. A signal from one line is picked up by another Unwanted coupling between signal paths Due to electrical coupling between nearby twisted pairs
Noise • Impulse noise – It is an irregular noise spike (a signal with high energy in a very short time) – Such as short clicks and crackles with no loss of intelligibility – Due to the fault in system, external electromagnetic interference e. g; power lines, lightning, and so on – It is of short duration and high amplitude – A minor annoyance for analog data – But a major source of error in digital data • a noise spike could corrupt many bits
Noise • Echo noise – On some very long circuits, mismatching of the lines causes the signals to be reflected back to the speaker after a slight delay. – To overcome this, echo suppressors or echo cancellers are fitted to the line so that speech is being transmitted only in one direction at a time. 62
BIT and BAUD RATES • • • Transmission speed is measured in terms of bits per second (BPS) The higher the BW, the greater the data carrying capacity of a channel. The Baud rate is the no. of distinct signals (signal elements) sent in one sec. It indicates the no. of signal elements per second or no. of pulses per second A signal element is represented by a change in a particular characteristic (Amplitude , frequency & phase) of a Sine wave form. Therefore , the Baud rate indicates how many changes of phase, frequency or amplitude there will be in one second. • The baud rate is sometimes called the pulse rate, the modulation rate, or the signal rate • The term “Modulation Rate” is used in preference to Baud rate when talking about modems. • Nyquist’s law states that maximum theoretical Baud or Bit rate of the telephone channel is twice the BW: – Max. Baud Rate = 2 x Bandwidth ; or – Max. Bit Rate = (Max. Bd) x log 2 L • where L is the number of signal levels 63
Noiseless Channel: Nyquist Capacity • Usually bit rate (bps) and baud rate (Bd) are the same except when a baud represents more than one bit of information • For a Noise free channel the limitation on bit rate is only the BW of the signal • Nyquist’s theorem states that given a BW (W) the highest data rate that can be carried is 2 W. Which means if you are using a voice grade telephone of a BW of 3000 Hz to transmit your data, then the capacity of the channel is 2 W=6000 bps. (when log 2 L= 1). 64
Cont. . • However if multilevel coding (modulation) is used, the capacity of the link becomes: C= 2 W log 2 L Where L= no. of discrete signals or voltage levels. • If we use 3 -bit encoding scheme , 23=8=L; and W=3000; then C = 2 (3000) (log 28) = 6000(3) = 18000 bps • But we know that increasing the levels of a signal may reduce the reliability of the system. 65
Example: • Data is to be transmitted over the PSTN (public switched telephone network) using a transmission scheme with 16 levels per signaling element. If the BW of the PSTN is 3000 Hz, work out the Nyquist maximum data transfer rate (C) • Solution: L=16 means we use 4 -bit encoding scheme and W=3000; then • C = 2 (3000) (log 2 16) = 6000(4) = 24000 bps 66
Signal-to-Noise Ratio (SNR) • But communication channels are always affected by noise and distortions. • To find theoretical bit rate limit, we need to know the ratio of the signal power to the noise power • If signal-to-noise ratio is: – S/N = Average signal power / Average noise power • S/N is actually the ratio of what is wanted (signal) to what is not wanted (noise). • A high S/N means the signal is less corrupted by noise; a low S/N means the signal is more corrupted by noise. • Because S/N is the ratio of two powers, it is often described in decibel units and is called Signal-to-Noise ratio (SNR) as: – SNR = l 0 logl 0 (S/N ) d. B 2 -67
Noisy Channel: Shannon Capacity • For a noisy channel, the data rate is related to the signal to noise ratio, and we use the formula given by Shannon and Hartley: C = W x log 2(1+ S/N) bps C = data rate in bps; W is the BW of the line in Hz; S is the average signal power in Watts; N is the average noise power in Watts. 68
Example: • Assuming that a PSTN has a BW of 3000 Hz and a typical signal to noise power ratio of 20 d. B, determine the maximum data rate that can be achieved. 69
Solution: • SNR = signal-to-noise-ratio=10 log 10(S/N) therefore: 20 = 10 log 10(S/N) 2 = log 10(S/N) 102 = S/N; Hence: S/N = 100; now : C = W log 2(1+ S/N) bps Therefore: C = 3000 x log 2(1+ 100) bps C = 3000 [ log 2 (101)] bps C = 19, 976 bps 70
Summary • Looked at: – – – – – Analog vs Digital signals Simple vs Composite signals Periodic vs Non-Periodic signals Frequency, wavelength, spectrum & bandwidth Transmission of digital signals Bit rate, bit length, Baud rate Channel Capacity Transmission impairments Noiseless and Noisy channels