C 3 Ternary Systems Example 1 Ternary Eutectic


 FF = 3 - 2 + 1 =")


:")
 3 binary systems: Fo-An eutectic An-Si. O")


,")


- Slides: 51
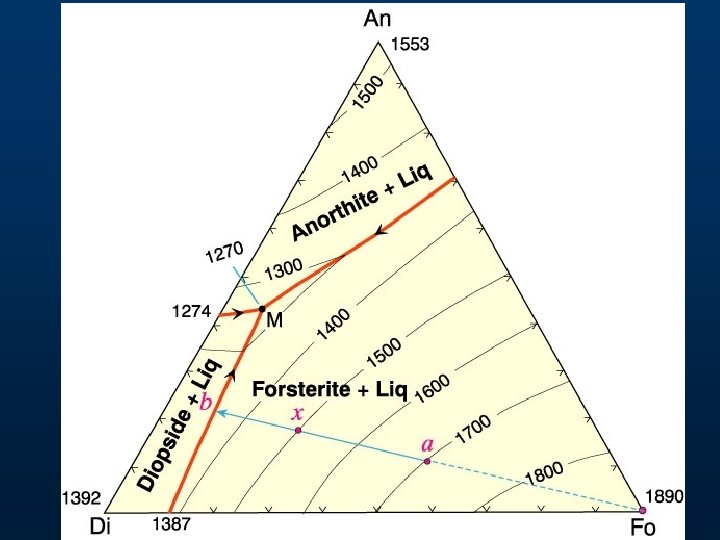
C = 3: Ternary Systems: Example 1: Ternary Eutectic Di - An - Fo Anorthite Note three binary eutectics No solid solution Ternary eutectic = M M T Forsterite Diopside
T - X Projection of Di - An - Fo Figure 7 -2. Isobaric diagram illustrating the liquidus temperatures in the Di-An-Fo system at atmospheric pressure (0. 1 MPa). After Bowen (1915), A. J. Sci. , and Morse (1994), Basalts and Phase Diagrams. Krieger Publishers.
Crystallization Relationships
Liquid a An + Liq Di + An Pure Fo forms Just as in binary f=? F=? An
Ff = 2 (Fo + Liq) FF = 3 - 2 + 1 = 2 If on liquidus, need to specify only 2 intensive variables to determine the system liq F T and X An or liq F X An and X Fo X of pure Fo is fixed
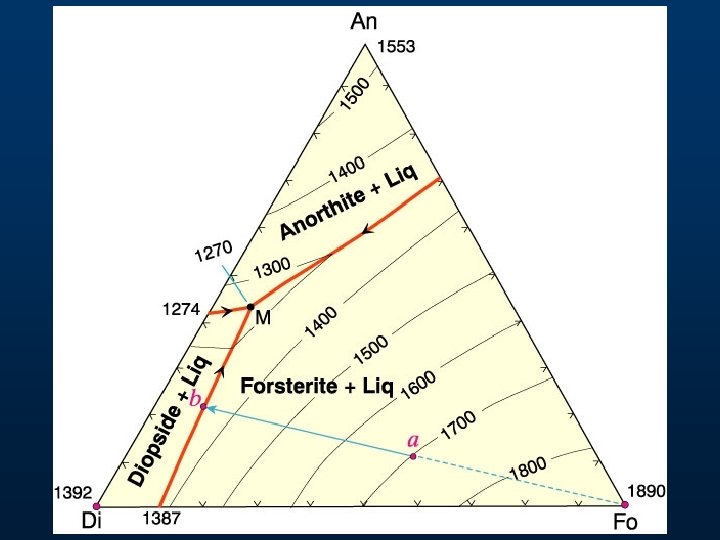
Lever principle ® relative proportions of liquid & Fo o l At 1500 C F Liq x + Fo = bulk a F x/Fo = a-Fo/x-a
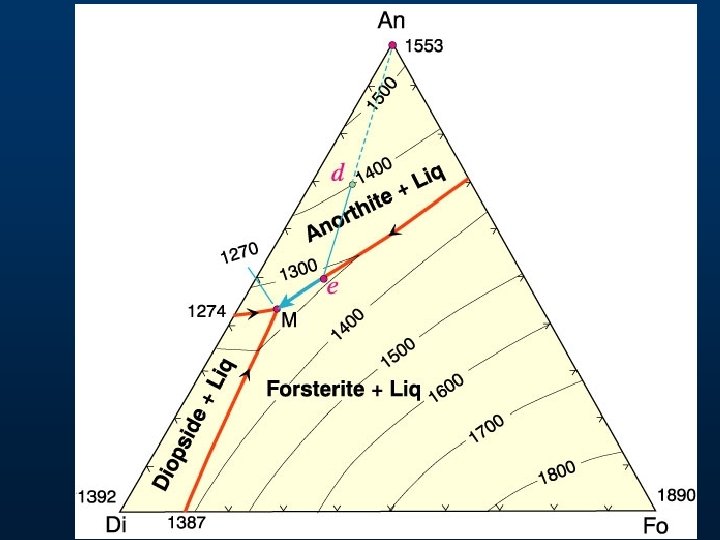
l New continuous reaction as liquid follows cotectic: Liq. A ® Liq. B + Fo + Di 1270 1274 1300 M 0 0 4 1 0 0 5 1 b Liq l Bulk solid extract Di/Fo in bulk solid extract using lever principle 1392 Fo + Liq Di + l Diopside c 1387
o F At 1300 C liquid = X F Imagine triangular plane X - Di - Fo balanced on bulk a Liq x a Di m / / total Di/Fo = m-Fo/Di-m Liq total solids = a-m Liq-a Fo
Partial Melting (remove melt):
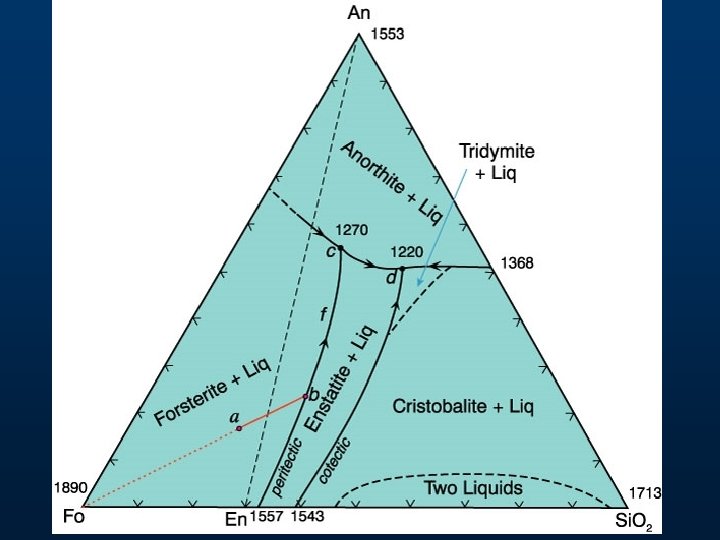
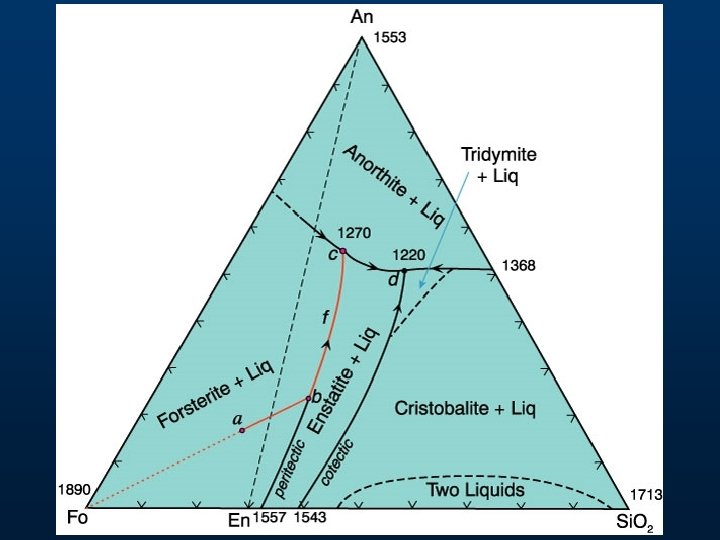
Ternary Peritectic Systems: (at 0. 1 MPa) 3 binary systems: Fo-An eutectic An-Si. O 2 eutectic Fo-Si. O 2 peritectic Figure 7 -4. Isobaric diagram illustrating the cotectic and peritectic curves in the system forsteriteanorthite-silica at 0. 1 MPa. After Anderson (1915) A. J. Sci. , and Irvine (1975) CIW Yearb. 74.
x b +L iq a Fo 1890 En y En sta tite te s r Fo rite iq L +
Works the same way as the Fo - En - Si. O 2 binary 1557 Fo i k En
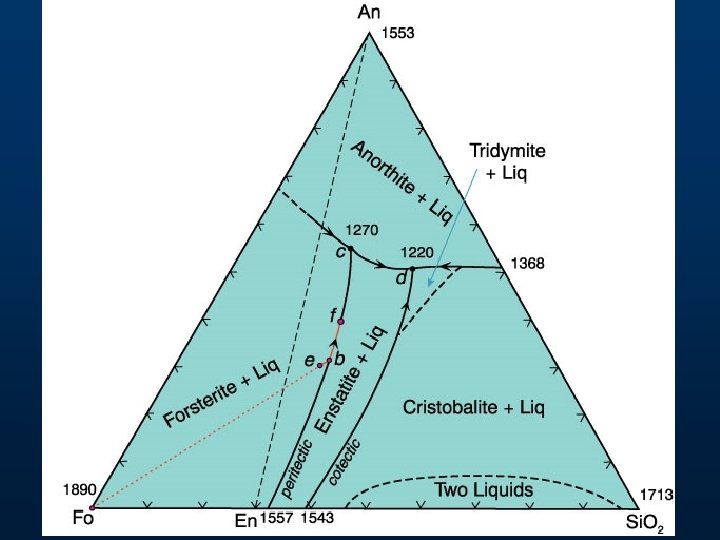
f e t s or rite iq L + e En sta tite +L iq F b Fo En
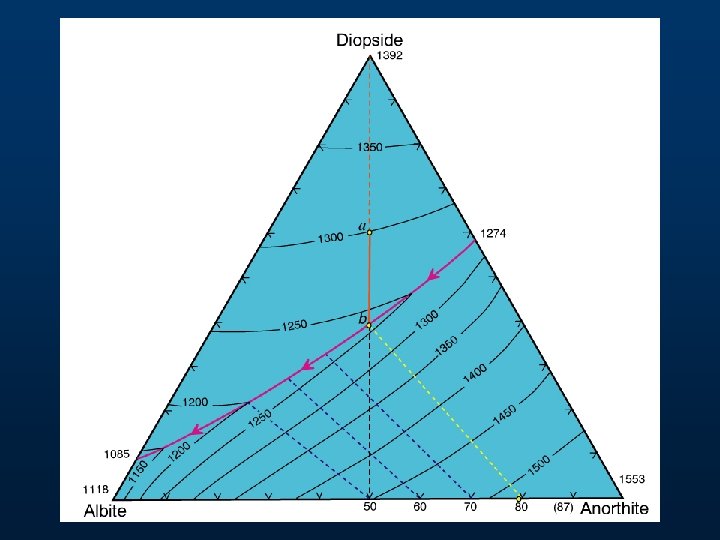
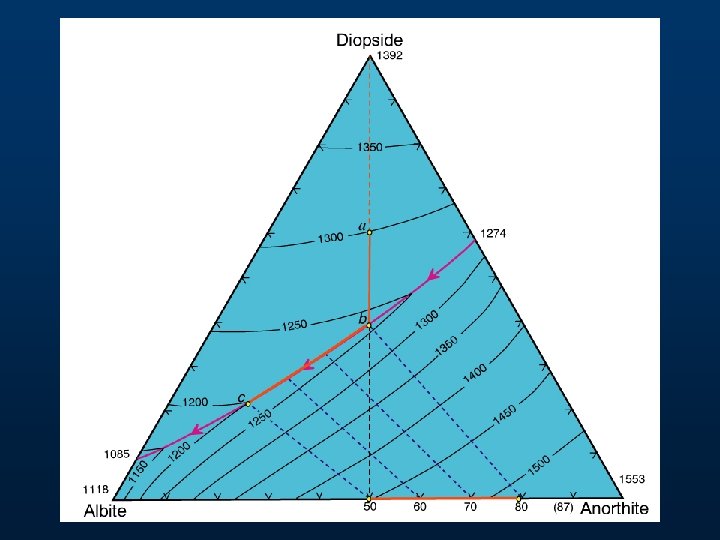
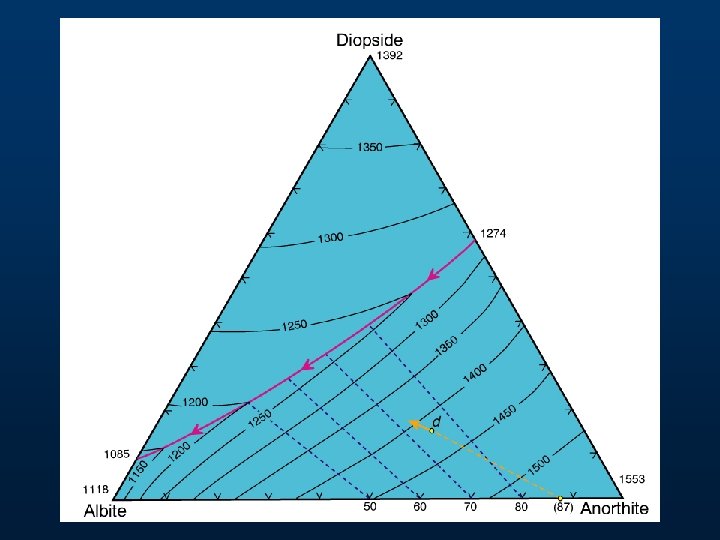
Diopside-Albite-Anorthite Figure 7 -5. Isobaric diagram illustrating the liquidus temperatures in the system diopsideanorthite-albite at atmospheric pressure (0. 1 MPa). After Morse (1994), Basalts and Phase Diagrams. Krieger Publushers Di - An Eutectic Di - Ab Eutectic Ab - An solid solution
Isobaric polythermal projection Figure 7 -5. Isobaric diagram illustrating the liquidus temperatures in the system diopsideanorthite-albite at atmospheric pressure (0. 1 MPa). After Morse (1994), Basalts and Phase Diagrams. Krieger Publishers.
Note: Binary character is usually maintained when a new component is added F F F Eutectic behavior remains eutectic Peritectic behavior remains peritectic Solid solutions remain so as well
Oblique View Isothermal Section Figure 7 -8. Oblique view illustrating an isothermal section through the diopside-albite-anorthite system. Figure 7 -9. Isothermal section at 1250 o. C (and 0. 1 MPa) in the system Di-An-Ab. Both from Morse (1994), Basalts and Phase Diagrams. Krieger Publishers.
Ternary Feldspars id Liqu 1500 1557 us Liquid Plagioclase 1400 To C plus 1300 Liquid us Plagioclase l id So 1200 1118 1100 Ab 20 40 60 80 An Weight % An 1200 Ab-rich feldspar + liquid a liquid b i c Temperature o. C s Or liqu -ric id h + f l oli iqu eld us du i s d pa s r 1000 d e j k f single feldspar so 800 g lv us h two feldspars Or Wt. % Ab Figure 7 -10. After Carmichael et al. (1974), Igneous Petrology. Mc. Graw Hill.
Ternary Feldspars Trace of solvus at three temperature intervals Triangle shows coexisting feldspars and liquid at 900 o. C Figure 7 -11. Winter (2001) An Introduction to Igneous and Metamorphic Petrology. Prentice Hall.
4 - Component Diagrams Figure 7 -12. The system diopside-anorthitealbite-forsterite. After Yoder and Tilley (1962). J. Petrol.
> 4 Components Figure 7 -13. Pressure-temperature phase diagram for the melting of a Snake River (Idaho, USA) tholeiitic basalt under anhydrous conditions. After Thompson (1972). Carnegie Inst. Wash Yb. 71
Mg pyroxene Mg-Ca pyroxene Discontinuous Series Calcic plagioclase Calci-alkalic plagioclase alkali-calcic plagioclase amphibole alkalic plagioclase biotite potash feldspar muscovite quartz Continuous Series Temperature olivine (Spinel) Bowen’s Reaction Series
The Effect of Pressure P 2 Solid Liquid P 1 T 2 Temperature
Eutectic system Figure 7 -16. Effect of lithostatic pressure on the liquidus and eutectic composition in the diopsideanorthite system. 1 GPa data from Presnall et al. (1978). Contr. Min. Pet. , 66, 203 -220.
The Effect of Water on Melting Dry melting: solid ® liquid Add water- water enters the melt Reaction becomes: solid + water = liq(aq) Figure 7 -19. The effect of H 2 O saturation on the melting of albite, from the experiments by Burnham and Davis (1974). A J Sci 274, 902940. The “dry” melting curve is from Boyd and England (1963). JGR 68, 311 -323.
Figure 7 -20. Experimentally determined melting intervals of gabbro under H 2 O-free (“dry”), and H 2 O-saturated conditions. After Lambert and Wyllie (1972). J. Geol. , 80, 693 -708.
Dry and water-saturated solidi for some common rock types The more mafic the rock the higher the melting point All solidi are greatly lowered by water Figure 7 -21. H 2 O-saturated (solid) and H 2 O-free (dashed) solidi (beginning of melting) for granodiorite (Robertson and Wyllie, 1971), gabbro (Lambert and Wyllie, 1972) and peridotite (H 2 O -saturated: Kushiro et al. , 1968; dry: Ito and Kennedy, 1967).
We know the behavior of water-free and water-saturated melting by experiments, which are easy to control by performing them in dry and wet sealed vessles What about real rocks? Some may be dry, some saturated, but most are more likely to be in between these extremes • a fixed water content < saturation levels • a fixed water activity
The Albite-Water System Red curves = melting for a fixed mol % water in m the melt (Xw) Blue curves tell the water content of a watersaturated melt Figure 7 -22. From Burnham and Davis (1974). A J Sci. , 274, 902 -940.
Raise a melt with a ratio of albite: water = 1: 1 melt (Xwater = 0. 5) from point a at 925 o. C and 1 GPa pressure, toward the Earth’s surface under isothermal conditions. Figure 7 -22. From Burnham and Davis (1974). A J Sci. , 274, 902 -940.
Conclusions: A rising magma with a fixed % water will progressively melt At shallower levels it will become saturated, and expel water into its surroundings Figure 7 -22. From Burnham and Davis (1974). A J Sci. , 274, 902 -940.
Another example: isobaric heating of albite with 10 mol % water at 0. 6 GPa. Figure 7 -22. From Burnham and Davis (1974). A J Sci. , 274, 902 -940.
15% Conclusion: Although the addition of water can drastically reduce the melting point of rocks, the amount of melt produced at the lower temperature may be quite limited, depending on the amount of water available Figure 7 -22. From Burnham and Davis (1974). A J Sci. , 274, 902 -940. 20% 50% 100%
Melting of Albite with a fixed activity of H 2 O Fluid may be a CO 2 -H 2 O mixture with Pf = PTotal Figure 7 -23. From Burnham and Davis (1974). A J Sci. , 274, 902 -940.
Melting of Albite with a fixed activity of H 2 O Fluid may be a CO 2 -H 2 O mixture with Pf = PTotal Figure 7 -26. From Millhollen et al. (1974). J. Geol. , 82, 575 -587.
The solubility of water in a melt depends on the structure of the melt (which reflects the structure of the mineralogical equivalent) Figure 7 -25. The effect of H 2 O on the diopside-anorthite liquidus. Dry and 1 atm from Figure 7 -16, PH 2 O = Ptotal curve for 1 GPa from Yoder (1965). CIW Yb 64.
Effect of Pressure, Water, and CO 2 on the position of the eutectic in the basalt system Increased pressure moves the ternary eutectic (first melt) from silica-saturated to highly undersat. alkaline basalts Water moves the (2 GPa) eutectic toward higher silica, while CO 2 moves it to more alkaline types Ne Ne Volatile-free 3 GPa P = 2 GPa 2 GPa dry 1 GPa Highly undesaturated (nepheline-bearing) alkali olivine basalts d ate lts r u a at s erstic ba d Unoleii th Fo En CO 2 Ab Highly undesaturated (nepheline-bearing) alkali olivine basalts 1 atm ted ts a r atu basal s r de ic Unoleiit th Oversaturated (quartz-bearing) tholeiitic basalts Si. O 2 Fo En H 2 O Ab Oversaturated (quartz-bearing) tholeiitic basalts Si. O 2