Eutectic and Peritectic Systems Winter Chapter 6 Eutectic


 with a compositon of pure")

 Therefore, F = 2")


, Amer. J.")


- Slides: 23
Eutectic and Peritectic Systems Winter, Chapter 6
Eutectic Systems Example: Diopside - Anorthite No solid solution Isobaric T-X phase diagram at atmospheric pressure. After Bowen (1915), Amer. J. Sci. 40, 161 -185.
Cooling from composition a: bulk composition = An 70
First crystal forms at 1455 o. C (point b) with a compositon of pure An
• Cooling continues as Xliq varies along the liquidus • Continuous reaction: liq. A ® anorthite + liq. B
At 1274 o. C f = 3 (three phases co-exist) Therefore, F = 2 - 3 + 1 = 0 This is an invariant point – (P) T and the composition of all phases is fixed – Must remain at 1274 o. C as a discontinuous reaction proceeds until a phase is lost
A discontinuous reaction occurs at d Temperature remains constant at 1274 – Use geometry to determine liquid crystal ratios
Left of the eutectic there is a similar relationship
• The melt crystallizes over a T range up to ~280 o. C • A sequence of minerals forms over this interval - And the number of minerals increases as T drops • The minerals that crystallize depend upon T - The sequence changes with the bulk composition
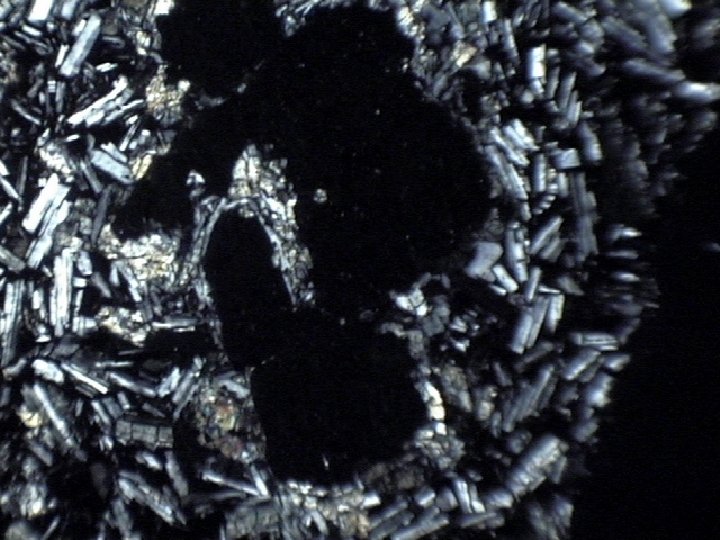
Augite Forms Before Plagioclase Gabbro of the Stillwater Complex, Montana This forms on the left side of the eutectic
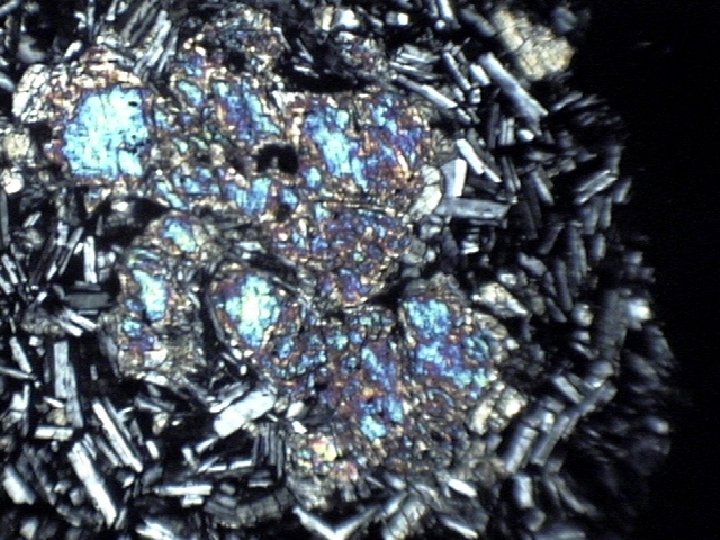
Plagioclase Forms Before Augite Ophitic texture Diabase dike This forms on the right side of the eutectic
• The last melt to crystallize in any binary eutectic mixture is the eutectic composition • Equilibrium melting is the opposite of equilibrium crystallization • Thus the first melt of any mixture of Di and An must be the eutectic composition as well
Fractional Crystallization Isobaric T-X phase diagram at atmospheric pressure. After Bowen (1915), Amer. J. Sci. 40, 161 -185.
Partial Melting:
Binary Peritectic Systems Three phases involved: enstatite = forsterite + Si. O 2 Figure 6 -12. Isobaric T -X phase diagram of the system Fo-Silica at 0. 1 MPa. After Bowen and Anderson (1914) and Grieg (1927). Amer. J. Sci.
Binary Peritectic Systems Figure 6 -12. Isobaric TX phase diagram of the system Fo-Silica at 0. 1 MPa. After Bowen and Anderson (1914) and Grieg (1927). Amer. J. Sci.
Figure 6 -12. Isobaric T-X phase diagram of the system Fo-Silica at 0. 1 MPa. After Bowen and Anderson (1914) and Grieg (1927). Amer. J. Sci.
i = “peritectic” point At 1557 o. C there is colinear equilibrium of Fo-En-liq F geometry indicates a reaction: Fo + liq = En F consumes olivine (and liquid) ® resorbed textures When is the reaction finished? 1557 im k d Fo Bulk X En c
y x i m k 1557 1543 d c bulk X Fo En Cr
Incongruent Melting of Enstatite F Melt of En does not produce a melt of same composition F Rather En goes to Fo + Liq i at the peritectic Partial Melting of Fo + En (harzburgite) mantle F En + Fo also ® firsl liq = i F Remove i and cool i F Result = ? 1557 d 1543 c bulk X Fo En Cr
Consequence For Basalt Magma The Fo-En-Q system causes compositions to migrate from alkali basalt toward tholeiite as the degree of crystallication or melting progresses