Atlantic Slop Consortium AllHands Meeting Harpers Ferry WV


 in HUC 14 watershed")


 in a 14 -digit")
 and")

 of Intensity Surface Hotspot zones at level g (Connected Components")


")


 specs except")


")

 e a b")


 typically")

")


. n Echelon analysis. n In")

. n Statistical selection")


. n Modeling and interpreting the accuracy")

. n Classified raster map analysis for sustainable environment and development")

. n Doubly")
. n Geographic and network surveillance via")

. n Upper level set scan statistic")
. n Overview: Landscape Health Assessment (2003). n In Managing for")
. n Statistical ecology and environmental statistics. n In Encyclopedia of")
. n Editorial: Special institutional thematic issue: Center for Statistical Ecology")
. n Multiple indicators, partially ordered sets,")


- Slides: 147
Atlantic Slop Consortium: All-Hands Meeting Harpers Ferry, WV 15 -17 September 2004 Analytical Needs What is Available What is Needed G. P. Patil
Overall Goals and Objectives Barbara Levinson International Journal of Remote Sensing Special Issue on Remote Sensing and GIS for Ecosystem Analysis n n n EPA ORD Ecosystem Protection Program Provide scientific understanding to measure, model, maintain, and/or restore, at multiple scales, the integrity and sustainability of highly valued ecosystems, now and in the future EPA STAR Ea. GLe Program Develop new widely applicable indicators of integrity and sustainability for specific ecological entities and then test their applicability across regions Incorporation of these indicators into long-term monitoring programs is the desired outcome.
Barbara Levinson – Continued n n Develop indicators/ procedures useful for evaluating the health/condition for important coastal natural resources, e. g. , lakes, streams, coastal wetlands, etc. Develop indicators, indices, procedures for evaluating the integrated condition of multiple resources/ ecosystem types, e. g. , bird community index reflecting the combined terrestrial and aquatic community within a watershed Develop landscape measures that characterize landscape attributes and serve as quantitative indicators of a range of environmental endpoints, such as, water quality or watershed quality. Develop nested suites of indicators that can both quantify the health/ condition of a resource and identify its primary stressors across a range of scales
Atlantic Slope Consortium: A Vision Statement Robert Brooks and Denice Wardrop n Using a universe of watersheds, covering a range of social choices, we ask two questions: · · n How “good” can the environment be, given those social choices? What is the intellectual model of condition within those choices, i. e. , what are the causes of condition and what are the steps for improvement? Accomplish with the group dynamics spirit of : form, storm, reform, norm, perform, and inform (Kent Thornton).
Ecohealth Special Issue On Wetland Indicators Guest Editors: Rob Brooks and G. P. Patil -A Vision For The Special Issuen n n Investigators developing and testing ecological indicators on the condition of coastal or inland wetlands are invited to submit original manuscripts. Papers fostering the integration of condition assessments across various types of aquatic habitats or “waters”, and addressing biological, chemical, and physical dimensions, are encouraged. With this issue, we wish to demonstrate the next generation of ecological indicators is ready for use in wetlands and related habitats. This issue will make a significant contribution to the literature. Final date for receipt of manuscripts-Sep 30 2004 -peer review and editing Oct-Dec 2004, publication in 2005.
What’s the question? n How do we develop a useful, relevant, and defensible set of indicators for the Atlantic Slope? We know how to do “defensible” n This story is all about combining defensible ecology with “relevant” and “useful” in the Atlantic Slope n Tools: watershed and estuarine segment classification for experimental design and identification of critical areas n
Use of Landscape and Land Use Parameters for Classification and Characterization of Watersheds in the Mid-Atlantic across Five Physiographic Provinces
Resulting Process Define Watershed Types Compile Frequency Distributions Designate Sampling Design Distribute Candidate Watersheds
Ternary Plot Description n Require a fuller description of departure from reference than “disturbed” Describes land use via the three main land cover types Can be used at any spatial extent (as can land cover %)
Ternary plots of watersheds of Atlantic Slope by physiographic province.
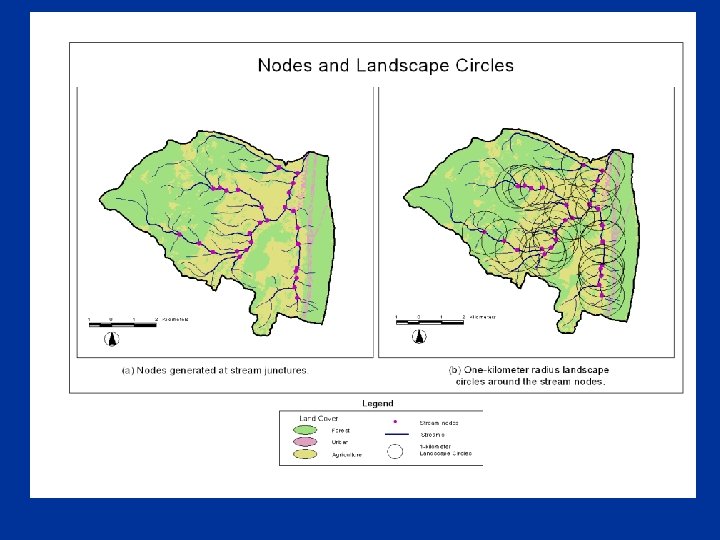
The Concept of Nodes A circle with landscape properties attributable to a point n Where? At stream convergences n Incorporates description of stream complexity n More circles in areas of complex drainage n
Nodal Constellations and Variance Many ways to be a “moderately” disturbed watershed n Addresses disparity of land covers within a watershed; effective distances may be different n Scaling issues can be explored at a future date n
Median Slope n n n Rough indicator of connection between land use and aquatic resources Surrogate for ability to produce stress; e. g. , steep slopes have more rapid runoff, minimal contact time for remediation and/or impact Forested watersheds occur on both steep and low slopes, changing amount of stress produced, as well as susceptibility to regional stressors (e. g. , atmospheric deposition)
Factors for Classifying Watersheds % Land use (forested, agricultural, urban) in HUC 14 watershed n % Land use (forested, agricultural, urban) in 1 km radius node n Nodal variance n Median slope n
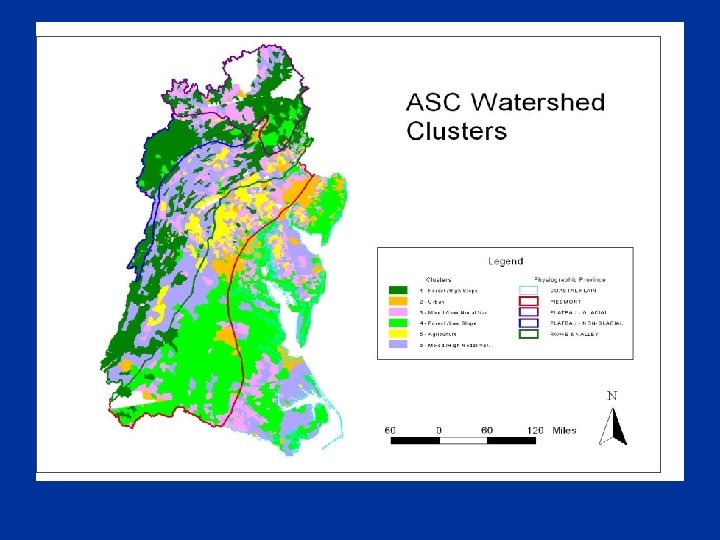
High Forest High Slope Low Forest, High Ag Moderate Forest Low Slope High Urban Low Slope Moderate Ag Moderate Slope High Nodal Var Low Nodal Var
Results Six watershed classes identified: 1. Forested, high slope 2. Forested, low slope 3. Agricultural 4. Urban 5. Mixed, low nodal variance 6. Mixed, high nodal variance
Lessons Learned n Be true to the project vision statement! n Future lines of investigation: n How do we articulate historical paths on ternary plots? n Are mixed land cover watersheds with high nodal variance indicative of a lack of planning efforts?
Current Status Watershed classification provided a “social choice” basis for project design, and was informative n Can we represent historic land use? n How do we relate ecological condition (process) to landscapes (pattern) at different spatial scales? n
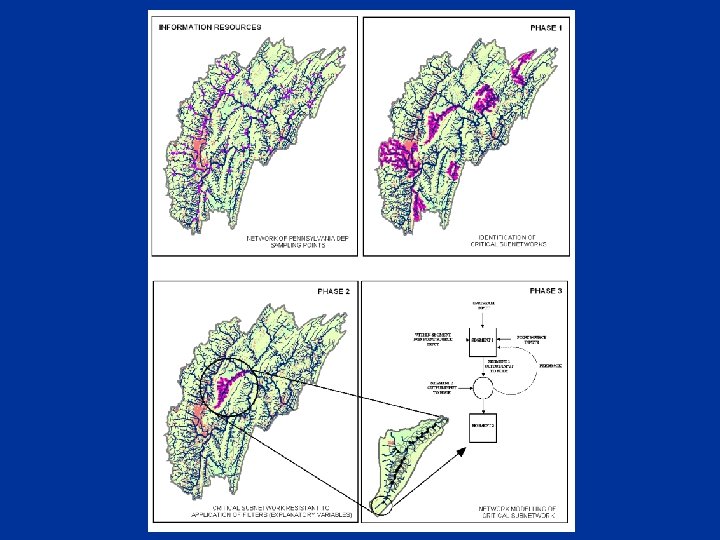
Critical area identification Ordinal map of entire project area is overwhelming n Identification of statistically-significant critical areas is needed n Explanatory factors can be applied n Target “non-resolvable” hot-spots for further investigation n
The Spatial Scan Statistic n Move a circular window across the map. n Use a variable circle radius, from zero up to a maximum where 50 percent of the population is included.
A small sample of the circles used
Spatial Temporal Surveillance
Space-Time Poverty Hotspot Typology n Federal Anti-Poverty Programs have had little success in eradicating pockets of persistent poverty n Can spatial-temporal patterns of poverty hotspots provide clues to the causes of poverty and lead to improved location-specific anti-poverty policy ?
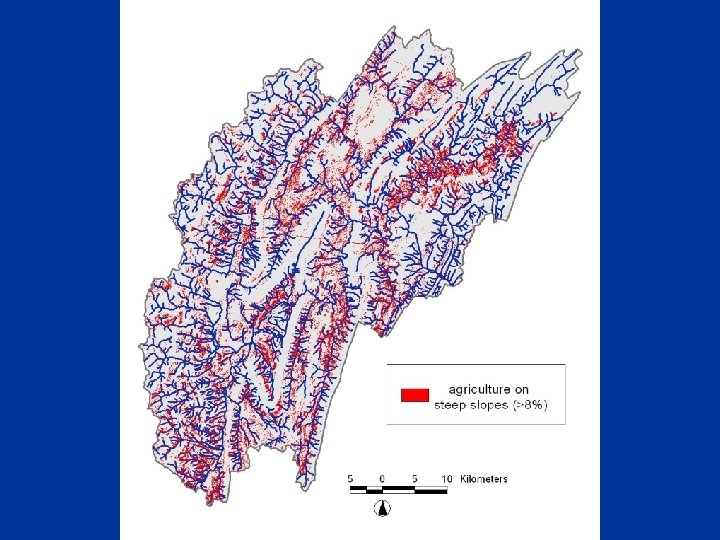
Hotspot determination Percent of pixels (30 m x 30 m) in a 14 -digit HUC that are both disturbed (<85% forested) and on a high slope (>3%) n Percent of nodes that have less than 45% forested land cover n
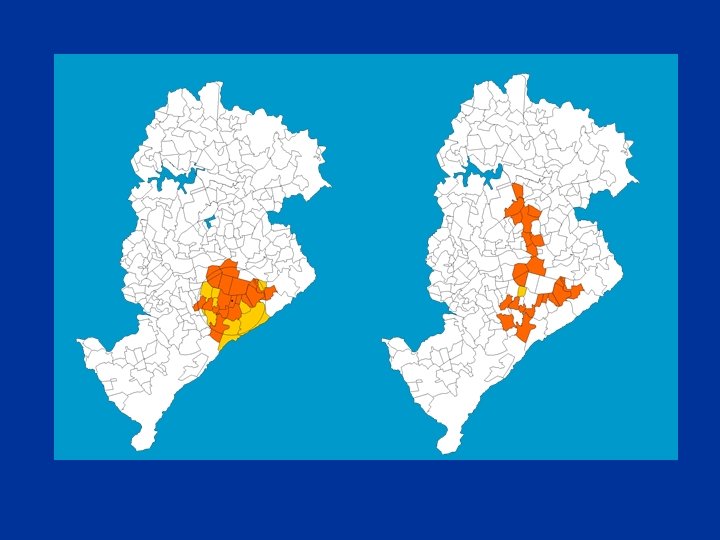
The most likely cluster as found by the circular spatial scan statistic (left) and the elliptic spatial scan statistic (right) for an analysis of county-based breast cancer mortality in Northeastern United States, 1988– 1992. For the circular-detected cluster, the relative risk is 1. 07 and p=0. 0001 (Kulldorff et al, 1997), while the elliptic-detected cluster has a relative risk of 1. 08 and p=0. 0001. Note that the elliptic-detected cluster is not connected, since the New York City area is not part of the cluster.
Circular spatial scan statistic zonation.
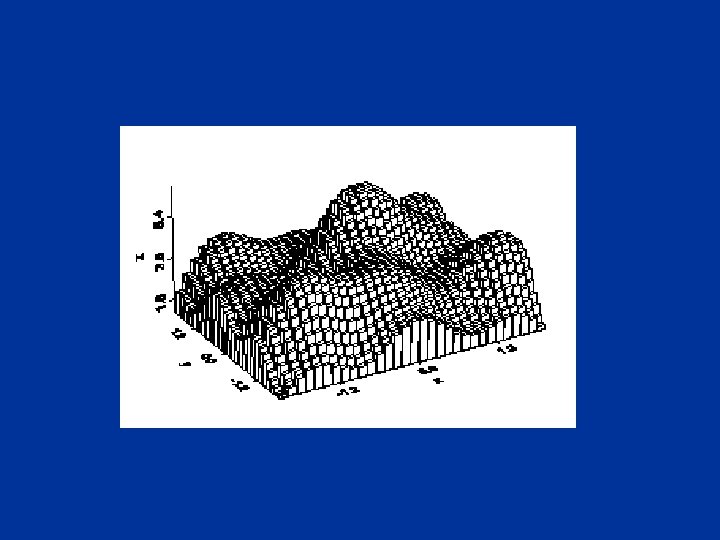
Upper Level Set (ULS) of Intensity Surface Hotspot zones at level g (Connected Components of upper level set)
Changing Connectivity of ULS as Level Drops
ULS Connectivity Tree Schematic intensity “surface” A B C N. B. Intensity surface is cellular (piece-wise constant), with only finitely many levels A, B, C are junction nodes where multiple zones coalesce into a single zone
Estimation Uncertainty in Hotspot Delineation MLE Outer envelope Inner envelope
LR Confidence Intervals Disconnected CI CI at threshold t
Confidence Region on ULS Tree Tessellated Region R MLE Junction Node Alternative Hotspot Delineation Alternative Hotspot Locus Nodes in Confidence Set Extremity Node
Hotspot Detection, Delineation, Prioritization Continuous Responses n n Both human health and environmental contexts Simplest distributional model: n Additivity with respect to the index parameter k suggests that we model k as proportional to size: n Other distribution models (e. g. , lognormal) are possible but are computationally complex and applicable to only a single spatial scale
Hotspot Detection, Delineation, Prioritization Examples of Continuous Responses n Human Health Context: Ø Ø Ø • Blood pressure levels for spatial variation in hypertension Estrodial levels in women for breast cancer and osteoporosis Cancer survival (censoring issues) Environmental Context: Ø Landscape metrics such as forest cover, fragmentation, etc. Ø Pollutant loadings Ø Animal abundance
Covariate Adjustment Known Covariate Effects (age, population size, etc. )
Covariate Adjustment Given Covariates, Unknown Effects
Incorporating Spatial Autocorrelation Ignoring autocorrelation typically results in: § under-assessment of variability § over-assessment of significance (H 0 rejected too frequently) How can we account for possible autocorrelation? GLMM (SAR) Model Ya = count in cell a Ya distributed as Poisson a = log(E[Ya]) The Ya are conditionally independent given the a The a are jointly Gaussian with a Simultaneous Auto. Regressive (SAR) specification
Incorporating Spatial Autocorrelation
Incorporating Spatial Autocorrelation
Spatial Autocorrelation Plus Covariates
CAR Model The entire formulation is similar for Conditional Auto. Regressive (CAR) specs except that the form of the variance-covariance matrix of is changes.
Salford Systems v. Robust Decision-Tree Tools n. CART Decision Tree Software n. MARS Predictive Modeling Software n. Tree. Net Stochastic Gradient Boosting Software n. LOGIT Software n. Random. Forests v. Application, Adaptation and Development n. Invasive Species Phragmites and Thresholds
Terra. Seer Software Space-time Intelligence Systems GIS Enhancement n Cluster. Seer, Boundary. Seer n Geo. Seer, Socio. Economics n Wombling and Thresholds Identification n
Ecosystem State Stress F 2 F 1 Stress Ecosystem State Stress F 2 Stress Schematic representation of four possible responses of ecosystems to stress. Reproduced from Panarchy, 2002, Island Press.
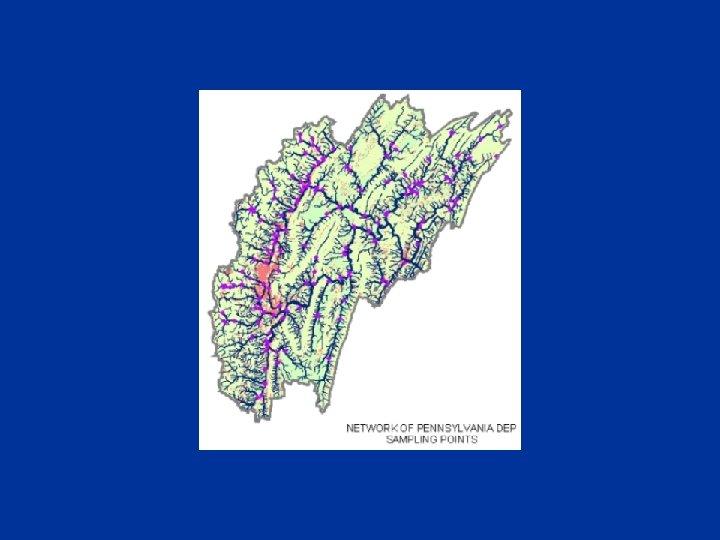
Application of the Scan Statistic to Wetland Stream Monitoring: Testing the Method in the Upper Juniata Watershed, Pennsylvania, USA
This presentation will. . Provide background on the resource to be monitored (wetland condition and restoration) n Provide a description of the data set (the Upper Juniata watershed) n Illustrate how the scan statistic was applied n Recommend future enhancements of the scan statistic for environmental problem solving (surveillance and early warning) n
The Environmental Problem
ds ds wate n a etl eep r Upland n pla u d an W he d nt e etw e al b n io it s ran T Deep Water ~ Lakes & Streams Source: Tiner
Questions in Monitoring and Management n n n How do we find the wetlands/streams? (Inventory) How do we assess their ability to function? (Condition) How do we use this information to improve condition? (Restoration) Inventory Condition Restoration
How do we measure “condition”? n Coeffficients of conservatism n n n Measure of specificity of habitat requirements Scale of 0 to 10 Non-natives, aggressives receive 0 Species with very specific requirements receive 10 Entire flora is given Co. Cs; Co. Cs are summed to provide the Floristic Quality Assessment Index (FQAI) High FQAI represents a diverse plant community with specific habitat requirements (intolerant of disturbance)
Necessary Context Wetlands are a valuable ecological resource n We are interested in their condition n One way in which we assess condition is by the plant community n We seek to relate land cover characteristics to wetland condition (e. g. , plant community) n Since we cannot identify hotspots of condition, can we identify hotspots of stress? n
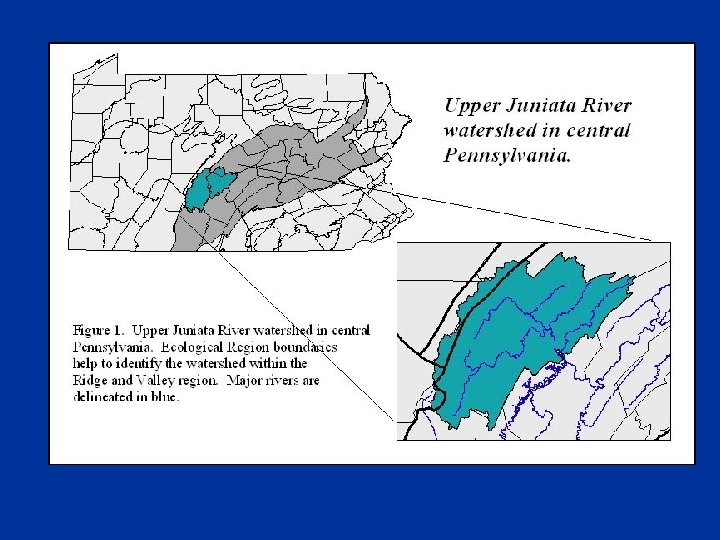
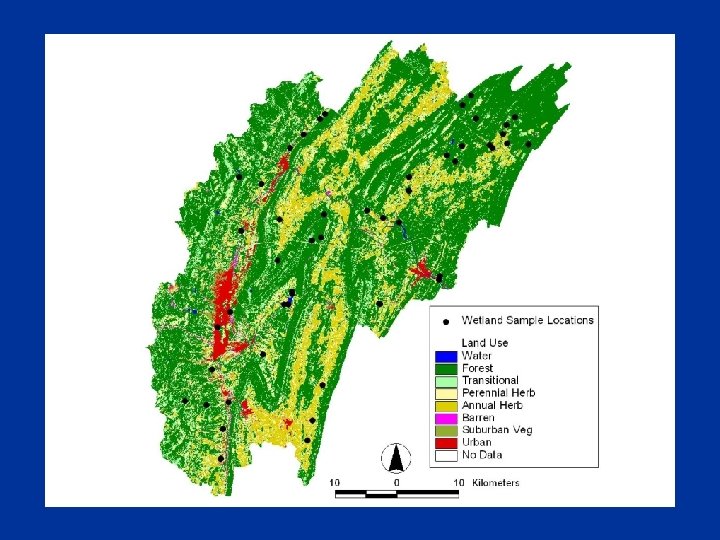
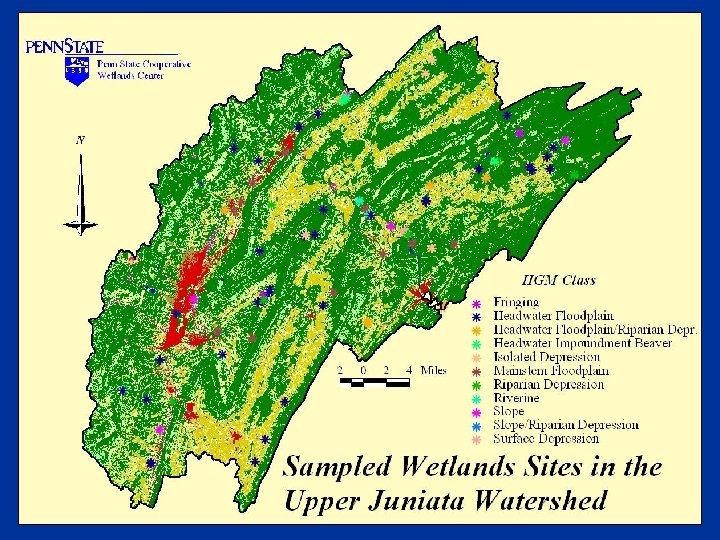
The Upper Juniata Wetlands Monitoring Project n n One of three watersheds of the Juniata River watershed (3900 sq. miles), which is the second largest tributary to the Susquehanna R. , in turn the largest tributary to the Chesapeake Bay Juniata watershed is 67% forested, 23% agriculture, 7% developed, plus mining, water, etc. Upper Juniata is 1300 sq. miles 83 wetlands sampled according to a probabilistic survey design (USEPA-EMAP)
Why use the Scan Statistic? Identify critical areas of “stress” as an indicator of wetlands in potentially poor condition (condition assessment) n Target restoration areas (restoration) n Narrow down an overwhelming management problem (1300 square miles) into a manageable one n
Which factors are good predictors of condition? Exhaustive assessment of landscape factors shows that agricultural activity on steep slopes (>8%) is an important factor in determining physical and biological condition n Management of practices on steep agricultural lands is feasible, and current restoration programs have targeted these areas (USDA) n
Application of the Scan Statistic
Necessary Elements of the Scan Statistic Observed rate versus expected rate n Contiguous coverage of elements n Spatial independence n Constraint on maximum hotspot size n
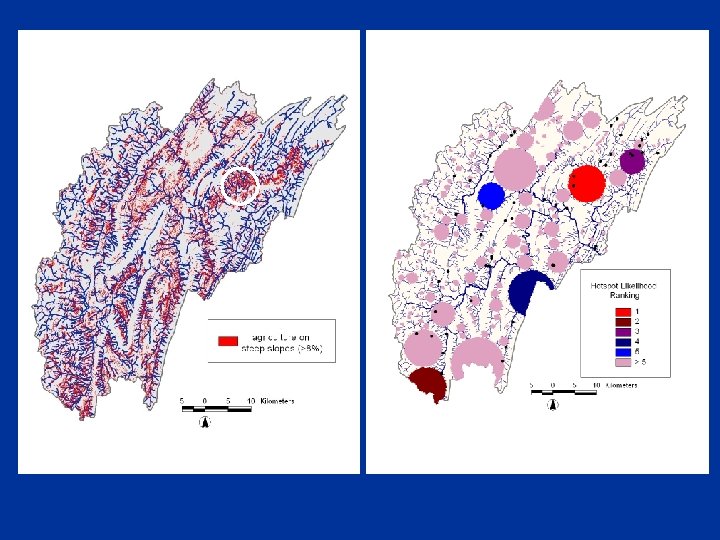
2% Threshold: Map of hot spots with a p<0. 05 and >2 blocks in the hot spot showing top five hotspots ranked by likelihood
3% Threshold, Hotspot #2 >35 Out Hotspot In Hotspot <35 17. 00 25. 00 2. 00 11. 00
Explanatory Factors
Potential advantages of critical areas as an indicator of stress n n n Delineation of contributing areas is labor intensive Can critical areas give us a first cut as to wetlands in poor condition? Can they serve as an early warning?
Are wetlands associated with Ag on HS threshold in poorer condition than those that are not? Ag on High Slope <15% Ag on HS >15% Ag on HS High FQAI Low FQAI 18 23 1 13
Are wetlands associated with hotspots in poorer condition than those that are not? 10% Size Constraint Not Associated with Hotspot High FQAI Low FQAI 16 21 3 15
Are wetlands associated with hotspots in poorer condition than those that are not? 3% Size Constraint Not Associated with Hotspot High FQAI Low FQAI 17 25 2 11
Does Sa. TScan improve explanatory power?
Did Sa. TScan “concentrate” agriculture on high slopes?
Restoration Targeting
Why on a watershed basis? Watersheds are more efficient unit financially, socially, ecologically n Accounting Unit (AU) for Integrated 303(d)/305(b) Reporting n Conceptually attractive for local managers n
Restoration Targeting with Sa. TScan Can effectively target areas for restoration activities or best management practices n Can be scaled so that critical area matches management area n
Conclusions
Agricultural Use Sedimentation Turbidity Plant Community Amphibian Comm. Bird Community Urbanization Eutrophication Macroinvertebrates Are there warnings? Pollutant Trans. Hydroperiod Hydrologic Modif. Mining Organic Matter Fragmentation Soil Acidification Microtopography
Conclusions n n When using Sa. TScan, assess appropriateness of circular critical areas and size constraints Can be used for condition assessment Highly useful for restoration targeting Use of scan statistic methods in an ecological context raises three future needs: n n n Non-circular critical areas Ability to include spatial dependency (e. g. , critical areas of condition, infectious disease) Continuous response variable (e. g. , fertilizer loadings, livestock density)
Multiple Indicators Partial Orderings and Ranking and Prioritization without Combining Indicators
Multiple Indicators Two indicators of a person’s size: Scatter Plot: Weight I 1 = Height I 2 = Weight A B Height Is A bigger than B ?
Combining Indicators Simple Average I 1 = Height I 2 = Weight Size = (I 1 + I 2)/2 Bigger than A A Contour of constant size Smaller than A Height
Combining Indicators Weighted Average I 1 = Height I 2 = Weight Size = w 1 I 1 + w 2 I 2 , w 1 + w 2 = 1 w 1 and w 2 reflect: Units of measurement n Relative importance of the two indicators Weight n Slope determines tradeoff between Height and Weight A Contour of constant size Height
Combining Indicators Non-Linear Combination I 1 = Height I 2 = Weight Size = F(I 1 , I 2) Tradeoff varies A Contour of constant size Height
Partial Ordering I 1 = Height Weight I 2 = Weight Not comparable with A Bigger than A A Smaller than A Not comparable with A Height
UNEP HEI National Land, Air, Water Indicators HEI with revised data: n Land: undomesticated land to total land area n Air: (air indicator 1 + air indicator 2) / 2, where air indicator 1 = renewable energy use to total energy use; air indicator 2 = GDP per unit energy use, based on maximum and minimum concept n Water: (water indicator 1 + water indicator 2) / 2, where water indicator 1 = ratio of water available after annual withdrawals to internal water resources; water indicator 2 = ratio of people with access to an improved water source to total population
UNEP HEI Data Matrix
Hasse Diagram---All Countries (labels are HEI ranks)
Hasse Diagram --- Western Europe
Ranking Partially Ordered Sets Linear extension decision tree Poset (Hasse Diagram) e a b c d c e f Jump Size: b a 1 b b b e d d e f f f 3 3 d c d e f d d e c f d a e f d e d f e d a c c f e f e f e 2 3 5 4 3 3 2 4 3 4 4 2 2
Ranking Partially Ordered Sets Rank. Frequency Distributions Element a Element b Element c Element d Element e Element f Rank
Ranking Partially Ordered Sets 16 The curves are stacked one above the other and the result is a linear ordering of the elements: a > b > c > d > e > f
Cumulative Rank Frequency Operator – 1 An example where must be iterated Original Poset (Hasse Diagram) f a b c e g h d g 2 a a f f e e b b ad ad c g h c h
More Indicators do not necessarily mean More Information and More Discrimination n n Suppose two indicator columns are exactly the same. The second column does not add new information or discriminatory capability to that of the first column. Likewise, there is little new information when there is a strong underlying (rank-)correlation between the two indicators. Landscape ecologists have discovered that some fifty landscape pattern metrics amount to essentially five to ten indicators.
Multiple Indicators can convey Redundant Information Combining Indicators (e. g. , by averaging) typically fails to adjust for the Redundancy
Frontier/ Envelope Target (Virtual)
Urban Mixed Forest Agriculture
QOL Relative Efficiency Planning History Relative Efficiency
Off-Farm Employment Relative Efficiency
Integration for ASC and the EAGLES —G. P. Patil— My participation has to do with data analysis, interpretation, and improvement, in the spirit of space age analysis of space age data. We need to appropriately develop, adapt, apply inferential geospatial informatics. We do not need to feel drowned in statistics, nor drowned without statistics. We do not need statistics to just sprinkle holy water, but to help water become holy! We face many important nonstandard problems, and several of them need nonstandard concepts, methods, and tools.
Environmental and Ecological Statistics Volume 12 Number 2 2005 Special Institutional Thematic Issue: Penn State Cross-Disciplinary Classroom in Statistical Ecology and Environmental Statistics Editorial PATIL, G. P. Editorial: Special Institutional Thematic Issue: Penn State Cross-Disciplinary Classroom in Statistical Ecology and Environmental Statistics Papers RATHBUN, S. , and BLACK, B. Modeling and Spatial Prediction of Pre-Settlement Patterns of Forest Distribution Using Witness Tree Data RATHBUN, S. , and FEI, S. . A Spatial Zero-Inflated Poisson Regression Model for Oak Regeneration MYERS, W. L. , KURIHARA, K. , PATIL, G. P. , and VRANEY, R. Finding Upper-Level Sets in Cellular Surface Data Using Echelons and Sa. TScan MYERS, W. L. , et a Mid. Atlantic Watersheds Classification and Prioritization for Protection and Restoration WARDROP, D. H. , BISHOP, J. A. , EASTERLING, M. , HYCHKA, K. , MYERS, W. L. , PATIL, G. P. , TAILLIE, C. , and BROOKS, R. P. Characterization and classification of watersheds by landscape and land use parameters in five mid-Atlantic physiographic provinces. WARDROP, D. , MYERS, W. L. , PATIL, G. P. , and TAILLIE Coupling Biological Impairment of Freshwater Streams and Human Dimensions
Environmetal and Ecological Statistics EPA Ea. GLes Special Issue Guest Editors --Invited Papers n --To Be Invited n --Suggestions Invited n
ASC ANALYTICAL NEEDS AND SYNERGIES Indicators and Data Analytical Exercises n Concepts, Methods, Tools, Softwares n Data Analyses and Interpretations n Publishable Manuscripts Involving Substantive and/or Quantitative Innovations n Work plan n
Myers, W. L. , Bishop, J. , Brooks, R. , and Patil, G. P. (2001). n Composite spatial indexing of regional habitat importance. n Community Ecology, 2(2), 213— 220. n
Myers, W. L. , and Patil, G. P. (2002). n Echelon analysis. n In Encyclopedia of Environmetrics, Volume 2. n A. El-Shaarawi and W. W. Piegorsch, eds. John Wiley & Sons, UK. pp. 583— 586. n
n n n Johnson, G. D. , Myers, W. L. Patil, G. P. , O’Connell, T. J. , and Brooks, R. P. (2001). Predictability of bird community-based ecological integrity using landscape measurements. In Cartografia Multiscalare della Natura, O. Rossi, ed. , IX Congresso Nazaionale Della Societa Italiana di Ecologica, September 1999. pp. 79— 104. Also appears in Managing for Healthy Ecosystems, D. Rapport, W. Lasley, D. Rolston, O. Nielsen, C. Qualset, and A. Damania, eds. CRC Press/Lewis Publ. pp. 617— 637 (2003).
Grossi, L. , Patil, G. P. , and Taillie, C. (2004). n Statistical selection of perimeter-area models for patch mosaics in multiscale landscape analysis. n Environmental and Ecological Statistics, 11, 165 -181. n
Johnson, G. D. , Myers, W. L. , Patil, G. P. , and Taillie, C. (2001). n Predictability of surface water pollution loading in Pennsylvania using watershed-based landscape measurements. n Journal of the American Water Resources Association, 37(4), 821— 835. n
Patil, G. P. , Brooks, R. P. , Myers, W. L. , and Taillie, C. (2003). n Multiscale advanced raster map analysis system for measuring ecosystem health at landscape scale—A novel synergistic consortium initiative. n In Managing for Healthy Ecosystems, n D. Rapport, W. Lasley, D. Rolston, O. Nielsen, C. Qualset, and A. Damania, eds. n CRC Press/Lewis Publ. pp. 567 -576. n
Patil, G. P. , Brooks, R. P. , Myers, W. L. , Rapport, D. J. , and Taillie, C. (2001). n Ecosystem health and its measurement at landscape scale: Towards the next generation of quantitative assessments. n Ecosystem Health, 7(4), 307 -316. n
Patil, G. P. , Bishop, J. , Myers, W. L. , Taillie, C. , Vraney, R. , and Wardrop, D. H. (2004). n Detection and delineation of critical areas using echelons and spatial scan statistics with synoptic cellular data. n Environmental and Ecological Statistics, 11(2), 139 -164. n
Patil, G. P. , and Taillie, C. (2003). n Modeling and interpreting the accuracy assessment error matrix for a doubly classified map. n Environmental and Ecological Statistics, 10(3), 357 -373. n
Patil, G. P. n Multiscale advanced raster map analysis system: Definition, design, and development. n In Novos Rumos em Estatistica, n L. Carvalho, F. Brilhante, and F. Rosado, eds. n Sociedade Portuguesa de Estatistica, pp. 21 -54. n
Patil, G. P. (2003). n Classified raster map analysis for sustainable environment and development in the 21 st Century. n In Sustainable Environments: A Statistical Analysis n A. K. Ghosh, J. K. Ghosh and B. Mukhopadhyay, eds. n Oxford University Press, New Delhi. Pp. 148174. n
Myers, W. L. , Patil, G. P. , Taillie, C. , and Wardrop, D. (2003). n Synoptic environmental indicators as image analogs for landscape analysis. n Community Ecology, 4(2), 205 -217. n
Myers, W. L. , Patil, G. P. , and Taillie, C. (2003). n Doubly segmented proxy images for multiscale landscape ecology and ecosystem health. n Community Ecology, 4(2), 163 -183. n
Patil, G. P. , and Taillie, C. (2003). n Geographic and network surveillance via scan statistics for critical area detection. n Statistical Science, 18(4), 457 -465. n
Patil, G. P. , Balbus, J. , Biging, G. , Ja. Ja, J. , Myers, W. L. , and Taillie, C. (2004). n Multiscale advanced raster map analysis system: Definition, design and development. n Environmental and Ecological Statistics, 113 -138. n
Patil, G. P. , and Taillie, C. (2004). n Upper level set scan statistic for detecting arbitrarily shaped hotspots. n Environmental and Ecological Statistics, 11, 183 -197. n
Patil, G. P. (2003). n Overview: Landscape Health Assessment (2003). n In Managing for Healthy Ecosystems, n D. Rapport, W. Lasley, D. Rolston, O. Nielsen, C. Qualset, and A. Damania, eds. n CRC Press/Lewis Publ. pp. 559 -565. n
Patil, G. P. (2003). n Statistical ecology and environmental statistics. n In Encyclopedia of Life Support Systems, n EOLSS Publishers Co. , Ltd. n Jeff Wood, ed. n
Patil, G. P. (2004). n Editorial: Special institutional thematic issue: Center for Statistical Ecology and Environmental Statistics. n Environmental and Ecological Statistics, 11, 109 -112. n
Patil, G. P. , and Taillie, C. (2004). n Multiple indicators, partially ordered sets, and linear extensions: Multi-criterion ranking and prioritization. n Environmental and Ecological Statistics, 11, 183 -197. n
Member, n NSF Peer Review Panel for ‘Homeland Security and Geographic Information Systems’ n February, 2004 n
Member, n NSF Peer Review Panel for ‘New Mathematical and Statistical Tools for Understanding Complex Systems in the Environment (MSPA-CSE)’ n June, 2004 n
Member, EPA Science Advisory Board, Regional Vulnerability Assessment Panel, for ‘EPA’s Regional Vulnerability Assessment Methods for Multi-Scale Decision-Making’ n October, 2004 n Invited n
Invited Speaker, n ‘Detection and Delineation of Critical Areas for Assessment and Management at Landscape Scales using Cellular Synoptic Data, ’ n International Society for Ecosystem Health Conference on Linkages Between Biodiversity, Ecosystem Health, and Human Health, n Washington, DC, June 2002. n
Invited Speaker, n ‘Detection and Delineation of Critical Areas for Assessment and Management at Landscape Scales using Cellular Synoptic Data, ’ n The International Environmetrics Society Meetings, n Genoa, Italy, June 2002. n
Invited Speaker, n ‘Prioritization and Ranking of Watersheds Based on Watershed Indicators n Without Having to Integrate Indicators for Multi-Criterion Decision Support, ’ n The International Environmetrics Society Meetings, n Genoa, Italy, June 2002. n
Invited Speaker, n ‘Geographic and Network Surveillance for Arbitrarily Shaped Hotspots: Next Generation of Potential Outbreak Detection and Prioritization System. ’ n National Syndromic Surveillance Conference, n New York City, September 2002. n
Presented paper, n ‘Multiscale Advanced Raster Map Analysis System Definition, Design, and Development. ’ n RESE Conference, n Stockholm, Sweden, November 2002. n
Invited Keynote Lecture, n “Environmental Health and a New Generation of Statistical Methods”, n MISTRA Conference on Remote Sensing for the Environment, n Government of Sweden, n Stockholm, November 2002. n
Invited Joint Inaugural Lecture with C. R. Rao, n International Conference on Environment and n Health related Quality of Life: Statistical Perspectives, n France 2002. n
Invited paper, n ‘Upper Level Set Scan Statistic for Detection Arbitrarily Shaped Hotspots, ’ Joint Statistical Meetings, n San Francisco, n August 2003. * n n *Also a session chairman.
Invited Poster Presentation, Keystone Homeland Security Summit, n University Park, n April 2003. n
Invited presentation, n ‘Biosurveillance Geoinformatics of Hotspot Detection and Prioritization for Biosecurity, ’ n Washington Statistical Society, n Washington, DC, n February 2004. n
Genoa/Washington, DC ECOSYSTEM HEALTH AND ITS MEASUREMENT AT LANDSCAPE SCALE Invited Speakers and Authors: Abstracts 1. W. L. Myers, G. P. Patil, and C. Taillie Title: Comparative Patterns of Habitat Richness and Rarity for Pennsylvania Vertebrates Keywords: Biodiversity, Habitat, Spatial Pattern, Richness, Rarity, Vertebrates, Ecosystem Health. 2. D. H. Wardrop, J. A. Bishop, M. Easterling, W. L. Myers, G. P. Patil, and C. Taillie Title: Use of Landscape and Land Use Parameters for Classification and Characterization of Watersheds in the Mid-Atlantic across Five Physiographic Provinces. Keywords: Atlantic Slope Consortium, Mid-Atlantic Region, Characterization of Watersheds, Classification of Watersheds, Environmental and Ecological Indicators, Landscape Parameters, Land Use Parameters. 3. G. P. Patil, W. L. Myers, and C. Taillie Title: Detection and Delineation of Critical Areas for Assessment and Management at Landscape Scales using Cellular Synoptic Data. Keywords: Hotspots and Hotspot Areas, Critical Areas and Corridors, Biocomplexity, Regionalized Ecosystem Health, Ecosystem Distress Syndrome, Adjacency Relations, Cellular Tesselations, Connected Components, Zonation Tree, Spatial Scan Statistics, Echelons.
SYLLABUS for PARMA SHORT COURSE Multiscale Advanced Raster Map Analysis Instruction Methods and Tools for the following: 1. Multicriteria Rankings and Fuzzy Ranks. Posets, Hasse Diagrams, and Linear Extensions. Elevated Cluster Prioritization, Environmental Factor Prioritization, Multicriteria Comparisons and Decisions. 2. Echelons and Families of Echelons. Surface Topology and Upper Level Sets. Geographic Surveillance, Elevated Cluster Detection, Change Detection and Regional Change Patterns Analysis, Multiscale Assessment, Regional Echelon Partitions, Hotspots, Critical Areas, Corridors, Outbreaks. 3. Multiscale Landscape Pattern Metrics. Scaling Domains, Multiscale Fragmentation Profiles, Eigen values as Fractals. 4. Modeling and Simulation Devices. Markov Random Fields, Multivariate Disjunctive Indicator Geostatistics, and Hierarchical Markov Transition Matrix Models. Uncertainity Analysis, Confidence Statements, Statistical Significance, Inferential Geoinformatics. 5. Userfriendly Software System for Multiscale Map and Surface Analysis, Geospatial Data Management, Data Mining, Data Analysis, Visualization and Communication. 6. Ecological Sampling, Environmental Monitoring, Observational Economy Encounter Sampling, Transect Sampling, Composite Sampling, Ranked Set Sampling, Adaptive Sampling 7. Pattern-based Image Analysis For Landscape Ecology and Ecosystem Health. MARMAP Website: http: //www. stat. psu. edu/~gpp/newpage 11. htm
JOINT STATISTICAL MEETINGS 2004 JSM Toronto, Canada Invited Session on Statistical Geoinformatic Surveillance and Security Organizer(s): Ganapati P. Patil, Pennsylvania State University Chair(s): Ganapati P. Patil, Pennsylvania State University 8: 35 AM Geographical and Network Hotspot Detection, Prioritization, and Early Warning — Charles Taillie, Pennsylvania State University; Ganapati P. Patil, Pennsylvania State University 8: 55 AM Coupling Biological Impairment of Freshwater Streams and Human Dimensions Denice Wardrop, Pennsylvania State University; Wayne Myers, Pennsylvania State University; Patil Ganapati, Pennsylvania State University; Charles Taillie, Pennsylvania State University 9: 15 AM Mid-Atlantic Watersheds Classification and Prioritization for Protection and Restoration Wayne Myers, Pennsylvania State University; Mary Mc. Kenney-Easterling, Pennsylvania State University; Kristen Hychka, Pennsylvania State University; Bronson Griscom, Canaan Valley Institute; Joseph Bishop, Pennsylvania State University; Gian Rocco, Pennsylvania State University; Robert Brooks, Pennsylvania State University; George Constantz, Canaan Valley Institute; Ganapati P. Patil, Pennsylvania State University; Charles Taillie, Pennsylvania State University 9: 35 AM Biostochastics for Remote Sensing of the Environment with Applications Bo Ranneby, Swedish University of Agricultural Sciences; J. Yu, Swedish University of Agricultural Sciences; M. Ekstrom, Swedish University of Agricultural Sciences 9: 55 AM 10: 15 AM Disc: Elizabeth M. Middleton, NASA Floor Discussion
JOINT STATISTICAL MEETINGS 2003 JSM San Francisco, CA Invited Session on Hotspot Detection, Delineation, and Prioritization for Geographic Surveillance and Early Warning System Organizer G. P. Patil, The Pennsylvania State University Director, Center for Statistical Ecology and Environmental Statistics Chair G. P. Patil, The Pennsylvania State University Invited Speakers and Presentations G. P. Patil and C. Taillie Hotspot Detection, Delineation, and Prioritization for Geographic Surveillance and Early Warning System Martin Kulldorff and Linda Pickle Elliptical Spatial and Cylindrical Spatiotemporal Scan Statistics in Geographic Surveillance Renato Assunção and Luiz Duczmal Stochastic Annealing Spatial and Spatiotemporal Scan Statistics in Geographic Surveillance Invited Discussant Thomas A. Louis Department of Biostatistics Johns Hopkins Bloomberg School of Public Health
JOINT STATISTICAL MEETINGS 2002 JSM New York, NY Invited Session on Multiscale Raster Map Analysis System for Digital Government in the 21 st Century Organizer: G. P. Patil Chair: G. P. Patil 2: 00 – 2: 05 Chair 2: 05 – 2: 30 Charles Taillie and Ganapati P. Patil ‘Multiscale Raster Map Analysis: Stochastic Models, Statistical Methods, and Computational Tools’ 2: 30 – 2: 55 Stephen Stehman and Ray Czaplewski ‘Statistical Issues in Assessing the Accuracy of Multi. Category Raster Maps’ 2: 55 – 3: 20 Koji Kurihara, Wayne Myers, and Ganapati P. Patil ‘Cellular Automation of Surface Understanding with Echelon Analysis and Its Applications to Geospatial Change Detection’ 3: 20 – 3: 45 W. L. Myers, Koji Kurihara, Ganapati P. Patil and Ryan Vraney ‘Finding Upper Level Sets in Cellular Surface Data Using Echelons and Sa. TScan’ 3: 45 – 3: 50 Floor Discussion
Cross-Disciplinary Classroom Materials Stat 548: Spring 2004 February 10, 2004: Atlantic Slope Consortium: Watershed Classification Power. Point Presentation by Denice Wardrop February 12, 2004: Atlantic Slope Consortium: Framework Power. Point Presentation by Denice Wardrop February 19, 2004: Cluster Analysis: Finding Groups in Data Power. Point Presentation by Charles Taillie February 2004: Watershed Characterization and Prioritization Power. Point Presentation by Kristen Hychka