
The New Jersey Space Grant Consortium at Stevens
- Slides: 36
The New Jersey Space Grant Consortium at Stevens Institute of Technology and Rutgers University Mike Giglia, Ethan Hayon, Robert Hopkins, Jenny Jean, Mark Siembab, Sean Watts Preliminary Design Review October 26 th, 2011
Purpose of PDR a. Confirm that: Science objectives and required system performance have been translated into verifiable requirements b. Payload Design: to specifications from requirements, can be met through proposed design (trade studies) c. Project risks have been identified, and mitigation plans exist d. Project management plan is adequate to meet schedule and budget e. Project is at a level to proceed to prototyping of high risk items a. gnurf. net
PDR Presentation Content a. Section 1: Mission Overview a. b. c. d. e. Mission Overview Organizational Chart Theory and Concepts Concept of Operations Expected Results b. Section 2: System Overview a. b. c. d. e. f. Subsystem Definitions Critical Interfaces (ICDs? ) System Level Block Diagram System/Project Level Requirement Verification Plan User Guide Compliance Sharing Logistics
PDR Presentation Contents a. Section 3: Subsystem Design Subsystem 1 (AMS) a. AMS Block Diagram b. AMS Key Trade Studies (3) c. AMS Risk Matrix b. Subsystem 2 (ITS) a. ITS Block Diagram b. ITS Key Trade Studies (1) c. ITS Risk Matrix c. Subsystem 3 (Misc. Sensors) a. Misc. Sensor Block Diagram a.
PDR Presentation Contents a. Section 4: Prototyping Plan a. Item “A” to be Prototyped b. Item “B” to be Prototyped c. Etc. , Etc… b. Section 5: Project Management Plan a. Schedule b. Budget c. Work Breakdown Structure
Mission Overview Robert Hopkins
Mission Overview a. Mission statement a. To collect and analyze data for future space research operations through various experiments designed and implemented on a payload. b. Experiments: a. Atmospheric a. O 3, CH 4, CO 2 b. Vibration a. Piezo vibration of sensor plate c. Temperature a. Infrared sensor pointed at inside of rocket skin� d. Rotational Frequency a. Measure rotational frequency using a gyroscope
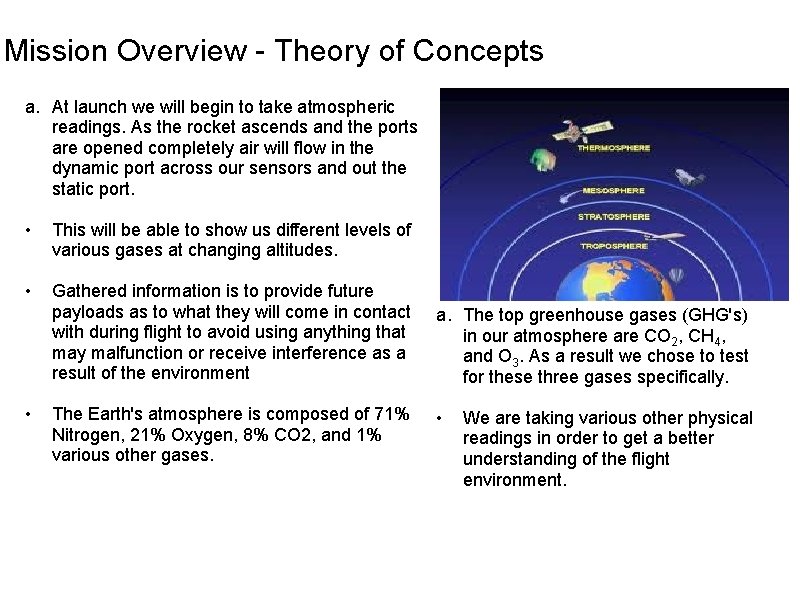
Mission Overview - Theory of Concepts a. At launch we will begin to take atmospheric readings. As the rocket ascends and the ports are opened completely air will flow in the dynamic port across our sensors and out the static port. • This will be able to show us different levels of various gases at changing altitudes. • Gathered information is to provide future payloads as to what they will come in contact with during flight to avoid using anything that may malfunction or receive interference as a result of the environment • The Earth's atmosphere is composed of 71% Nitrogen, 21% Oxygen, 8% CO 2, and 1% various other gases. a. The top greenhouse gases (GHG's) in our atmosphere are CO 2, CH 4, and O 3. As a result we chose to test for these three gases specifically. • We are taking various other physical readings in order to get a better understanding of the flight environment.
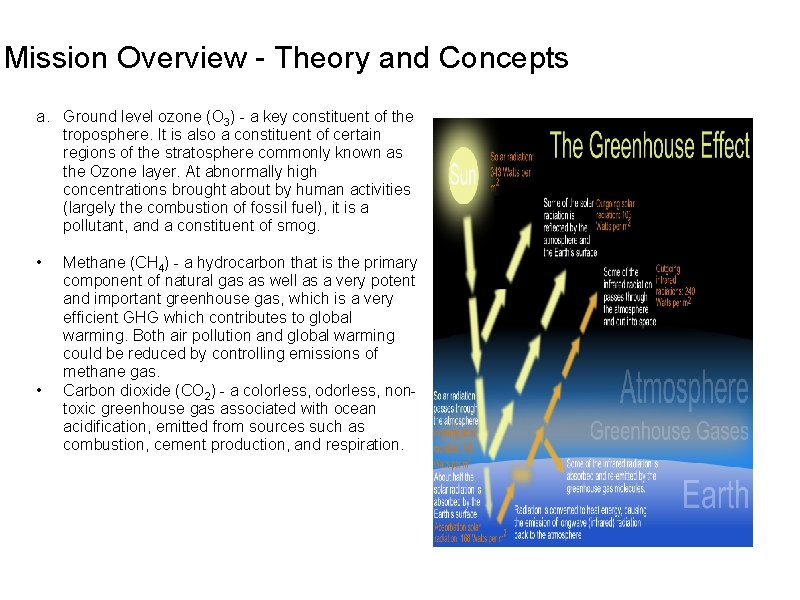
Mission Overview - Theory and Concepts a. Ground level ozone (O 3) - a key constituent of the troposphere. It is also a constituent of certain regions of the stratosphere commonly known as the Ozone layer. At abnormally high concentrations brought about by human activities (largely the combustion of fossil fuel), it is a pollutant, and a constituent of smog. • • Methane (CH 4) - a hydrocarbon that is the primary component of natural gas as well as a very potent and important greenhouse gas, which is a very efficient GHG which contributes to global warming. Both air pollution and global warming could be reduced by controlling emissions of methane gas. Carbon dioxide (CO 2) - a colorless, odorless, nontoxic greenhouse gas associated with ocean acidification, emitted from sources such as combustion, cement production, and respiration.
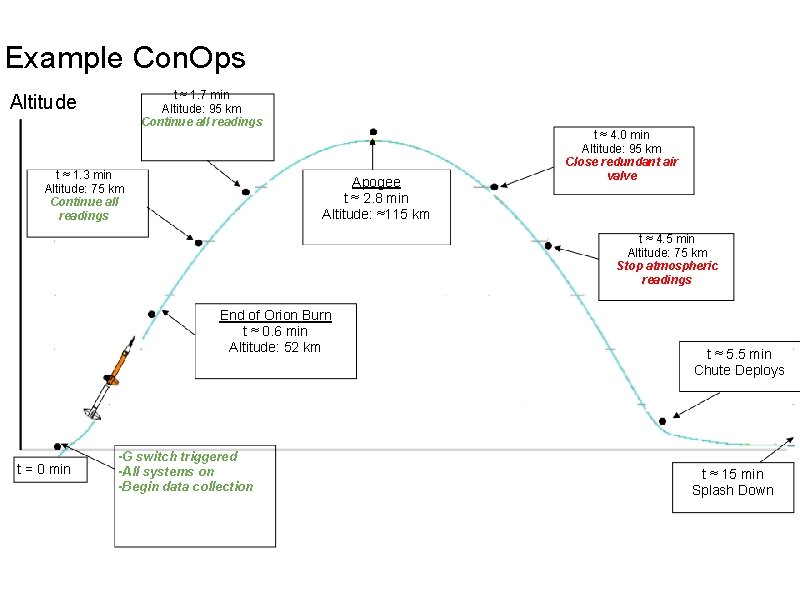
Example Con. Ops t ≈ 1. 7 min Altitude: 95 km Continue all readings Altitude t ≈ 1. 3 min Altitude: 75 km Continue all readings Apogee t ≈ 2. 8 min Altitude: ≈115 km t ≈ 4. 0 min Altitude: 95 km Close redundant air valve t ≈ 4. 5 min Altitude: 75 km Stop atmospheric readings End of Orion Burn t ≈ 0. 6 min Altitude: 52 km t = 0 min -G switch triggered -All systems on -Begin data collection t ≈ 5. 5 min Chute Deploys t ≈ 15 min Splash Down
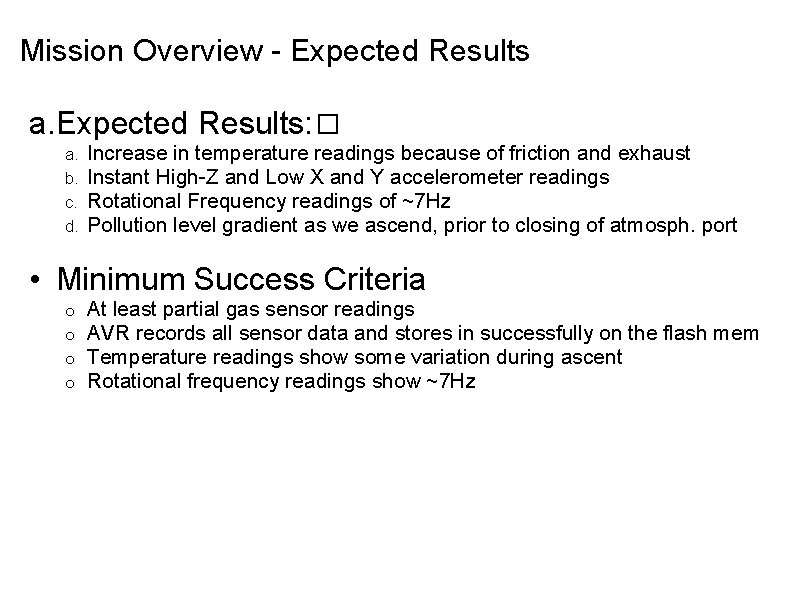
Mission Overview - Expected Results a. Expected Results: � a. b. c. d. Increase in temperature readings because of friction and exhaust Instant High-Z and Low X and Y accelerometer readings Rotational Frequency readings of ~7 Hz Pollution level gradient as we ascend, prior to closing of atmosph. port • Minimum Success Criteria o o At least partial gas sensor readings AVR records all sensor data and stores in successfully on the flash mem Temperature readings show some variation during ascent Rotational frequency readings show ~7 Hz
System Overview Ethan Hayon
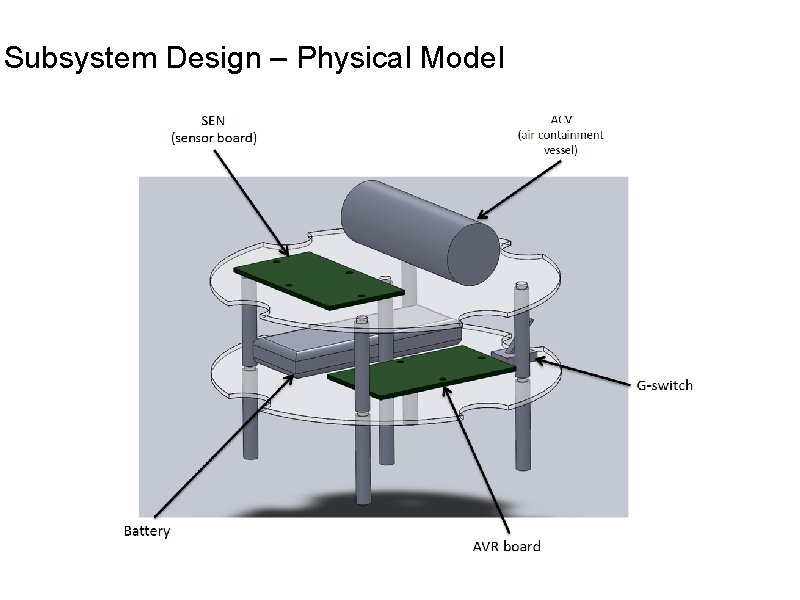
Subsystem Design – Physical Model
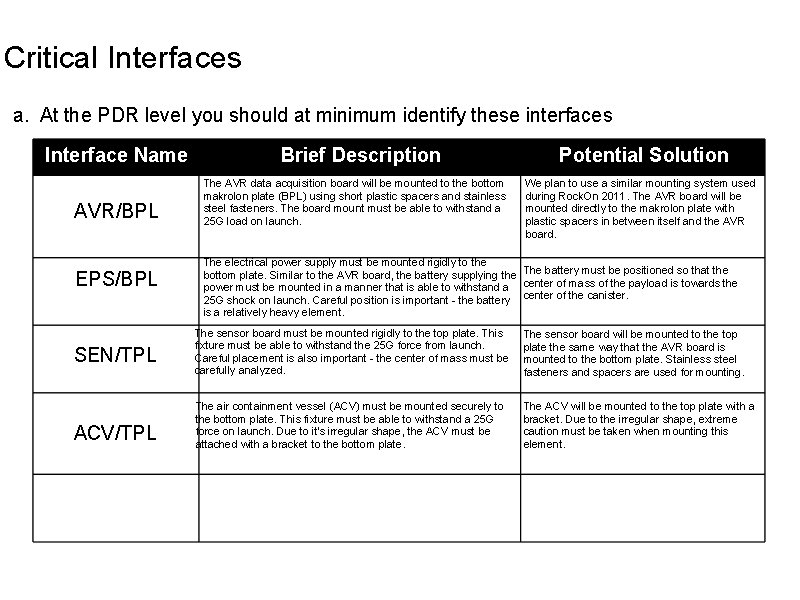
Critical Interfaces a. At the PDR level you should at minimum identify these interfaces Interface Name AVR/BPL EPS/BPL SEN/TPL ACV/TPL Brief Description The AVR data acquisition board will be mounted to the bottom makrolon plate (BPL) using short plastic spacers and stainless steel fasteners. The board mount must be able to withstand a 25 G load on launch. Potential Solution We plan to use a similar mounting system used during Rock. On 2011. The AVR board will be mounted directly to the makrolon plate with plastic spacers in between itself and the AVR board. The electrical power supply must be mounted rigidly to the bottom plate. Similar to the AVR board, the battery supplying the The battery must be positioned so that the power must be mounted in a manner that is able to withstand a center of mass of the payload is towards the 25 G shock on launch. Careful position is important - the battery center of the canister. is a relatively heavy element. The sensor board must be mounted rigidly to the top plate. This fixture must be able to withstand the 25 G force from launch. Careful placement is also important - the center of mass must be carefully analyzed. The sensor board will be mounted to the top plate the same way that the AVR board is mounted to the bottom plate. Stainless steel fasteners and spacers are used for mounting. The air containment vessel (ACV) must be mounted securely to the bottom plate. This fixture must be able to withstand a 25 G force on launch. Due to it's irregular shape, the ACV must be attached with a bracket to the bottom plate. The ACV will be mounted to the top plate with a bracket. Due to the irregular shape, extreme caution must be taken when mounting this element.
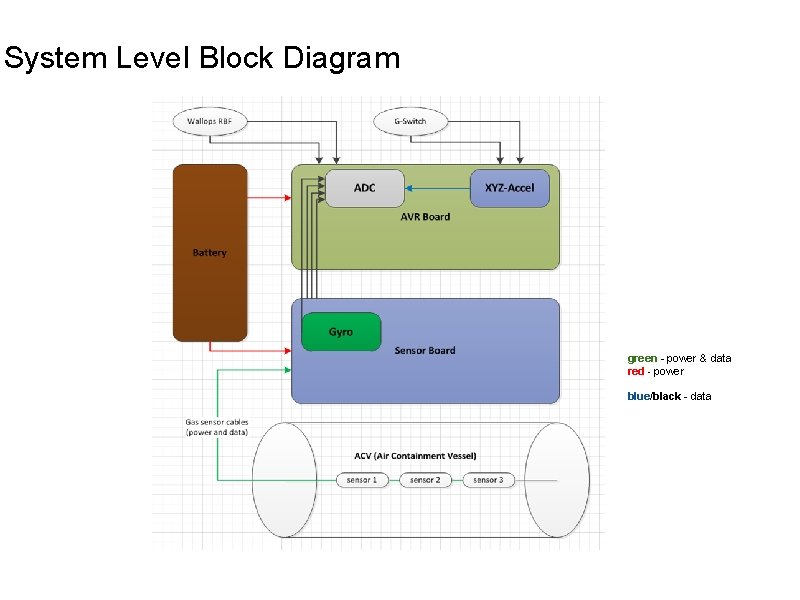
System Level Block Diagram green - power & data red - power blue/black - data
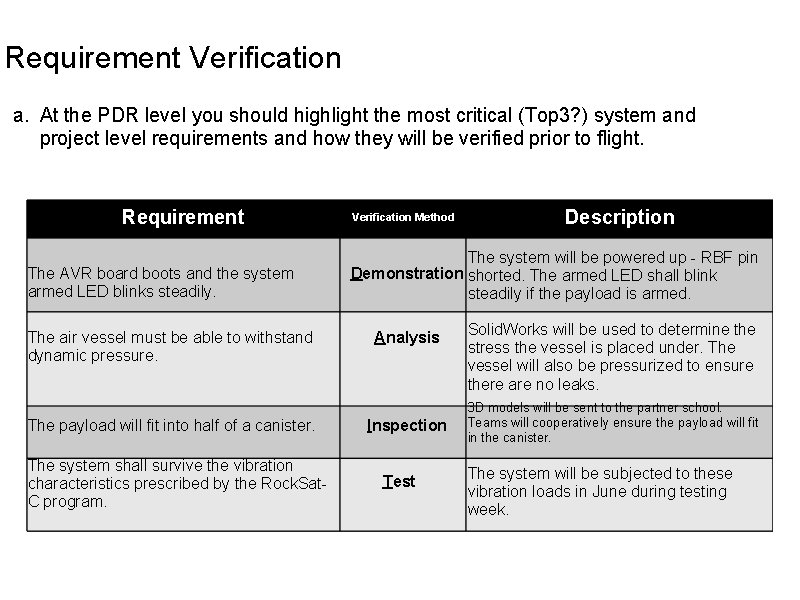
Requirement Verification a. At the PDR level you should highlight the most critical (Top 3? ) system and project level requirements and how they will be verified prior to flight. Requirement The AVR board boots and the system armed LED blinks steadily. The air vessel must be able to withstand dynamic pressure. The payload will fit into half of a canister. The system shall survive the vibration characteristics prescribed by the Rock. Sat. C program. Verification Method Description The system will be powered up - RBF pin Demonstration shorted. The armed LED shall blink steadily if the payload is armed. Analysis Inspection Test Solid. Works will be used to determine the stress the vessel is placed under. The vessel will also be pressurized to ensure there are no leaks. 3 D models will be sent to the partner school. Teams will cooperatively ensure the payload will fit in the canister. The system will be subjected to these vibration loads in June during testing week.
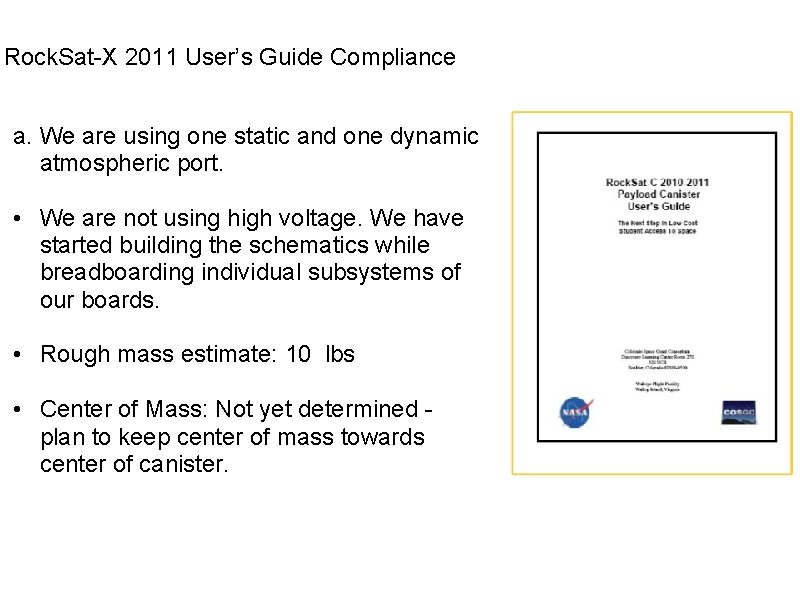
Rock. Sat-X 2011 User’s Guide Compliance a. We are using one static and one dynamic atmospheric port. • We are not using high voltage. We have started building the schematics while breadboarding individual subsystems of our boards. • Rough mass estimate: 10 lbs • Center of Mass: Not yet determined - plan to keep center of mass towards center of canister.
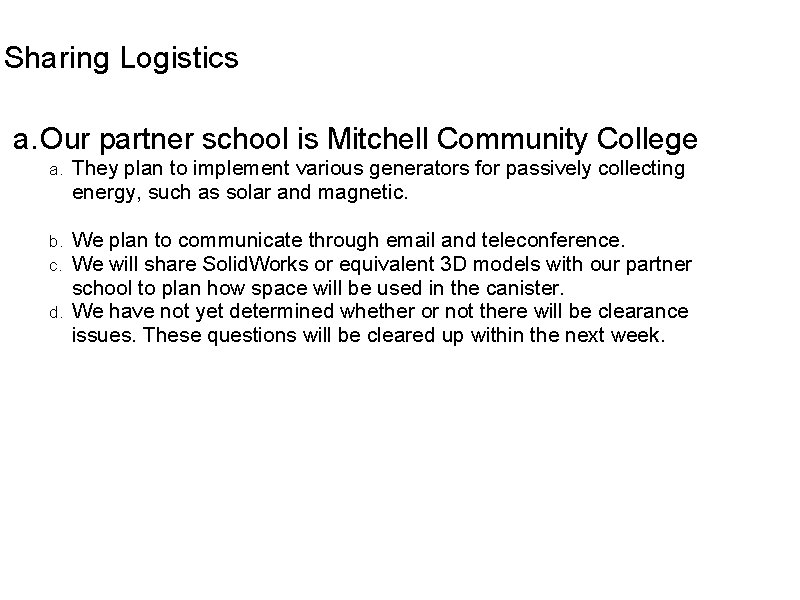
Sharing Logistics a. Our partner school is Mitchell Community College They plan to implement various generators for passively collecting energy, such as solar and magnetic. b. We plan to communicate through email and teleconference. c. We will share Solid. Works or equivalent 3 D models with our partner school to plan how space will be used in the canister. d. We have not yet determined whether or not there will be clearance issues. These questions will be cleared up within the next week. a.
Subsystem Design (1) Atmospheric Measurement System (AMS) Mark Siembab
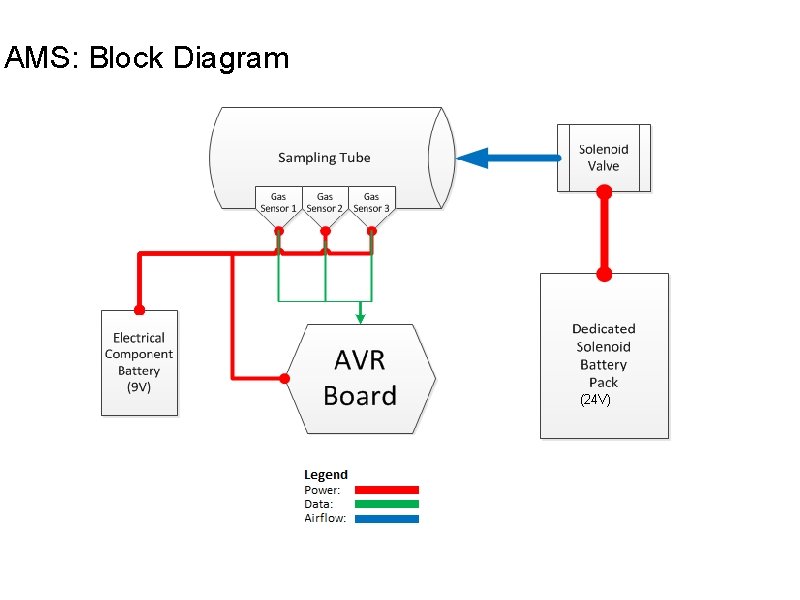
AMS: Block Diagram (24 V)
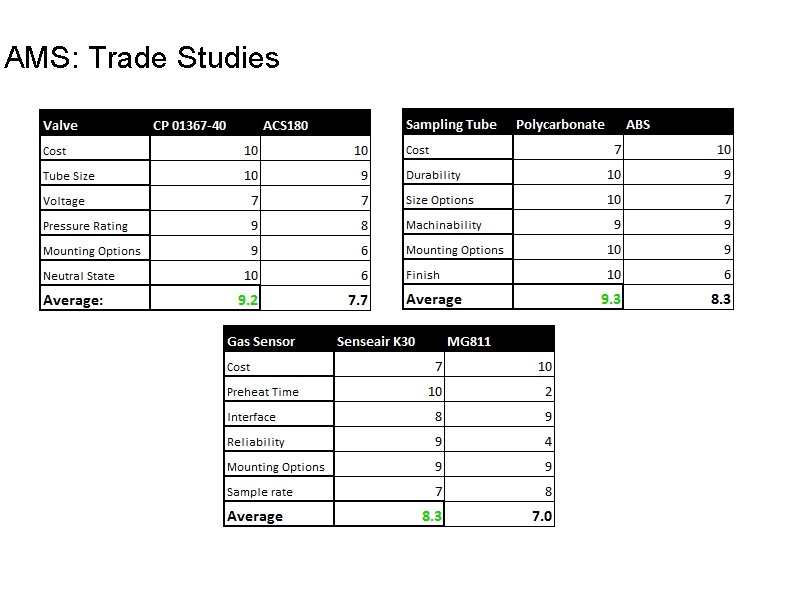
AMS: Trade Studies
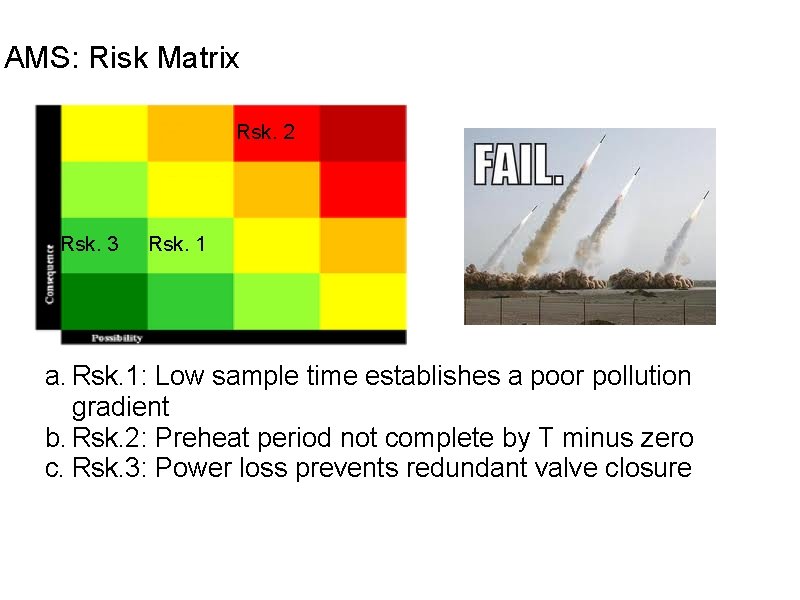
AMS: Risk Matrix Rsk. 2 Rsk. 3 Rsk. 1 a. Rsk. 1: Low sample time establishes a poor pollution gradient b. Rsk. 2: Preheat period not complete by T minus zero c. Rsk. 3: Power loss prevents redundant valve closure
Subsystem Design (2) Infrared Temperature Sensor (ITS) Mark Siembab
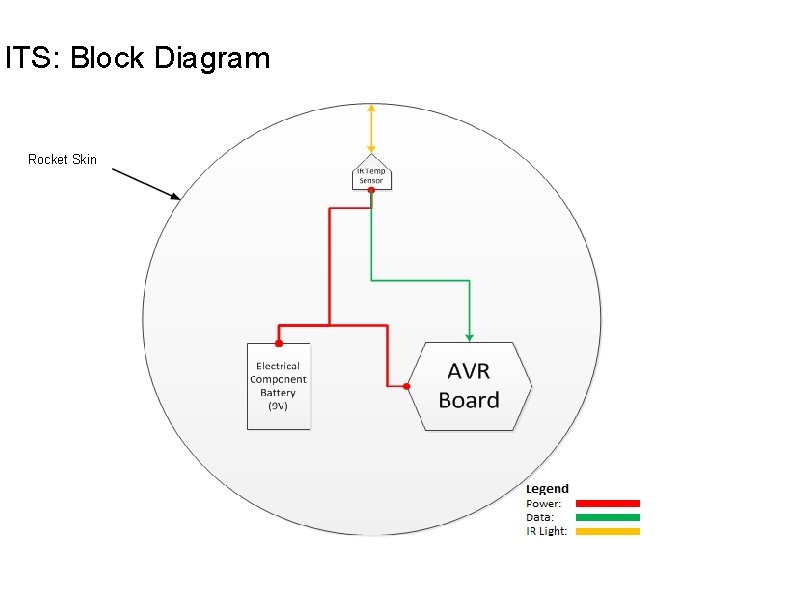
ITS: Block Diagram Rocket Skin
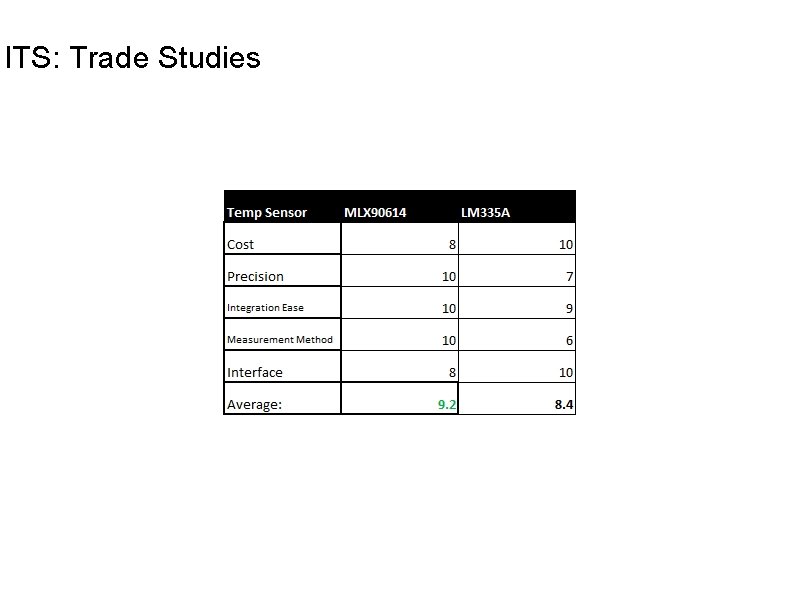
ITS: Trade Studies
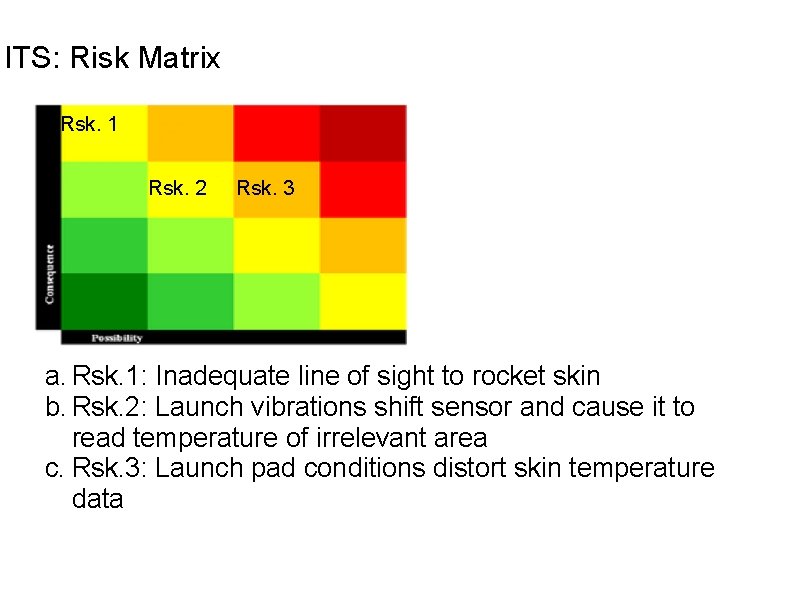
ITS: Risk Matrix Rsk. 1 Rsk. 2 Rsk. 3 a. Rsk. 1: Inadequate line of sight to rocket skin b. Rsk. 2: Launch vibrations shift sensor and cause it to read temperature of irrelevant area c. Rsk. 3: Launch pad conditions distort skin temperature data
Subsystem Design (3) Gyroscope and Vibration Sensor (Misc. Sensors) Mark Siembab
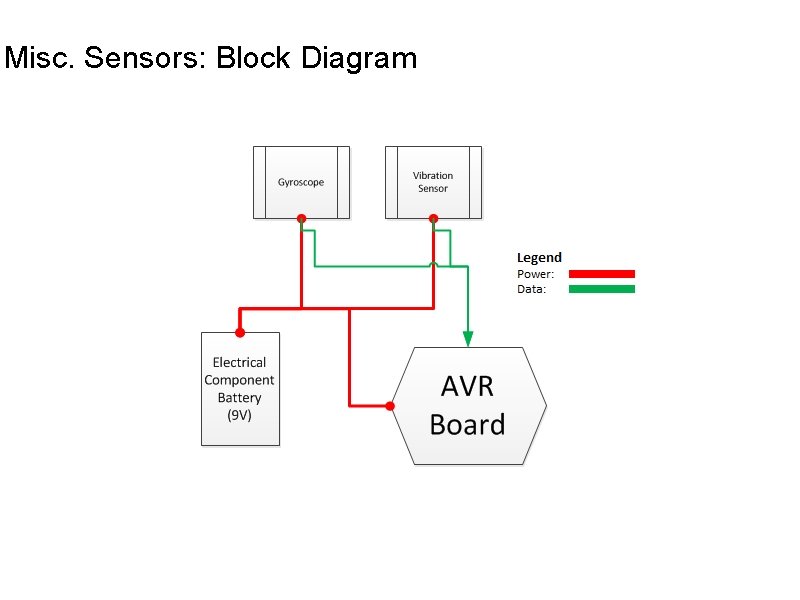
Misc. Sensors: Block Diagram
Prototyping Plan Sean Watts
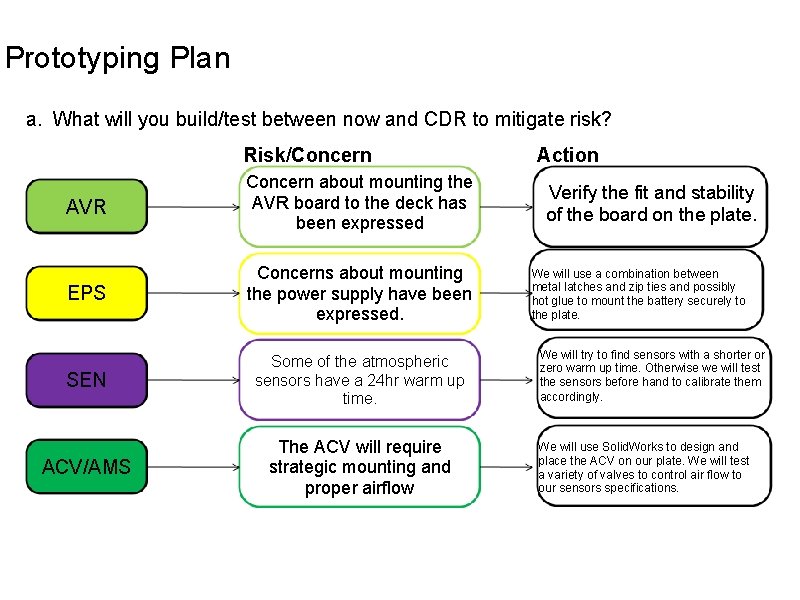
Prototyping Plan a. What will you build/test between now and CDR to mitigate risk? Risk/Concern AVR Concern about mounting the AVR board to the deck has been expressed EPS Concerns about mounting the power supply have been expressed. SEN Some of the atmospheric sensors have a 24 hr warm up time. ACV/AMS The ACV will require strategic mounting and proper airflow Action Verify the fit and stability of the board on the plate. We will use a combination between metal latches and zip ties and possibly hot glue to mount the battery securely to the plate. We will try to find sensors with a shorter or zero warm up time. Otherwise we will test the sensors before hand to calibrate them accordingly. We will use Solid. Works to design and place the ACV on our plate. We will test a variety of valves to control air flow to our sensors specifications.
Project Management Plan Jenny Jean
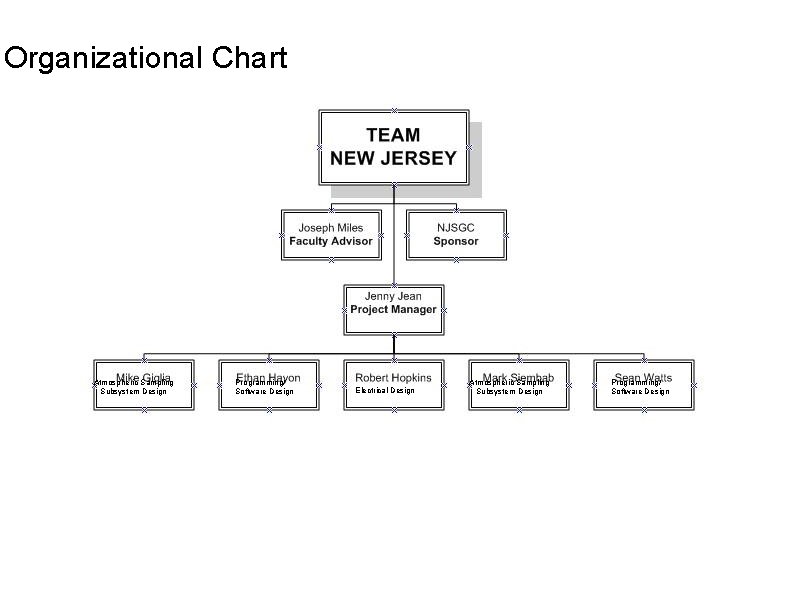
Organizational Chart Atmospheric Sampling Subsystem Design Programming/ Software Design Electrical Design Atmospheric Sampling Subsystem Design Programming/ Software Design
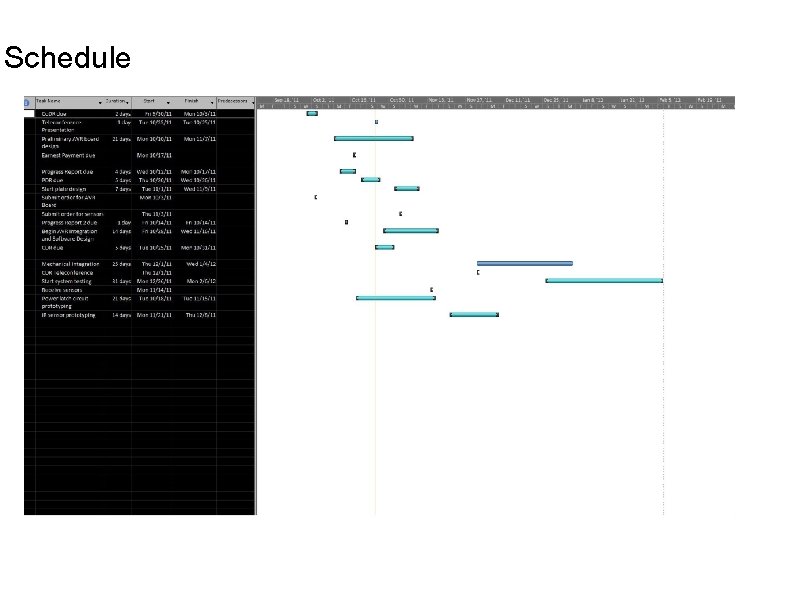
Schedule
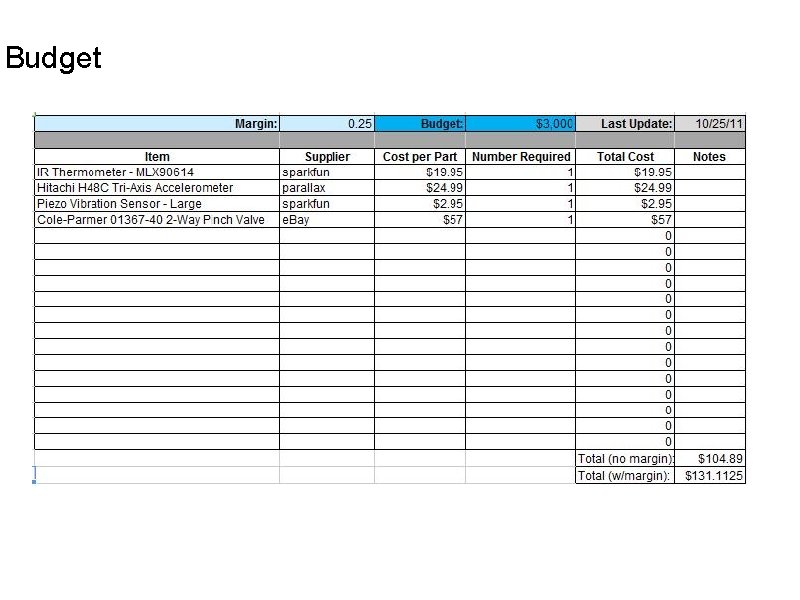
Budget
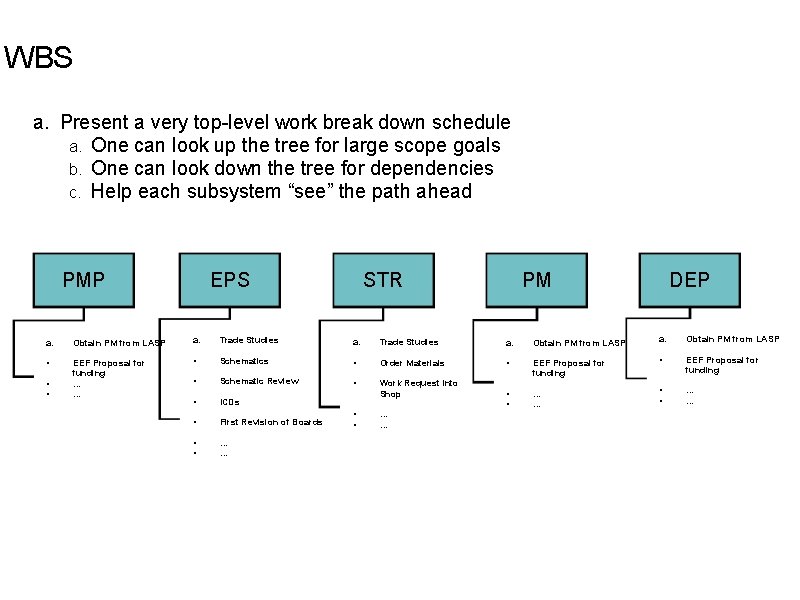
WBS a. Present a very top-level work break down schedule a. One can look up the tree for large scope goals b. One can look down the tree for dependencies c. Help each subsystem “see” the path ahead PMP EPS STR PM DEP a. Obtain PM from LASP a. Trade Studies a. Obtain PM from LASP • EEF Proposal for funding … … • Schematics • Order Materials • • EEF Proposal for funding • Schematic Review • EEF Proposal for funding • ICDs Work Request Into Shop • • … … • First Revision of Boards • • … …
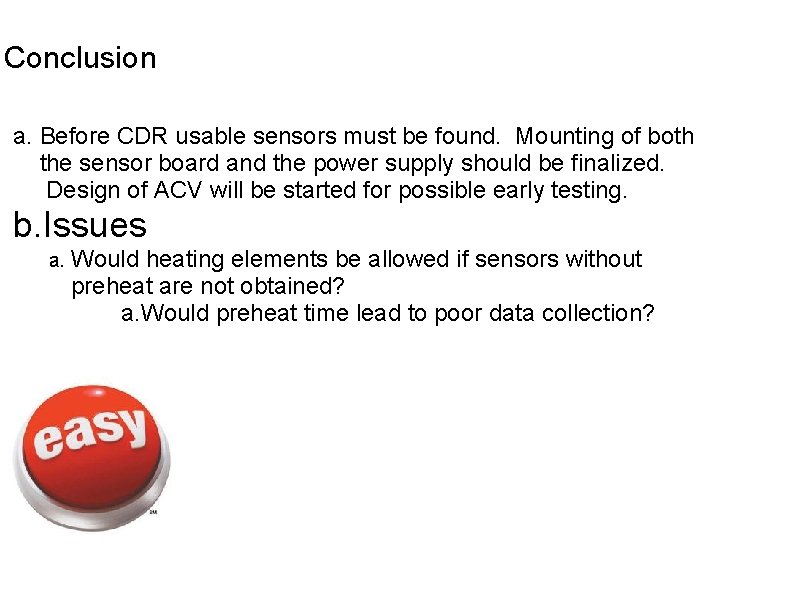
Conclusion a. Before CDR usable sensors must be found. Mounting of both the sensor board and the power supply should be finalized. Design of ACV will be started for possible early testing. b. Issues a. Would heating elements be allowed if sensors without preheat are not obtained? a. Would preheat time lead to poor data collection?