Analytical Chemistry Identification and Quantitation of Compounds in


 Evaluate the problem: --pure component or mixture --solid, liquid or")
")
 Select the appropriate method. n Select a sample preparation method: extraction? dilution?")
 Characterize the method with reference compounds and standards. Run controls.")


 Stretching:")


+ 515 231")


 78 -82, Paganga")
 kaempferol (286)")

 Ø Acid hydrolysis for cleaving flavonoid glycosides to their aglycone forms")


 m/z 447 with RT =")

- Slides: 52
Analytical Chemistry: Identification and Quantitation of Compounds in Complex Mixtures n n n The General Analytical Strategy Spectroscopic Methods Mass Spectrometry Sample Preparation Methods Quantitation Application to the Analysis of Flavonoids: Mass Spectrometry
Analytical Chemistry: Identification and Quantitation of Compounds in Complex Mixtures Example: Common Flavonoid Structures
The complexity of the problem: Many flavonoids are glycosylated Ø Sugar linkage: O-glycosylflavonoids>>C-glycosylflavonoids Ø Positions of glycosylation: 3 -OH>7 -OH>>3’, 4’, or 5 -positions Ø Level of glycosylation flavonoid aglycone Ø Number of different sugars involved Common sugars found in flavonoid glycosides glucose rhamnose galactose arabinose xylose
THE ANALYTICAL STRATEGY 1) Evaluate the problem: --pure component or mixture --solid, liquid or gas --organic, inorganic, elemental --sample size and number of samples --quantitative or qualitative analysis --type of matrix --requirements for accuracy and precision
Analytes of interest…. (a protein)
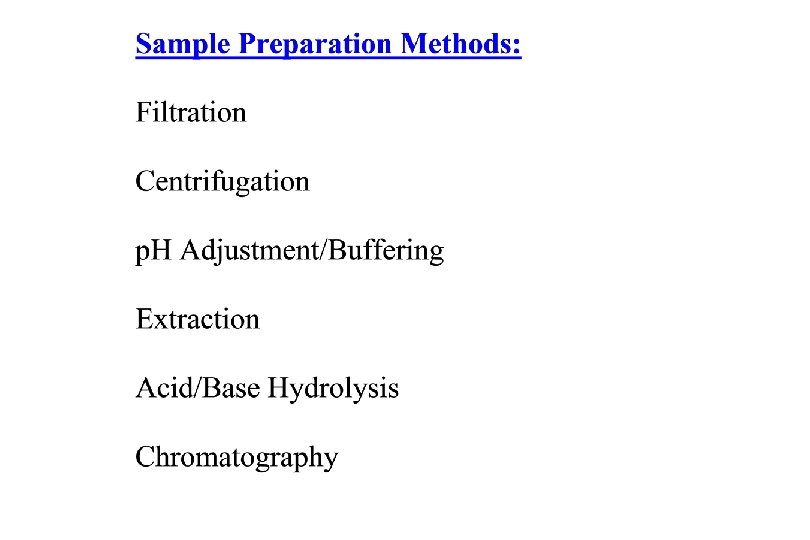
n 2) Select the appropriate method. n Select a sample preparation method: extraction? dilution? acid/base conditions? filtration? n If it is a mixture, select: GC (Gas Chromatography) HPLC (High Performance Liquid Chromatography) CZE (Capillary Zone Electrophoresis) n n n For analysis, select: Classical "wet chemistry" methods (titrimetry, gravimetry) Electrochemical methods UV/Vis Molecular Absorption Spectroscopy Infrared Absorption Spectroscopy Molecular Fluorescence Spectroscopy Raman Scattering Spectroscopy Microscopy Nuclear Magnetic Resonance X-Ray Spectroscopy Electron Spectroscopy Atomic Spectroscopy Mass Spectrometry
Analytical Strategy continued… 3) Characterize the method with reference compounds and standards. Run controls. Establish accuracy and precision for quantitative applications. 4) Construct a calibration curve and/or standard addition method or use internal standard for quantitative analysis. 5) Evaluate samples of interest. Repeat as necessary.
Overview of Spectroscopic Methods
The absorption of energy…. Ground Excited state CO bond length 120 pm 132 pm CH bond length 110 pm 109 pm H-C-H angle 116. 5 o 119 o
Spectrophotometer
Molecular UV-Vis Absorption of UV or visible light causes “electronic transitions” in which electrons are excited to antibonding orbitals.
Absorption in Spectroscopy Electromagnetic Radiation Sample
UV-Vis Spectra of Four Flavonoids Rutin Ploridzin Quercetin glycoside Anthocyanidin Adapted from FEBS Letters, 401 (1997) 78 -82, Paganga and Rice-Evans.
Beer’s Law: A = a b c = Absorbance where a = absorptivity in L/(g-cm) b = pathlength of radiation through sample in cm c = concentration of sample in g/L
Absorptivity: the probability that an analyte will absorb a particular wavelength of energy (also known as “extinction coefficient”) n --range from 0 – 100, 000 --units of L/(g-cm) or L/(mol-cm) --depends on presence of chromophores in the analytes
Absorbance concentration Increasing concentration of analyte higher absorbance A=abc Wavelength in nm
UV-Vis Spectrometer
IR Absorption Formaldehyde Vibrational modes include stretching and bending (twisting, rocking, scissoring, wagging) Stretching: change in distance between atoms along interatomic axis Bending: change in angle between two bonds
Characteristic IR Absorption Frequencies
Infrared Absorption Spectrum of Naringin OH Adapted from Sadtler Index, 1973. C=O stretch C-O stretch aromatic
FTIR Spectrometer
Nuclear Magnetic Resonance
Typical NMR Proton Chemical Shifts
Proton NMR Spectrum of Morin H 6’ H 3’ H 8 or H 6 H 5’ H 8 or H 6 (Hydroxyl protons not shown, from 9 - 13 ppm) Adapted from Biochem. Pharm. , 59 (1995) 537 -543, Wu et al.
NMR Spectrometer
Overview of the Mass Spectrometer
Common Ionization Method for GC-MS n Electron Ionization: “EI” M = analyte e = electron F = fragment
Electron Ionization Mass Spectrum of Chalcone: Molecular Weight 208 amu 77 208 193 105 89 131 152 165 179 Adapted from Rapid Commun. Mass Spectrom. , 12 (1998) 139 -143, Ardanaz et al.
Fragmentation of Chalcone Ion
EI-Quadrupole MS
Electrospray ionization for Larger, Involatile Molecules ring electrode sample capillary ESI capillary heated capillary detector octapole ion guides sheath gas skimmer entrance endcap exit end-cap
Collisional Activation Dissociation to Fragment Ions
Collisional Activated Dissociation of Protonated Nomilin 411 455 393 (M + H)+ 515 231 m/z 200 300 455 -- loss of CH 3 COOH 411 -- loss of CH 3 COOH and CO 2 400 500
Solid-Phase Extraction Contaminants Compounds of Interest 1. Add Sample/Wash Contaminants 2. Elute Compounds of Interest
Gas chromatography for separation of volatile analytes in mixtures Intensity Capillary column Retention time
HPLC Apparatus: for involatile analytes in mixtures Regulated He Supply Pump Solvent Reservoirs Detector Column Injector Valve
C 18 Stationary Phase Si C H 3 Si Si Si H 3 C CH 3
Quantitation
Typical Calibration Curves for Flavonoids Adapted from: FEBS Letters, 401 (1997) 78 -82, Paganga and Rice-Evans.
Flavonoids in Kale: An LC-MS/MS Study quercetin (302) kaempferol (286)
ØKale extraction Ø Liquid extraction of flavonoids from kale powder 1: 1 acetone vortex centrifuge 1: 1 30: 70 acetone: water extract 1 aqueous phase collected filter Adapted from: supernatant powder 2: 1 chloroform Kale leaves N 2 (l) separation Zhang, Satterfield, Brodbelt, Britz, Clevidence, Novotny Anal. Chem. , 75 (2003) 6401 -6407.
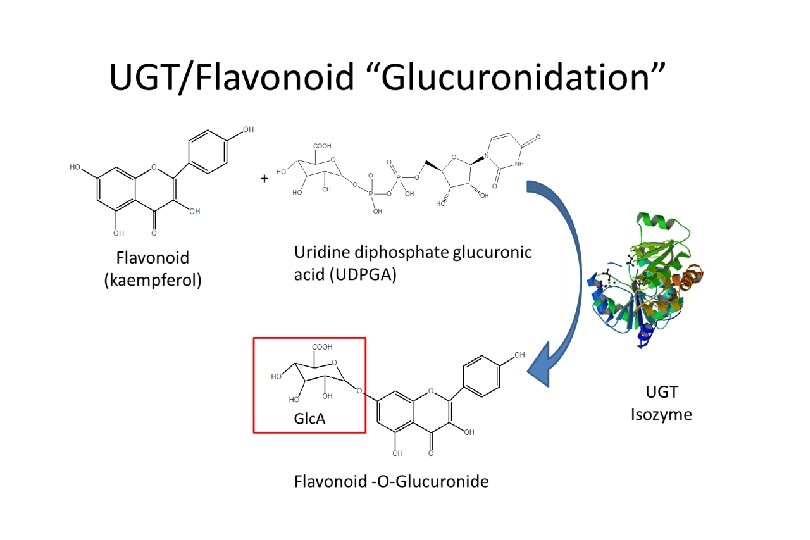
Kale extraction (cont’d) Ø Acid hydrolysis for cleaving flavonoid glycosides to their aglycone forms 1 ml kale extract 1 + 5 ml 2 N HCl in 50: 50 water: methanol mix 100°C 2 h kale extract 2 Ø Solid phase extraction for cleanup and concentration condition kale extract 2 C 18 cartridge wash elute kale extract 3 (final) LC-MS/MS analysis
Flavonoid separation by HPLC Ø Guard column: Waters Symmetry C 18, 2. 1 10 mm, 3. 5 m Ø Analytical column: Waters Symmetry C 18, 2. 1 50 mm, 3. 5 m Ø Mobile phase: Solvent A-water, solvent B-acetonitrile. 0 -13 min: 30 -100 B; 13 -15 min: 100 -30 B; 15 -25 min: 30 B
Identification of flavonoids by ESI-MS/MS: CAD spectrum of quercetin 179: - C 7 H 6 O 2 100 Relative Abundance 80 151: - C 7 H 6 O 2 – CO 60 C 15 H 10 O 7 Mw=302 40 273: - CO 20 257: - CO 2 107: C 7 H 6 O 2 - CO 2 0 100 140 193 180 229 220 m/z 301 (M - H+) 239 260 300 340
Calibration curves of flavonoids by LCMS Kaempferol y = 0. 0635 x + 0. 0876 R 2 = 0. 9972 Quercetin y = 0. 0556 x + 0. 199 R 2 = 0. 9785 Linear concentration range: 0. 03 -90 g/ml Detection limit by HPLC-ESI-MS: quercetin-~10 pg; kaempferol-~3 pg
Analysis of kale samples by LCMS A. HPLC-UV chromatogram 0. 040 int. std. 0. 030 AU quercetin 0. 020 B. TIC-MS chromatogram Relative Abundance 100 int. std. kaempferol 0. 010 0. 000 4. 00 80 8. 00 16. 00 12. 00 Minutes 20. 00 24. 00 60 40 20 0 0 quercetin kaempferol 4 Adapted from: 8 12 16 Time (min) 20 24 Quercetin in kale: 77 ppm Kaempferol in kale: 235 ppm Recovery: ~65% Zhang, Satterfield, Brodbelt, Britz, Clevidence, Novotny Anal. Chem. , 75 (2003) 6401 -6407.
Flavonoids in Grapefruit: Monitoring metabolites by LC-MS/MS ØIdentification of metabolites ØPharmacokinetics ØBioavailability
Analysis of urine by LCMS after consumption of grapefruit juice Relative Abundance 100 RT: 5. 6 m/z: 447 RT: 6. 4 m/z 447 Urine at t = 7. 5 h RT: 9. 7 m/z: 253 RT: 10. 7 m/z: 351 0 Time (minutes) Zhang and Brodbelt, The Analyst. , 129 (2004) 1227 -1233.
Fragmentation patterns of components from previous LCMS chromatogram B) m/z 447 with RT = 6. 4 min 271 (-Glc. UA) 100 175 (-NE) 429 (-H 2 O) A glucuronide 447 0 351 A sulfate 351 Another sulfate C) m/z 351 with RT = 4. 4 min 100 271 (-SO 3) Relative Abundance 0 D) m/z 351 with RT = 9. 1 min 271 (-SO 3) 100 0 E) m/z 351 with RT = 11. 1 min 100 271 (-SO 3) 0 F) m/z 527 with RT = 8. 2 min 527 351 (-Glc. UA) 100 0 255 (-NE) G) m/z 527 with RT = 10. 8 min 100 0 447 (-SO 3) 527 A glucuronidesulfate Another sulfate
Time plot of major metabolites in urine after consumption of grapefruit juice (analysis by LC-MS/MS)