A survey of goodnessoffit tests for point process

 collection of")
 Neyman-Scott process: clusters of points whose centers are")
: g(t) = K/(t+c)p.")
 Poisson process: l(t, x) = m. •")
 with ∫A l(t, x) dt dx, on pixels Ai.")
")
 Likelihood statistics (LR, AIC, BIC). Log-likelihood = ∑ logl(ti, xi)")

 ~ ∑∑i≠j I(|xi - xj| ≤ h), Weight each")
 = a m(x, y) + (1 - a)n. h (km)")
 Likelihood statistics (LR, AIC, BIC). Log-likelihood = ∑ logl(ti, xi)")
 number of alarms vs. (normalized) number of false negatives")

: Suppose N is simple, stationary, & ergodic.")
 = b. Keep each point (ti , xi)")
: Suppose N is simple & stationary. Then Mk --> stationary Poisson.")
 = c. Superpose N with a simulated Poisson")
 between residuals over")


![In ETAS (Ogata 1998), l(t, x, m) = f(m)[m(x) + ∑i g(t-ti, x-xi, mi)],](https://slidetodoc.com/presentation_image_h2/16b491c17beb2875890b5c23bd79ec58/image-24.jpg "In ETAS (Ogata 1998), l(t, x, m) = f(m)[m(x) + ∑i g(t-ti, x-xi, mi)],")

 Cauchy/ ellipsoidal (Kagan 1996)")
 tapered Pareto / wrapped exp. biv. normal")

- Slides: 32
A survey of goodness-of-fit tests for point process models for earthquake occurrences Rick Paik Schoenberg, UCLA Statistics • Some point process models in seismology • Pixel-based methods • Numerical summaries • Error diagrams • Residuals: rescaling, thinning, superposition • Comparative methods, tessellation residuals • Example
1. Some point process models in seismology. 2. Point process: random (s-finite) collection of points in some space, S. 3. N(A) = # of points in the set A. S = [0 , T] x X. 4. Simple: No two points at the same time (with probability one). 5. Conditional intensity: l(t, x) = lim. Dt, Dx -> 0 E{N([t, t+Dt) x Bx, Dx) | Ht} / [Dt. Dx]. 6. 7. Dx. Ht = history of N for all times before t, Bx, Dx = ball around x of size * A simple point process is uniquely characterized by l(t, x). (Fishman & Snyder 1976) Poisson process: l(t, x) doesn’t depend on Ht. N(A 1), N(A 2), … , N(Ak) are independent for disjoint Ai, and each Poisson.
Some cluster models of clustering: a) Neyman-Scott process: clusters of points whose centers are formed from a stationary Poisson process. Typically each cluster consists of a fixed integer k of points which are placed uniformly and independently within a ball of radius r around each cluster’s center. b) Cox-Matern process: cluster sizes are random: independent and identically distributed Poisson random variables. c) Thomas process: cluster sizes are Poisson, and the points in each cluster are distributed independently and isotropically according to a Gaussian distribution. d) Hawkes (self-exciting) process: parents are formed from a stationary Poisson process, and each produces a cluster of offspring points, and each of them produces a cluster of further offspring points, etc. l(t, x) = m + ∑ g(t-ti, ||x-xi||). ti < t
Aftershock activity typically follows the modified Omori law (Utsu 1971): g(t) = K/(t+c)p.
Commonly used in seismology: • Stationary (homogeneous) Poisson process: l(t, x) = m. • Inhomogeneous Poisson process: l(t, x) = f(t, x). (deterministic) • ETAS (Epidemic-Type Aftershock Sequence, Ogata 1988, 1998): l(t, x) = m(x) + ∑ g(t - ti, ||x - xi||, mi), ti < t where g(t, x, m) = K exp{am} (t+c)p (x 2 + d)q
2. Pixel-based methods. Compare N(Ai) with ∫A l(t, x) dt dx, on pixels Ai. (Baddeley, Turner, Møller, Hazelton, 2005) Problems: * If pixels are large, lose power. * If pixels are small, residuals are mostly ~ 0, 1. * Smoothing reveals only gross features.
(Baddeley, Turner, Møller, Hazelton, 2005)
3. Numerical summaries. a) Likelihood statistics (LR, AIC, BIC). Log-likelihood = ∑ logl(ti, xi) - ∫ l(t, x) dt dx. b) Second-order statistics. * K-function, L-function (Ripley, 1977) * Weighted K-function (Baddeley, Møller and Waagepetersen 2002, Veen and Schoenberg 2005) * Other weighted 2 nd-order statistics: R/S statistic, correlation integral, fractal dimension (Adelfio and Schoenberg, 2009)
Weighted K-function Usual K-function: K(h) ~ ∑∑i≠j I(|xi - xj| ≤ h), Weight each pair of points according to the estimated intensity at the points: Kw(h) ~ ∑∑i≠j wi wj I(|xi - xj| ≤ h), ^ where wi = l(ti , xi)-1. (asympt. normal, under certain regularity conditions. ) Lw(h) = centered version = √[Kw(h)/π] - h, for R 2
Model: l(x, y; a) = a m(x, y) + (1 - a)n. h (km)
3. Numerical summaries. a) Likelihood statistics (LR, AIC, BIC). Log-likelihood = ∑ logl(ti, xi) - ∫ l(t, x) dt dx. b) Second-order statistics. * K-function, L-function (Ripley, 1977) * Weighted K-function (Baddeley, Møller and Waagepetersen 2002, Veen and Schoenberg 2005) * Other weighted 2 nd-order statistics: R/S statistic, correlation integral, fractal dimension (Adelfio and Schoenberg, 2009) c) Other test statistics (mostly vs. stationary Poisson). TTT, Khamaladze (Andersen et al. 1993) Cramèr-von Mises, K-S test (Heinrich 1991) Higher moment and spectral tests (Davies 1977) Problems: -- Overly simplistic. -- Stationary Poisson not a good null hypothesis (Stark 1997)
4. Error Diagrams Plot (normalized) number of alarms vs. (normalized) number of false negatives (failures to predict). (Molchan 1990; Molchan 1997; Zaliapin & Molchan 2004; Kagan 2009). Similar to ROC curves (Swets 1973). Problems: -- Must focus near axes. [consider relative to given model (Kagan 2009)] -- Does not suggest where model fits poorly.
5. Residuals: rescaling, thinning, superposing Rescaling. (Meyer 1971; Merzbach & Nualart 1986; Nair 1990; Schoenberg 1999; Vere-Jones and Schoenberg 2004): Suppose N is simple. Rescale one coordinate: move each point {ti, xi} to {ti , ∫oxi l(ti, x) dx} [or to {∫oti l(t, xi) dt), xi }]. Then the resulting process is stationary Poisson. Problems: * Irregular boundary, plotting. * Points in transformed space hard to interpret. * For highly clustered processes: boundary effects, loss of power.
Thinning. (Westcott 1976): Suppose N is simple, stationary, & ergodic.
Thinning: Suppose inf l(ti , xi) = b. Keep each point (ti , xi) with probability b / l(ti , xi). Can repeat many times --> many stationary Poisson processes (but not quite ind. !)
Superposition. (Palm 1943): Suppose N is simple & stationary. Then Mk --> stationary Poisson.
Superposition: Suppose sup l(t , x) = c. Superpose N with a simulated Poisson process of rate c - l(t , x). As with thinning, can repeat many times to generate many (non-independent) stationary Poisson processes. Problems with thinning and superposition: Thinning: Low power. If b = inf l(ti , xi) is small, will end up with very few points. Superposition: Low power if c = sup l(ti , xi) is large: most of the residual points will be simulated.
6. Comparative methods, tessellation. -- Can consider difference (between competing models) between residuals over each pixel. Problem: Hard to interpret. If difference = 3, is this because model A overestimated by 3? Or because model B underestimated by 3? Or because model A overestimated by 1 and model B underestimated by 2? Also, when aggregating over pixels, it is possible that a model will predict the correct number of earthquakes, but at the wrong locations and times. -- Better: consider difference between log-likelihoods, in each pixel. (Wong & Schoenberg 2009). Problem: pixel choice is arbitrary, and unequal # of pts per pixel…. .
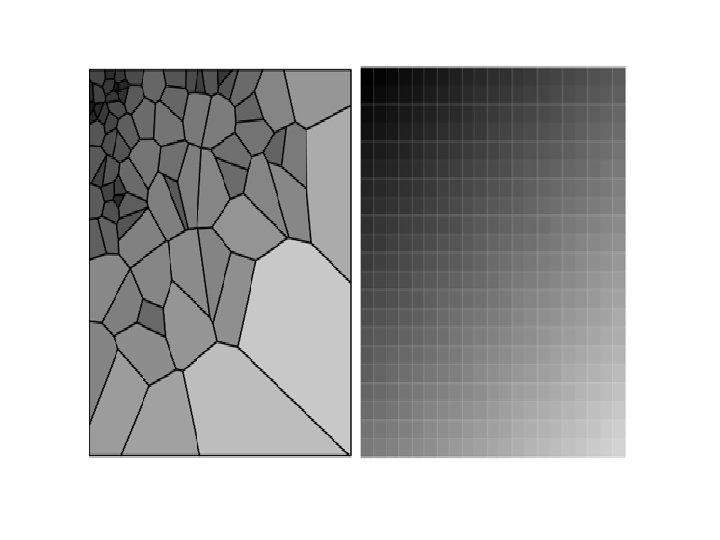
Problem: pixel choice is arbitrary, and unequal # of pts per pixel…. . -- Alternative: use the Voronoi tessellation of the points as cells. Cell i = {All locations closer to point (xi, yi) than to any other point (xj, yj) }. Now 1 point per cell. If l is locally constant, then cell area ~ Gamma (Hinde and Miles 1980)
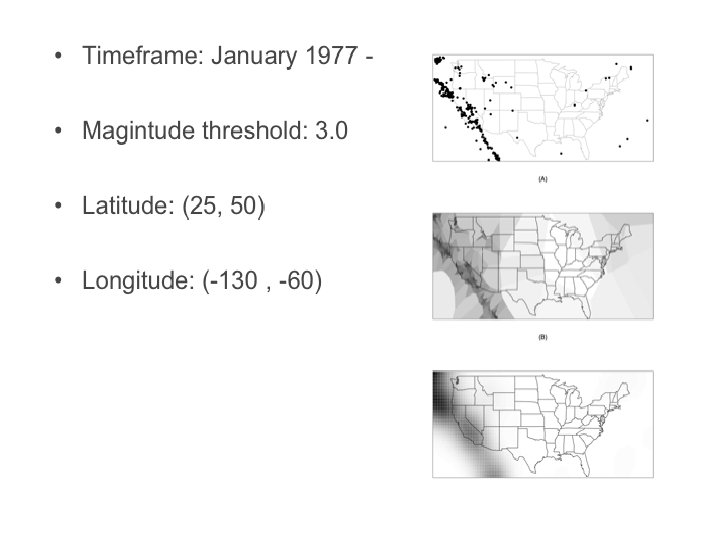
8. Example: using focal mechanisms in ETAS
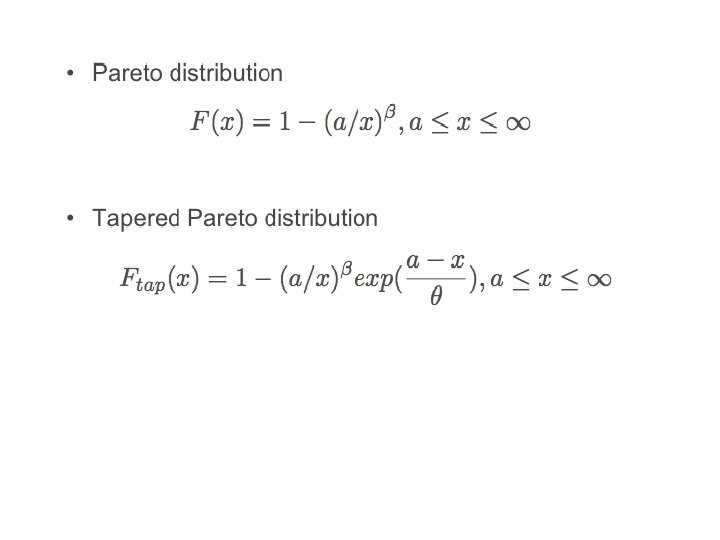
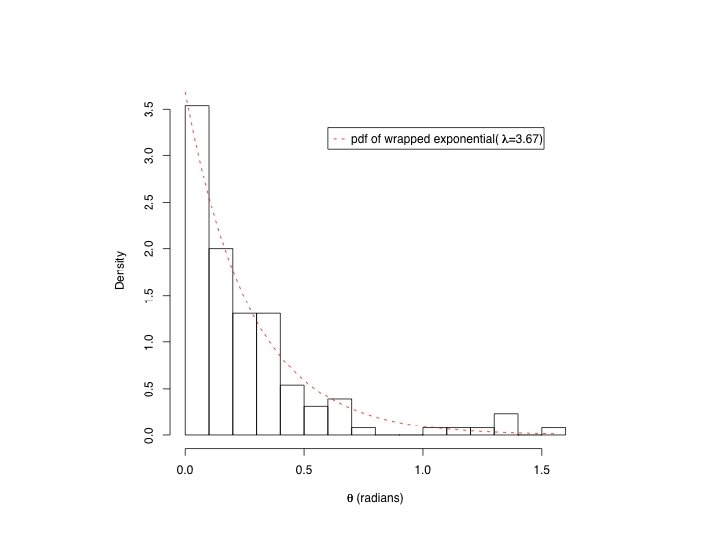
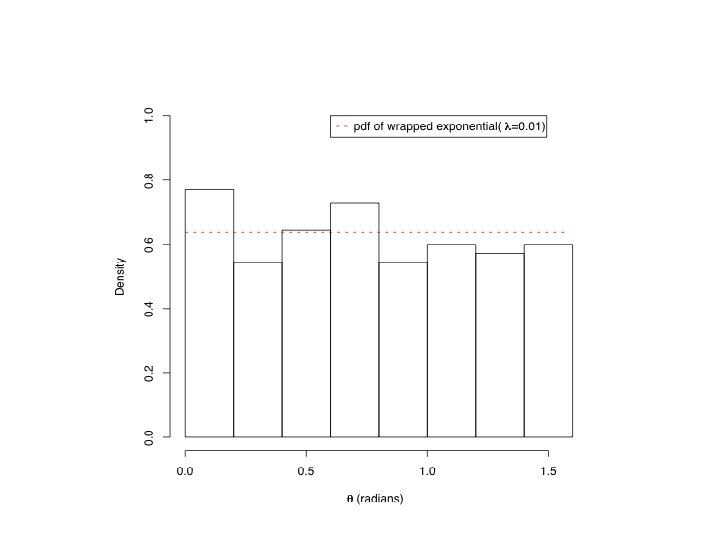
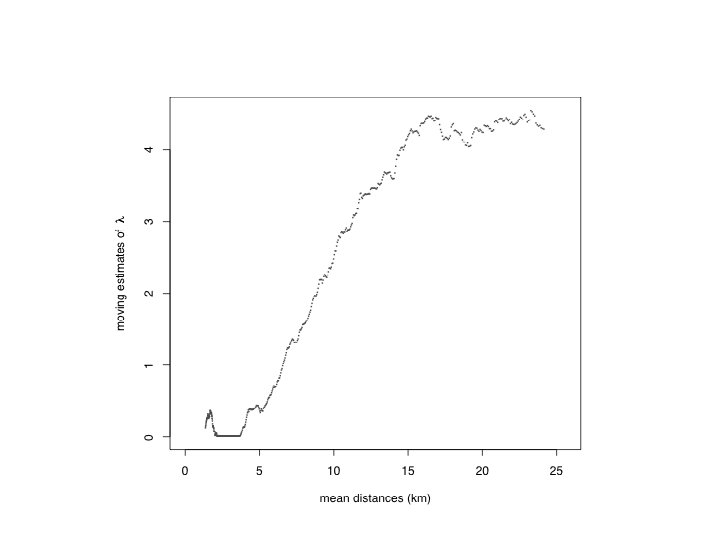
In ETAS (Ogata 1998), l(t, x, m) = f(m)[m(x) + ∑i g(t-ti, x-xi, mi)], where f(m) is exponential, m(x) is estimated by kernel smoothing, and i. e. the spatial triggering component, in polar coordinates, has the form: g(r, q) = (r 2 + d)q. Looking at inter-event distances in Southern California, as a function of the direction qi of the principal axis of the prior event, suggests: g(r, q; qi) = g 1(r) g 2(q - qi | r), where g 1 is the tapered Pareto distribution, and g 2 is the wrapped exponential.
ETAS: no use of focal mechanisms. Summary of principal direction of motion in an earthquake, as well as resulting stress changes and tension/pressure axes.
tapered Pareto / wrapped exp. biv. normal (Ogata 1998) Cauchy/ ellipsoidal (Kagan 1996)
Thinned residuals: Data Cauchy/ ellipsoidal (Kagan 1996) tapered Pareto / wrapped exp. biv. normal (Ogata 1998)
Tapered pareto / wrapped exp. Cauchy / ellipsoidal