Welcome to TIMS Reports Class Overview Geographic Reports



- Slides: 120

Welcome to TIMS Reports

Class Overview • Geographic Reports – Street Listings – Traffic Listings • Overview of Report Features – Student Counts • School Grade number of students registered at each school broken down by grade • Eligibility Report totals per school based off of eligibility codes – default = 0 – Riders Report • Total number of riders AM & PM • Longest ride times • • • Structure of TIMS Data Understanding Queries and Worklists Standard Reporting (Reprocess your runs) User Defined Reports Practice Reporting options – Edit queries, Edit sort order, Edit forms – Creating and modifying Excel files • Blackboard • Powerschool extract • • Boundary Listings (Inside and Outside boundaries) Worklists 2

Overview of Report features: The Reporting Module used for TIMS is Accessed via the Launch Pad or through the Edulog-Advanced program. 3

Geographic Reports: Some Geographic Report options are: Street Name Listing, Overlapping Segments, Traffic Listing, Boundary Listing. They are informational reports pulled from Maris Today I would like to cover the Eligibility Listing and Stop Range Reports because I feel that they can helpful to your data managers and office staff.

School Grade Report/Elg Report ALWAYS update your data when you change your report options. 5

Geographic Reports 6

Geographic Reports Eligibility Listing: Great for Data Managers to see streets posted in their school boundary. 7

Geographic Reports Stop Range Reports – Great tool for office staff to use for a quick reference for stop location and time. 8

Overview of Report features: Student Counts Produces a report listing the numbers of students at each of the schools in your system. You can produce student counts broken down by grade or by transportation eligibility code. 9

Students Enrolled by School Grade Note at the bottom you will see a total of all grades levels. Example on this report you have a grand total of 478 1 st graders. This is an excellent report to compare your before and after upstu totals. 10

Reporting Enrolled Toolbar by School Students 11

Eligibility Data by School Student Counts Can also produce a transportation eligibility code report. 12

Eligibility Data by School 13

Eligibility Data by School Student Eligibility Codes You can produce student counts broken down by transportation eligibility code. If you don’t select a code it will default to 0. 0 = within eligible school boundary. On the report it is broken down by Assigned and Not Assigned to a stop. This information is populated by your school boundaries. 14

Overview of Report features: Student Ride Times Produces a report showing the number of assigned bus riders in TIMS for each School, by AM and PM Assignments. Also tallies ride times for students – AM, PM or Total Ride Time 15

Overview of Report features: Always update the report first Student Riders Produces a report showing the number of assigned bus riders in TIMS for each School, by AM and PM Assignments. 16

Overview of Report features: Student Ride Times 17

Understanding Reports • Understanding the Structure of the TIMS Data 18

Structure of the TIMS Data 19

Structure of the TIMS Data • When creating reports you are pulling information from “tables” • Each table is unique and has unique ID numbers • See below In this table the unique ID number is the Edulog number that stores Student Information. There is also tables for stops, runs, routes, schools, etc. 20

Structure of the TIMS Data SCHOOL STOPS STUDENTS RUNS ROUTES 21

Structure of the TIMS Data Structure of the 22

Structure of the TIMS Data/Launchpad Structure of the Data View 23

Structure of the TIMS Data/e. SQL View 24

Reporting Data Reports give us the ability to pull information off of the TIMS data. This information is very useful for students, miles, stop info, rider info, pickup and drop off time, bus numbers, name a few. 25

Structure of the TIMS Data For example: The School tab would have a unique ID of the School ID. (332) When creating our report most of them will pull from Run Id & Route ID. 26

Reporting Understanding Queries and Worklists 27

Understanding Queries and Worklists • A query or worklist is a statement or a group of statements that return a value. 28

Understanding Queries and Worklists • Select all apples = “RED” • How many apples would you have? Writing queries for riders, stops and runs is similar to the above statement. The difference would be the Variables or field names, instead of apples you would select stopid, runid, school code, etc. 29

Understanding Queries and Worklists • Queries are statements or conditions 30

Understanding Queries and Worklists • Operators 31

Understanding Queries and Worklists • Connectors of AND/OR – be careful how you position the connectors. The outcome can be very different depending on how you use them. 32

Understanding Queries and Worklists • Connectors of AND/OR At this time you can NOT use the OR connector in e. SQL. Most of my queries are done in the reporting module off of launchpad. 33

Connectors of AND/OR In this case all conditions must be true. 34

Connectors of AND/OR School = 302 AND Your last name = Smith (Any grade) OR Your in Grade 13 Note: School code of 111 (OR GRADE = 13) 35

Connectors of AND/OR • Changed the parentheses but kept the connectors the same. NOTE – No school 111 36

Understanding Queries and Worklists • Values can be asked now or later when running the query. You can also use an existing worklist. 37

Reporting Standard Reports vs. User Defined Reports 38

Standard Reports vs. User Defined Reports Standard: Structured menu system that lets you select some parameters for reports. Select subject (stops, runs, etc. ), filter, and sort order. No control over field selection, grouping, or report layout. User Defined: Prepared reports, ready to run as they are or be customized. Nearly total user control over all aspects of report design: subject (stops, runs, etc. ), filter, sort, field selection, grouping, and report layout. 39

Reporting Tip Standard Reports provide a variety of pre-made reports and options you can select from. Please look through each Standard Report as there may be a few that are very close to what you would like. Many of the reports contain additional information you may not be interested in (ex: Power. School ID) or would not like to display in the report. But each Standard Report can be customized within the User-Defined Reports section to add/remove any pieces of data to better meet the needs of your district. Also, if you would like data from a report imported into a spreadsheet, you can accomplish this within User. Defined Reports as well. Find/Copy the Standard Report and then Modify it for export into Excel. 40

REPROCESS RUNS • Remember to REPROCESS ALL RUNS before running reports 41

REPROCESS RUNS The easiest and fastest way is to go to your Runs – Group Processes - Directions 42

REPROCESS RUNS WITH A WORKLIST 43

Standard Reporting 44

Standard Reporting Selecting a report type will bring up sub menus for those reports The Menu on the left lets you filter the reports by type or topic • • Students Stops Runs Routes • Schools • Boundaries 45

Standard Reporting Lets start by looking at the Standard Run Report named With Stop and Student Info Choose the selected report and click Edit Filter 46

Reporting Tip • As you can see this query will select all the runs in your database. We want to change that to reflect RUNID = 308. 001 47

Reporting Tip Filtering a Report is a 3 Step Process: 1) Pick the Field you want to filter by (Run ID) 2) Pick an Operator (begins with, exactly matches, or is within a list, etc. ) 3) Enter the Value for your filter (typically a school code, a Run ID or a Route ID) 48

Standard Reporting This is the Standard Run Report with Stop and Student Info It shows the Stop Description, Stop Time, Passengers at each stop as well as the accumulated miles and accumulated student counts. 49

Standard Reporting Next we will look at a different report and then modify the way the data is sorted within the report itself. Under Standard Run Reports, select the Passenger Lists report and Run Query Be Sure to Change the Filter Again for only Run 308. 001 50

Standard Reporting • The report is defaulted to sort by Last, First. We want to change it to sort by Grade, Last, First. 51

Standard Reporting To change the sort order click on the option below. The default sort order is Run Id, Last Name, First Name 52

Standard Reporting Modify the Sort Order so the Passenger List is sorted by the Student’s Run. ID, Grade, Last, First. Double click to add this variable to the Fields to Sort by list Using the gray box with the arrows to the left of the variable name to drag Stop Sequence so it is the second variable to sort by, then click Done. Now run the query and notice how the report is sorted differently. Students are now listed by Run Id, Grade, Last, First. 53

Standard Reporting • Sorted by Run. ID, Grade, Last, First 54

Standard Reports • Questions about Report Filters? • Choose Field • Choose Operator • Enter Value to Filter By • Questions about Report Sort Order? • Add/Remove Fields from Sort Order • Drag Fields Up and Down Sort Order List 55

Standard Reporting – end notes • The Standard Reports option is great for generating reports that require typical or general information. • More complex data outputs or modifying a Standard Report to add/remove information will require the use of User Defined Reports 56

User Defined Reports • How to Copy and Modify Existing Reports • Add/Remove Fields 57

User Defined Reporting A couple of things about the Standard Reports that are listed under USER DEFINED * reports: – The list of reports starting with the word ‘Standard’ are the very same reports you access through the Standard Reports Module – They are templates that cannot be run or modified, only copied, renamed and then edited. – The name of your copied report cannot begin with the word ‘Standard’ – Once copied, the report can be run as-is, or modified and saved to a new form or excel file – You can go back to the original ‘Standard’ report and copy it again as often as you like. 58

User Defined Reporting User Defined Reports are categorized into different sections. It can be tricky to find the Standard Report you like and want to begin editing. It takes regular use and experience to know which section contains the report you seek. Just look around the different sections and you’ll find it. 59

User Defined Reporting Schools Produces reports that contain information on the schools in your system. With these queries, you can examine bell times, grades and programs for schools, as well as school boundary and eligibility information. 60

User Defined Reporting All Student and Transportation Produces reports on students with transportation assignments. You can produce a list of students, or you can generate bus passes with these queries. 61

User Defined Reporting Students with Trips Produces reports on students in your system. If you select only student fields for this report, you can obtain a listing of all the students in the database. If you select any trip fields, you will get only those students who have trips assigned. You can examine regular education students, special education students, and unmatched students (students whose addresses do not match the geocode) with these queries. You can also produce reports on the numbers of students at schools in your system. 62

User Defined Reporting Student Transportation Produces reports with various combinations of student and transportation information (on stops, runs, and routes). You can produce passenger lists and student eligibility reports with these queries. 63

User Defined Reporting/Student Transportation Standard Trip Ticket (portrait print) 64

User Defined Reporting Stops / Runs / Routes Produces reports with various combinations of information on stops, runs, and routes in your system. You can produce reports on run and route mileage and average speeds with these queries. 65

User Defined Reporting Inactive Stops Produces reports on stops that are not assigned to runs. You can also examine information on students assigned to such stops with these queries. Stops that are inactive. Vehicles Produces reports on the vehicles in your district’s transportation fleet. 66

User Defined Reporting Bus Passes Produces bus pass reports which list various types of transportation information for bus riders. While you can create your own bus pass reports, you may find it easier to make a copy of one of the existing Bus Pass queries and modify the copy as desired. Also produces a report for students stop not on a route. ***Use Bus Passes when you want a students transportation information to show up on one line in excel or report. *** 67

TDTIMS Reports • Use your Diagnostic Reports to help you find issues with your data. A good tool to use during the year to help clean your data up. 68

Diagnostic Reports • User Defined Reports/All Student and Transportation Reports 69

Diagnostic Reports • User Defined Reports/Stops/Runs/Routes Reports 1. Neg Time between Runs 2. Time and Mile Summary – great tool to use to compare with Synovia to check real time to TIMS 3. Before 6: 00 and 5: 00. Use to clean runs up and make sure not zig-zagging. 70

Diagnostic Reports User Defined -Reports/Stops/Runs/Routes Reports Quick look at number of buses assigned in TIMS. Compare to actual buses on the road. Do you have buses in TIMS that do not have runs attached. If they are not being used please take them out to avoid reporting errors. 71

Let get started • User Defined Reporting • Practice Time 72

User Defined Reporting/Practice Go to User-Defined>Student Transportation “Standard Passenger Lists for Runs” report As you can see the report is sorted by last, first. We want to change the sort option by pickup time. 73

Practice • This is what the report should look like. 74

User Defined Reporting/Passenger List • • • Go to User-Defined>Student Transportation Find and Highlight the “Standard Passenger Lists for Runs” report Choose Copy Rename the report “Your. Name Passenger List” Now highlight the Passenger List and choose “Edit” to open the report. 75

Practice – Change School to 308 Change run Run. ID to begins with 308 • This will pull any run that starts with school 308 76

User Defined Reporting The default Output Fields include all of the information visible in the Standard Report we copied. For this example, we want to add two additional variables that could be included in this report. Stop Sequence Time at Stop 77

User Defined Reporting The default Sort Order for this Passenger List: by Run ID, Last, First. We want to include Stop Sequence here so the Passenger List is Sorted by the Order students get on/off the bus. Add STOP SEQUENCE - Drag Stop Sequence up in the sort order so it is second on the list of variables. 78

User Defined Reporting If you run the query now, the passenger list displays students in the order they get on/off the bus. However, the Student Power. School ID is still being displayed in the report. Our next step is to replace the District ID with Time at Stop 79

User Defined Reporting When you choose Run Query, the Setup for Form Layout Report window appears. Under Output Direction, the report is defaulted to Run to the Screen so you can view the report before you print it. If you want to modify the report (to include/exclude any data) or to add/replace any data within the report, choose Edit Form from this window. To open the Report Designer interface. 80

User Defined Reporting The Report Designer interface shows you the default layout of the report and how each section of the formatted report will be displayed. Title Section, Page Headers, Grouped Data, Group Footers and Page Footers, etc. Depending on the Standard Report you originally copied, you may have multiple sections you can redesign. 81

User Defined Reporting Under the View menu, choose Table Designer. The Table Designer lists the name of all of the fields included under Edit Output Fields. Please note how each field included is coded/named a certain way. If you want to add a field to the report, you will need to know the exact field name as it is listed under Table Designer. 82

User Defined Reporting Under Page Header, locate the purple label “District ID” and double click it. This will display the Label Properties window where you can edit the default label. Change it from District ID to Time at Stop. 83

User Defined Reporting Under Group Header 1, find the black box “RIGHT(stu_districtid, 12)” and double click it. This will display the Field Properties window where you can edit the field or variable that you want displayed. Change it from Power. School ID to Time at Stop Delete “RIGHT(stu_districtid, 12)” and replace this with “TTOC(runsrv_timeatsrv, 2)” 84

User Defined Reporting Stop Times in TIMS-SQL include a generic date of 01/01/1900. So to remove the dates from being displayed, you must include some programming language to exclude the date. TTOC stands for Time To Character and “, 2” tells the system to only display the time part of the full Stop Time Field 85

User Defined Reporting Before you save the modifications to the report, you should view a preview of the report to make sure you made the edits correctly. Under View, Choose Preview to preview the modified report. The report should now show Time at Stop instead of District ID 86

User Defined Reporting Use the “Under X” to close out the Print Preview and return to the main page of the Report Designer. Continue to Make Edits to the Report and Preview as Needed to verify your edits were made correctly. When you are finished, use the “Under X” to close the report designer. The system will ask you if you want to save changes to the Report Designer – if so, choose Yes 87

User Defined Reporting All of the edits we just completed are now saved within the Your. Name Passenger List Report. However the filter is set for Runs that start with 308 If you wanted to produce this report for other Bus Runs in TIMS, you would need to edit the filter every time. Let’s make some edits to the Report filter to make it easier when needing to run this report for other Bus Runs in the future. Choose Edit Record Filter and let make some modifications. 88

User Defined Reporting Change the Operator to “Is within a list” This will allow you to choose which Run(s) you want to print. Save and Exit when finished. 89

User Defined Reporting Now the report asks you to select the Run(s) each time you wish to produce this report. 90

User Defined Reporting • Most LEAs would like for each Passenger List to start on a new page, so let’s learn how to add a page break with each new Run ID 91

User Defined Reporting Choose Run Query from the Report Main Menu and then Edit Form from the Setup for Form Layout box. Report - Data Grouping - Page Break editor 92

User Defined Reporting Adding Page Breaks Modifying Data Groupings for Page Breaks When editing a Report, you can add page breaks so the next run or school or student will start at the top of the next page. Under Report>Data Grouping , you can tell the system when you want the page break to begin. The default list of variables are on the left and each has their own command to start on a new page or on a new line within the report. You may need to add other variables here if they are not included in the default options. Make sure you select the Screen option. 93

User Defined Reporting To set Page Breaks in a report, reopen the Report Designer The default page break is for the next Run ID to start on a New Line. Simply choose “New Page” to tell the report to add a page break and start the next Run ID on a New Page. Click Ok to update the page break command. View>Preview to check you edits before you Save and Close the Modifications. 94

User Defined Reporting • The Passenger List for each Run ID should now start on it’s own page 95

Practice Session – Copy the Passenger List we created and Rename it to “Passenger List with Phone” – Then Edit the report and add Home Phone (aka Student Primary Phone) – Add “Primary Phone” to the Output Fields – Edit the Report and add Phone # after name – Add the Displayed Variable and the Label too 96

Creating an excel file • How do I get the same information off the report and into an excel? 97

Creating an excel file Take note of the file path. D: REPORTSQMF_BONNIE Run your report and check The D: Reports to find your report. 98

Practice Lets create a blackboard excel file. Many counties use this information to pull student transportation information to send out messages for late buses or accidents. 99

Practice creating a blackboard excel file • User Defined Reports => Bus Passes • Make a copy of – Standard student with trip information – This will select all your students in TIMS and put all their information on one line. – Make sure you select excel for output. 100

Creating an Excel file • Modify the file to display the fields below: Fields Listed: Student. District ID Student School Student HR Student Grade Student Last Name Student First Name Trn AM Stop Description Trn Am Time at Stop Trn AM Route ID Trn PM Stop Description Trn PM Time at Stop Trn PM Route ID Sort By: Student School Student Grade Student HR Student Last Name Student First Name 101

Creating an excel file As you can see it is listing a lot of students who do not have bus assignments. We can edit the filter to take them out 102

Creating an Excel file • Once you add Trn AM Run ID is not empty or Trn PM Run ID is not empty it will remove all the students who do not have a bus assignment. 103

Powerschool Extract • How do I create a Powerschool Extract? • This file can be uploaded into Powerschool with the TIMS transportation data? • Most counties already have this option in All Student and Transportation 104

Powerschool Extract • Reports – User Defined Reports • All Student and Transportation Reports – Power. School Extract Fields needed in the file Path D: PowerschoolPower. School Extract Excel File 105

Powerschool Extract • The Powerschool excel file will have to be modified before you can import it into Powerschool. • Column 1 and 2 need to be adjusted. 106

Powerschool Extract • Highlight the 1 st line of the ID numbers • Go to the bottom and shift click • Go back to the top and click on the ! and convert to a number • This will remove any leading zeros 107

Powerschool Extract • We must convert 1 – To and 2 – From • Find all 1 replace with To • Find all 2 replace with From 108

Powerschool Extract • Convert the column names to the following: Save file in a CSV format Now your ready to import it into Powerschool 109

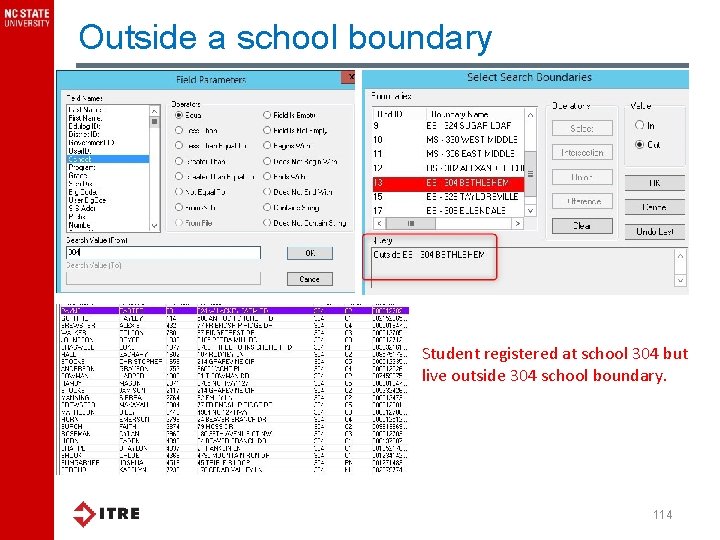
Boundary Listings • Sometimes Administration will need a list of students who live in or outside a boundary. 110

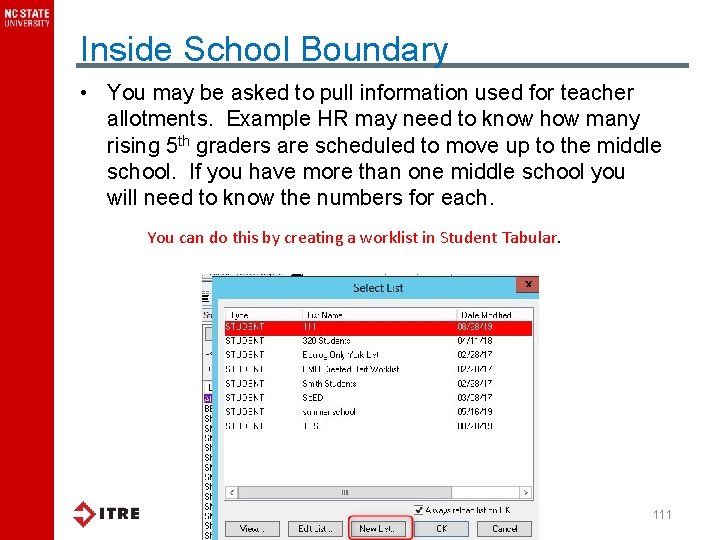
Inside School Boundary • You may be asked to pull information used for teacher allotments. Example HR may need to know how many rising 5 th graders are scheduled to move up to the middle school. If you have more than one middle school you will need to know the numbers for each. You can do this by creating a worklist in Student Tabular. 111

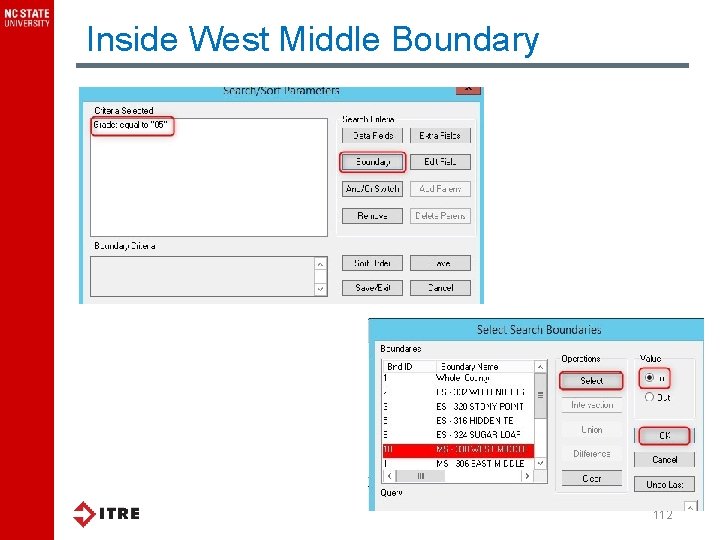
Inside West Middle Boundary 112

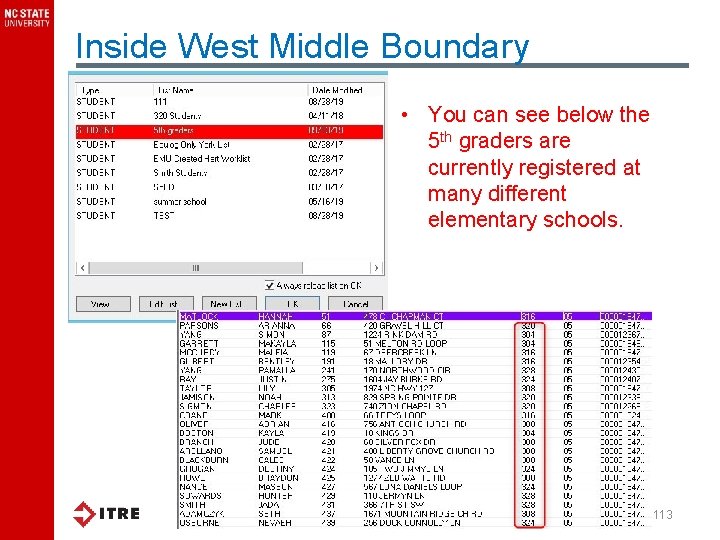
Inside West Middle Boundary • You can see below the 5 th graders are currently registered at many different elementary schools. 113

Outside a school boundary Student registered at school 304 but live outside 304 school boundary. 114

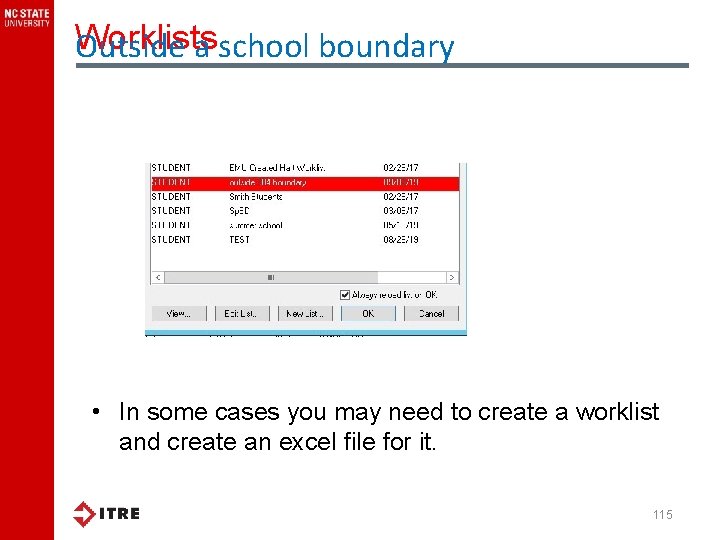
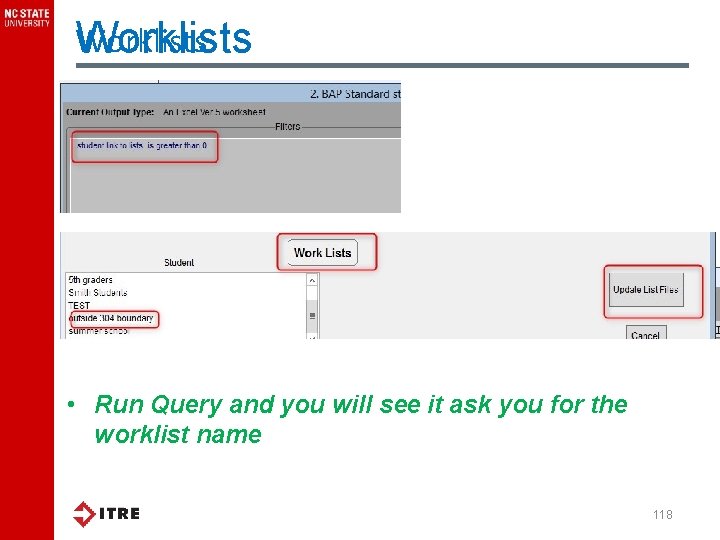
Worklists Outside a school boundary • In some cases you may need to create a worklist and create an excel file for it. 115

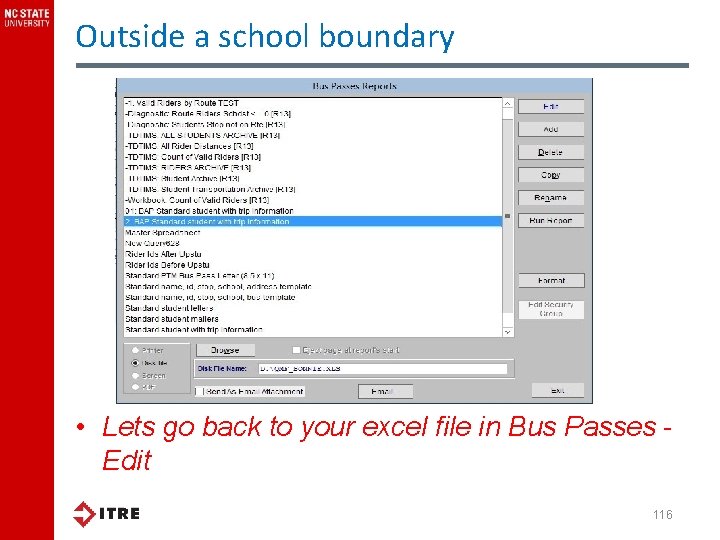
Outside a school boundary • Lets go back to your excel file in Bus Passes Edit 116

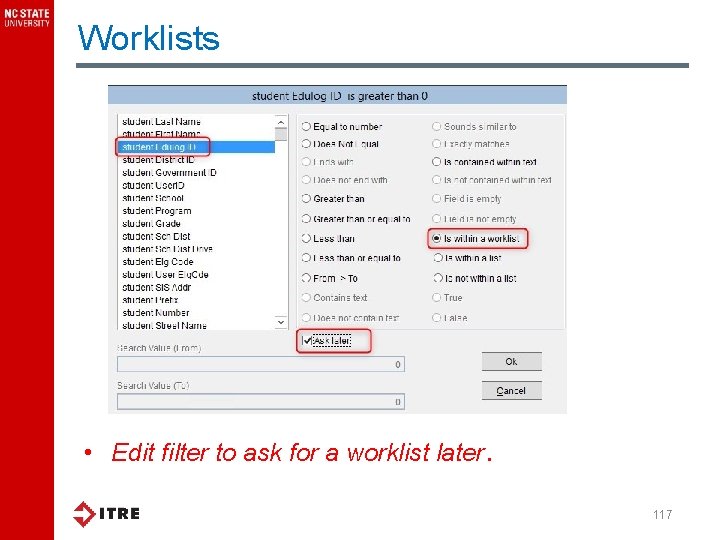
Worklists • Edit filter to ask for a worklist later. 117

Worklists • Run Query and you will see it ask you for the worklist name 118

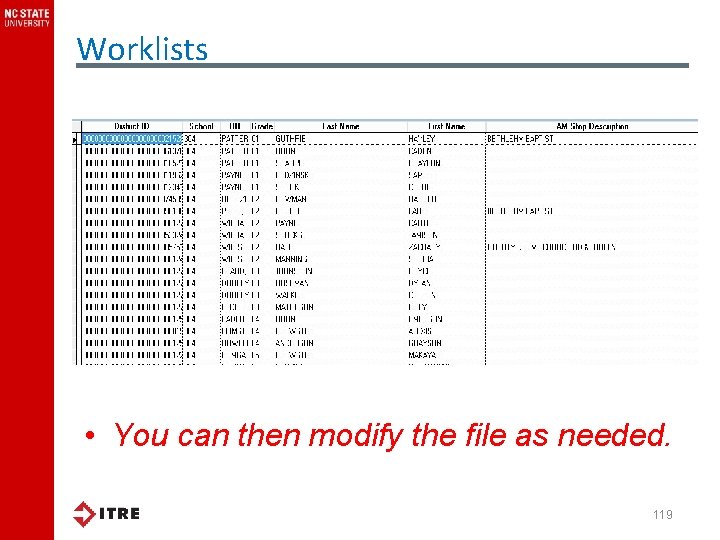
Worklists • You can then modify the file as needed. 119

Questions?