TUAT Growth of chalcopyrite type magnetic semiconductors K


![EDX Mn flux [Torr] Sample#1 Sample#2 2. 0× 10 Ge flux [Torr] -8 -8 EDX Mn flux [Torr] Sample#1 Sample#2 2. 0× 10 Ge flux [Torr] -8 -8](https://slidetodoc.com/presentation_image_h/31533ec58617813eef9bcb47b4e86a6a/image-38.jpg)
![Sample#3 Mn flux [Torr] Ge flux [Torr] TBP flow rate [sccm] Growth Temp. [℃] Sample#3 Mn flux [Torr] Ge flux [Torr] TBP flow rate [sccm] Growth Temp. [℃]](https://slidetodoc.com/presentation_image_h/31533ec58617813eef9bcb47b4e86a6a/image-39.jpg)


![Intensity [cps] XRD Patterns 10 6 10 5 10 4 10 3 10 2 Intensity [cps] XRD Patterns 10 6 10 5 10 4 10 3 10 2](https://slidetodoc.com/presentation_image_h/31533ec58617813eef9bcb47b4e86a6a/image-42.jpg)


- Slides: 46

TUAT Growth of chalcopyrite type magnetic semiconductors K. Sato, T. Ishibashi, V. Smirnov, H. Yuasa, J. Jogo, T. Nagatsuka, Y. Kangawa and A. Koukitu

Scope of this talk • Brief summary of previous studies of chalcopyrite type magnetic semiconductors • Results of in-situ photoelectron spectroscopy • Suggested existence of chalcopyrite Mn. Ge. P 2 • Thermodynamic analysis • MOMBE growth of Mn. Ge. P 2 • Characterization

Brief summary of previous studies of chalcopyrite type magnetic semiconductors • We have been working with Mn-substituted chalcopyrite type semiconductors Cd. Ge. P 2 and Zn. Ge. P 2, in which we have confirmed ferromagnetic behavior up to 423 K and 350 K, respectively. Magneto-optical effect was also observed. • These samples were obtained by deposition and subsequent diffusion of Mn to bulk single crystals of ternary compounds. • Ab-initio calculation suggests that Cd. Ge. P 2 system with vacancies or non-stoichiometric composition will lead to ferromagnetism although ferromagnetism is not favored in stoichiometric (Cd, Mn)Ge. P 2.

Chalcopyrite Structure Si, Ge Diamond structure IV III II V IV VV Ga. P Zincblende structure Cd. Ge. P 2 Chalcopyrite structure Cd Ge P

II-IV-V 2 chalcopyrites a(Å) c(Å) Tm(°C) Eg(e. V) n o, n e n, p ~3. 1 260, 11 Zn. Si. P 2 5. 399 10. 435 1370 2. 96 Zn. Si. As 2 5. 606 10. 890 1096 2. 12 3. 355, 3. 392 40, 170 Zn. Ge. P 2 5. 465 10. 771 1025 2. 34 3. 248, 3. 295 - , 20 Zn. Ge. As 2 5. 672 11. 153 850 1. 15 ~3. 38 - , 23 Zn. Sn. P 2 5. 651 11. 302 930 1. 66 ~3. 21 - , 55 Zn. Sn. As 2 5. 852 11. 705 775 0. 73 ~3. 53 - , 190 Cd. Si. P 2 5. 678 10. 431 1120 2. 45 ~2. 95 150, 90 Cd. Si. As 2 5. 884 10. 882 850 1. 55 ~3. 22 - , 500 Cd. Ge. P 2 5. 741 10. 775 790 1. 72 3. 356, 3. 390 1500, 80 Cd. Ge. As 2 5. 943 11. 217 670 0. 57 3. 565, 3. 678 4000, 1500 Cd. Sn. P 2 5. 900 11. 518 570 1. 17 ~3. 14 2000, 150 Cd. Sn. As 2 6. 094 11. 918 596 0. 26 ~3. 46 11000, 190

Cd. Ge. P 2 -Mn Magnetization (VSM) 77 K K. Sato et al. : J. Phys. Chem. Solids 64(2003)1461 287 K 423 K

Zn. Ge. P 2 -Mn Magnetization (SQUID) 5 K K. Sato, G. Medvedkin, T. Ishibashi: J. Cryst. Growth 236 (2002) 609 150 K 350 K

Magneto-Optical Kerr Effect 0. 05 K, K (deg) 0. 00 -0. 05 K K K -0. 10 -0. 15 1 1. 5 2 2. 5 3 3. 5 Photon Energy [e. V] 4 K. Sato et al. : J. Magn. Soc. Jpn. 25 (2001) 283. 4. 5

Previous preparation method for chalcopyritetype magnetic semiconductors • Mn was deposited on single crystals of Cd. Ge. P 2 and Zn. Ge. P 2 at Tsub 400 C, by which Mn was diffused into the bulk to substitute group II and IV cations. • During growth RHEED pattern of chalcopyrite structure seems to remain. • Mn-diffused crystals show ferromagnetism above room temperature.

II-IV-V 2 single crystals • Cd. Ge. P 2{112} • Directional freezing of the stoichiometric melt in a quartz ampoule or graphite crusible • Rate: 4 deg/h for 48 h • Highly compensated ntype • Prepared at Ioffe Inst. • Zn. Ge. P 2(001) • Vertical bridgeman technique • Bulk ingot of 28 mm and 150 mm in length • Highly compensated ptype • Prepared at Siberian Physico-Technical Inst.

Preparation of Mn-doped chalcopyrites II-IV-V 2 single crystal Host crystal: Cd. Ge. P 2, Zn. Ge. P 2 Mn II-IV-V 2 single crystal Mn-diffused layer II-IV-V 2 single crystal Mn deposition Tsub=RT to 380 -400°C Mn diffusion @T=300 -500°C

RHEED patterns during Mn deosition Zn. Ge. P 2 During depo. After annealing 550℃30 min. Tsub. = R. T. Tsub. = 400℃

Problems • Inhomogeneous depth profile of Mn obtained by the deposition-diffusion technique. • Electrical properties of the surface shows a metallic behavior. • Preparation of homogeneously Mn-doped layer is necessary. Effort to obtain Cd. Ge. P 2: Mn thin films by MBE is proceeding

Inhomogeneous depth profile of Mn in Cd. Ge. P 2: Mn

Careful preparation necessary • Synthesis of bulk or powder Cd. Ge. P 2: Mn from constituent elements was tried. However, It was difficult to prevent formation of second phase compounds. • In bulk Zn. Ge. P 2: Mn prepared at elevated temperature, room-temperature ferromagnetism is suspected as due to Mn. P precipitated in the material. • Careful preparation of films with homogeneous distribution of Mn is strongly required.

Magnetic properties of bulk Zn. Mn. Ge. P 2 • Preparation by solid state reaction of Zn+Ge+Mn+P at max 1130 C • Antiferromagnetism below 47 K • Ferromagnetism between 47 and 312 K MT curve MH curve Mn 3% Cho et al. Phys. Rev. Lett. 88 (2002)257203 MH curve Mn 5. 6%

NMR studies in Zn. Mn. Ge. P 2 • Very small amount of Mn. P phase that cannot be found by XRD was detected by NMR in polycrystalline Zn. Mn. Ge. P 2 material prepared by the same method as did by Cho. Zn. Mn. Ge. P 2 Mn 15% Mixture of Zn. Ge. P 2 and Mn. P Hwang et al. : Appl. Phys. Lett. 83 (2003) 1809

In-situ photoelectron spectroscopy • Photoelectron spectrometer with MBE system With Ar-ion etching device • Synchrotron radiation: Photon Factory BL-18 A • Specimen: Zn. Ge. P 2 single crystal, polished and etched • Deposit Mn and interrupt to measure PES • After deposition of 50 nm Mn, sputter-etched by Ar-ion and at each stage PES was measured

Photoemission Apparatus at Photon Factory BL-18 A Thermocouple Radiation E~100 me. V Mg Ka X-ray E~800 me. V 1 cm Heater Mn evaporator (Omicron EFM-4) 99. 999%Mn Thickness monitor P<5 x 10 -9 Torr (sample growth) P<7 x 10 -10 Torr (PES measurement) Ion gun 1. 5 k. V Ar+ Cleaning the substrate Sputtering out the surface layer

T = 400 C (const. ) 0 < d < 510Å Intensity (arbitrary units) PES during deposition end Mn. Ge. P 2? Mg Ka Zn. Ge. P 2: Mn start 結合エネルギー (e. V)

Core signal intensity 3. 0 Mn 堆積 2. 5 内殻電子放出強度 (arb. units) P 2 p 2. 0 Mn. Ge. P? 1. 5 Ge 3 d 1. 0 Mn 2 p 0. 5 No Zinc Zn 2 p 3/2 0. 0 1 0 2 3 4 5 6 7 10 名目上の Mn層厚 (A) 100 2 3 4 5

PES during sputter Intensity (arbitrary units) End sputter Start sputter T = 400 C d = 250Å Binding energy (e. V) Mg Ka

Core signal intensity during sputtering Mn-rich composition Zn: Ge: P ~ same as substrate composition Core-level intensity ratio Mn 2+compounds (DMS phase) Total sputtering time (min. )

Magnetization (by SQUID magnetometer) MPMS

Suggested existence of chalcopyrite Mn. Ge. P 2 • Photoemission The surface composition is Mn. Ge. P 2 • RHEED pattern of initial chalcopyrite structure remained during growth Is chalcopyrite-type Mn. Ge. P 2 really exist?

MOMBE growth of Mn. Ge. P 2 • We applied MOMBE technique to obtain Mn. Ge. P 2 films on Ga. As substrate. • Mn and Ge are supplied from solid state source using K-cells • As P source, TBP (tertiary butyl phosphine) MO source is employed. • TBP is cracked to form P 2 and P 4 using cracking cell at 813 C

Thermodynamic analysis for MOMBE growth of Mn. Ge. P 2 • To know whether Mn. Ge. P 2 can be obtained as a stable compound using the MOMBE technique, thermodynamic analysis is performed.

Driving force for deposition • In thermodynamic analysis, we used parameters of driving force for deposition P, Input partial pressure, P 0, and equilibrium partial pressure at vapor-solid interface, P. • Here, driving force for deposition P is the difference between input partial pressure and equilibrium partial pressure : P=P 0 -P; where P 0 is input partial pressure, and P equilibrium partial pressure • Using these parameters, we can obtain Input mole ratio, RMn, and solid composition, x, as follows:

Driving force for deposition, P P 0: Input partial pressure Boundary layer P 0 P=P 0 -P P Distance X Driving force for deposition, P Substrate surface Partial pressure P: Equilibrium partial pressure

MOMBE • Here, we assume P 2 • Mn(g)+1/2 P 2(g) = Mn. P(s) molecule as a group. V source, because • Ge(g)+1/2 P 2(g) = Ge. P(s) more than 80% of Conservation constraints TBP is cracked and 0 0 • PMn+Ge -PMn+Ge= 2(PP 2 -PP 2) changed to P 2 rather than P 4 at 813 C. • Pi = PMn+PGe+PP 2 Equilibrium equation for reaction using these equations equilibrium partial pressure, which is unknoun parameter, is calculated.

Ab-initio calculation of enthalpy of mixing • Enthalpy of mixing Hm Hm=EMn. Ge. P-{x. EMn. P+(1 -x)EGe. P} • Interaction parameter = Hm/x(1 -x) • Solid composition x x= PMn/( PMn+ PGe) vs Input molar ratio of Mn RMn=P 0 Mn/(P 0 Mn+P 0 Ge)

enthalpy of mixing of (Mn, Ge)P as a function of solid composition • The function, Hm, is estimated from the ab initio total energy calculations for structure models.

Ab-initio calculation • Ab initio calculations using CASTEP code – Task: Geometry optimization – Electron correlation: GGA – Energy cutoff: 240 e. V Ge. P Mn 0. 5 Ge 0. 5 P Mn Ge P

Stable Formation of Mn. Ge. P 2 • It is found, in the graph, that enthalpy of mixing has negative value. • This is because the chalcopyrite structure with x=0. 5 becomes stable compared with random alloy

Interaction parameter W=DHm/x(1 -x) From the calculated enthalpy of mixing, Hm, we estimated interaction parameter, W, to be 3044 x 33726 [cal/mol]. Using this function, we carried out thermodynamic analyses and examined the relationships between input mole ratio and solid composition.

Vapor/solid distribution relationship • Here, thermodynamic calculations were performed under the following conditions; PMn 0+PGe 0=1. 0 x 10 -7 torr PP 20=2. 0 x 10 -7 torr • It is found, in the graph, that small input mole ratio is required to make Mn. Ge. P 2 at higher Mn. Ge. P 2 temperatures. • This is because that Mn. P bond is easily formed compared with Ge-P bond.

Crystal Growth Conditions -8 Base pressure @3. 0× 10 Torr Pump C. C gauge Substrate @SI-Ga. As(100) Just (Etched by H 20+H 2 O 2+NH 3) Growth temperature @360, 415℃ Substrate Flux intensity: Flux monitor -8 Mn @2. 0× 10 Torr (K-cell temp. @725℃) REED Screen -8 Ge @1. 3, 2. 1× 10 Torr (K-cell temp. @1035, 1060℃) TBP flow rate @1. 6 sccm (Cracking temp. @813℃) Deposition time @20, 60 min Cd (Solid) TBP (Gas) Mn Ge
![EDX Mn flux Torr Sample1 Sample2 2 0 10 Ge flux Torr 8 8 EDX Mn flux [Torr] Sample#1 Sample#2 2. 0× 10 Ge flux [Torr] -8 -8](https://slidetodoc.com/presentation_image_h/31533ec58617813eef9bcb47b4e86a6a/image-38.jpg)
EDX Mn flux [Torr] Sample#1 Sample#2 2. 0× 10 Ge flux [Torr] -8 -8 2. 1× 10 1. 3× 10 -8 -8 TBP flow rate [sccm] Growth Temp. [℃] Depo. time [min] 1. 6 360 20 #1 Mn Ge P 0. 99 1. 00 2. 67 Mn Ge P 2. 09 1. 00 5. 20 #2
![Sample3 Mn flux Torr Ge flux Torr TBP flow rate sccm Growth Temp Sample#3 Mn flux [Torr] Ge flux [Torr] TBP flow rate [sccm] Growth Temp. [℃]](https://slidetodoc.com/presentation_image_h/31533ec58617813eef9bcb47b4e86a6a/image-39.jpg)
Sample#3 Mn flux [Torr] Ge flux [Torr] TBP flow rate [sccm] Growth Temp. [℃] Depo. time [min] 2. 0× 10 -8 1. 6 415 60 #3 Mn Ge P 1. 03 1. 00 1. 89

SEM Observation Sample#1 400 nm Sample#2 300 nm Sample#3 400 nm

Sample#1 800 nm Sample#2 800 nm Sample#3 800 nm
![Intensity cps XRD Patterns 10 6 10 5 10 4 10 3 10 2 Intensity [cps] XRD Patterns 10 6 10 5 10 4 10 3 10 2](https://slidetodoc.com/presentation_image_h/31533ec58617813eef9bcb47b4e86a6a/image-42.jpg)
Intensity [cps] XRD Patterns 10 6 10 5 10 4 10 3 10 2 Sample#3 Sample#1 Sample#2 65. 6 65. 8 66 66. 2 2θ [deg] 66. 4

Ga. As(004) XRD Measurement Detailed XRD study is Mn. Ge. P 2? underway Ge. P? Mn. Ge. P 2 –narrow scan ① 1. 72: 1. 00: 2. 99 (1 h)

Magnetic Properties 10 6 Perpendicular Sample#3 4 ・VSM ・Room Temp. 2 0 -2 -4 -6 14 -8 12 -10 10 H (Oe) Parallel 8 M (10 -5 emu) 8 6 4 2 0 -2 -4 -6 -8 Mn; 1. 03 Ge; 1. 00 P; 1. 89 -10 -12 -14 H (Oe)

Polar Magneto-optical Spectra in Mn. Ge. P 2

Summary • As one of approaches to elucidate the origin of room temperature ferromagnetism in magnetic chalcopyrites, growth of chalcopyrite type Mn. Ge. P 2, which is not existing in nature is investigated. • Thermodynamic study including ab-initio evaluation of Hm confirms stable formation of Mn. Ge. P 2 by MBE technique. • MOMBE growth of Mn. Ge. P 2 films are studied. Nearly stoichiometric compounds are obtained. They show ferromagnetism and weak magneto-optical effect. • Further careful investigation is necessary to discriminate the effect of possible second phase material.
 Magnetic semiconductors
 The coercive force in a ferromagnetic material is
 Weber magnet
 Magnetic moment and magnetic field relation
 Force on a charged particle
 Introduction to semiconductors
 Direct and indirect band gap semiconductors
 Semiconductor industry association
 International technology roadmap for semiconductors
 Continuity equation derivation in semiconductors
 Equation of continuity in semiconductors
 Equation of continuity in semiconductors
 Atomic layer deposition for semiconductors
 Konduktor isolator dan semikonduktor
 Equipement used for making semiconductors
 Semiconductor
 Continuity equation derivation in semiconductors
 Fundamentals of semiconductor devices anderson pdf
 Donor concentration formula
 Elemental and compound semiconductors
 The physics of semiconductors
 Semiconductor junction devices
 Excess carriers in semiconductors
 International roadmap for semiconductors
 Bank of america semiconductors
 Semiconductor types
 What is semiconductor
 Semiconductors band gap
 Semiconductors band gap
 Elemental and compound semiconductors
 Semiconductors
 Nhanced semiconductors
 Nec semiconductors livingston
 Semiconductors
 Plant growth index
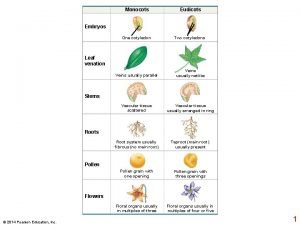
 Monocots eudicots
 Step growth polymerization vs chain growth
 Primary growth and secondary growth in plants
 Vascular ray
 Geometric growth graph
 Neoclassical growth theory vs. endogenous growth theory
 Organic vs inorganic growth
 Is hyper v type 1 or type 2
 Type 1 and type 2 muscle fibres
 Type i error
 Type 2 vs type 1 error
 Rock cycle

