The Cancer Genome Atlas PanCancer Analysis Katie Hoadley


 Christina Yau")

 •")


 Christina Yau")

 SKCM, COAD, SARC, MESO,")
 SKCM, COAD, SARC, MESO,")


 C 2: BRCA (HER 2 amp) C")


- Slides: 24
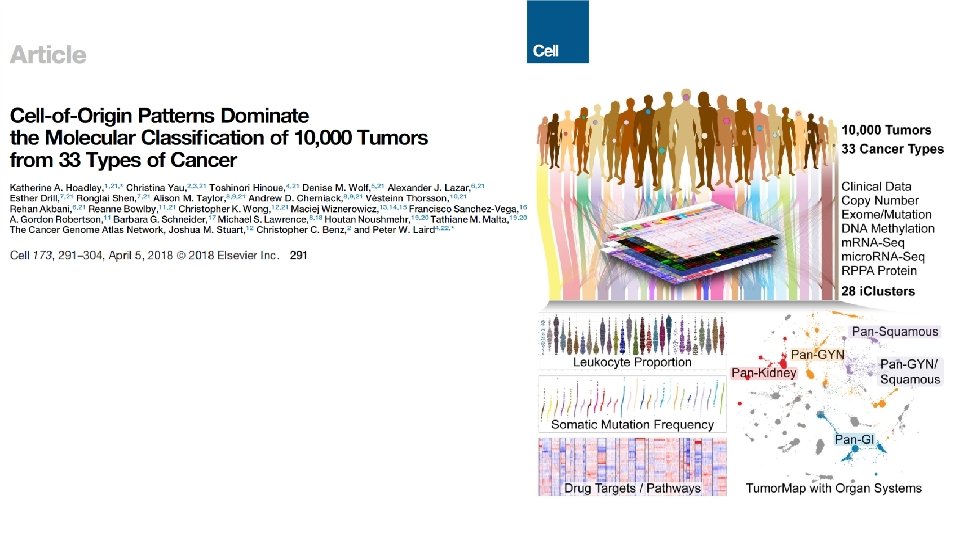
The Cancer Genome Atlas Pan-Cancer Analysis Katie Hoadley Assistant Professor Department of Genetics Lineberger Comprehensive Cancer Center The University of North Carolina at Chapel Hill
Individual Platform Classification Alison Taylor, Andy Cherniack, Toshi Hinoue, Rehan Akbani, Chris Fan, Katie Hoadley, Gordon Robertson
Clustering of Cluster Assignments (COCA) Christina Yau
i. Cluster Input features • • • 3, 105 segmented CN regions 3, 139 hypermethylated features 3, 217 m. RNA features 382 mi. RNA features *RPPA was not used but shown Esther Drill, Ronglai Shen
i. Cluster - Tumor Type Relationships Single Tumor Type-Dominant (>70% one tumor type) • C 6: OV • C 8: UCEC • C 11: LGG (IDH 1 mut) • C 12: THCA • C 14: LUAD • C 16: PRAD • C 19: BRCA (Luminal) • C 21: DLBC • C 22: TGCT • C 24: LAML • C 26: LIHC Related Tumor Types • C 5: CNS/Endocrine • C 15: SKCM/UVM • C 23: GBM/LGG (IDH 1 wt) • C 28: Pan-Kidney Pan-Gastrointestinal • C 1: STAD (EBV CIMP) • C 4: Pan-GI (CRC) • C 18: Pan-GI (MSI) Pan-Squamous • C 10: Pan-SCC • C 25: Pan-SCC (Chr 11 amp) • C 27: Pan-SCC (HPV) Copy Number Driven • C 2: BRCA (HER 2 amp) • C 9: ACC/KICH • C 7: Mixed (Chr 9 del) • C 13: Mixed (Chr 8 del) • C 17: BRCA (Chr 8 q amp) Mixed Groups • C 3: Mesenchymal (Immune) • C 20: Mixed (Stromal/Immune)
C 9: ACC/KICH Davis et al, Cancer Cell 2014 ACC, Zehng et al, Cancer Cell 2016
C 15: SKCM/UVM Robertson et al, Cancer Cell 2018 SKCM TCGA, Cell 2015
Clustering of Cluster Assignments (COCA) Christina Yau
Neural Crest Cell-of-Origin Kalirai et al, Biochemistry and Molecular Biology, 2011
Tumor Type – i. Cluster Relationships Diffuse Tumor Classifications (<70%) SKCM, COAD, SARC, MESO, GBM, DLBC, LUSC, BRCA, STAD, HNSC, UCS, ESCA, CHOL, and BLCA Moderate Tumor Classifications (70 - 89%) READ, LUAD, LGG, UCEC, UVM, CESC, PAAD, ACC, KICH, THYM Strong Tumor Classifications (90 - 100%) PCPG, PRAD, THCA, LAML, TGCT, KIRC, KIRP, OV, LIHC
Tumor Type – i. Cluster Relationships Diffuse Tumor Classifications (<70%) SKCM, COAD, SARC, MESO, GBM, DLBC, LUSC, BRCA, STAD, HNSC, UCS, ESCA, CHOL, and BLCA GBM • 64% C 23: GBM/LGG (IDH 1 wt) • 16% C 5: CNS/Endocrine • 12% C 3: Mesenchymal (Immune) • 6% C 11: LGG (IDH 1 mut) STAD • 44% C 20: Mixed (Stromal/Immune) • 28% C 18: Pan-GI (MSI) • 8% C 1: STAD (EBV CIMP) • 6% C 4: Pan-GI (CRC) • 4% C 2: BRCA (HER 2 amp) BRCA • 53% C 19: BRCA (Luminal) • 12% C 17: BRCA (Chr 8 q amp) • 10% C 2: BRCA (HER 2 amp) • 8% C 20: Mixed (Stromal/Immune) • 7% C 13: Mixed (Chr 8 del) • 4% C 25: Pan-SCC (Chr 11 amp) Bladder (BLCA) was the most diverse with samples members of 15 different i. Clusters with a maximum enrichment of only 24% of samples in an i. Cluster (Squamous).
Basal-like Classification
HOW MANY ETIOLOGICAL SUBTYPES OF BREAST CANCER: TWO, THREE, OR MORE? William F. Anderson, Philip S. Rosenberg, Aleix Prat, Charles M. Perou, and Mark E. Sherman. JNCI, (2014). PMID: 25118203 Clemmesen’s Hook n=2000
i. Cluster Stability and Relationships Christina Yau
Stroma and Leukocytes • Stroma fraction was defined as 1 – the purity estimates from ABSOLUTE. (Carter et al, 2012) • Leukocyte proportion was defined with DNA Methylation data by identifying DNA methylation probes that differed between pure leukocyte cells and normal tissues and estimating the leukocyte content using a mixture model. Vesteinn Thorsson, Toshi Hinoue
Vesteinn Thorsson
Tumor Map Chris Wong, Josh Stuart
Histology and Immune Relationships Chris Wong, Alex Lazar Thorsson et al, Immunity 2018
Somatic Mutation Frequency Mike Lawrence
Driver Mutation Enrichment C 1: STAD (EBV-CIMP) C 2: BRCA (HER 2 amp) C 4: Pan-GI (CRC) C 6: OV C 8: UCEC C 10: Pan-SCC C 11: LGG (IDH 1 mut) C 12: THCA C 13: Mixed (Chr 8 del) C 14: LUAD C 15: SKCM/UVM C 17: BRCA (Chr 8 q amp) C 18: Pan-GI (MSI) C 19: BRCA (Luminal) C 20: Mixed (Stromal/Immune) C 23: GBM/LGG (IDH 1 wt) C 25: Pan-SCC (Chr 11 amp) Bailey et al, Cell, 2108 PIK 3 CA, ARID 1 A TP 53 APC, TP 53, KRAS TP 53 PTEN, PIK 3 CA, ARID 1 A TP 53 IDH 1, TP 53, ATRX BRAF TP 53 PIK 3 CA TP 53 EGFR TP 53
Summary • Integrative Clustering methods to classify human tumors • Tissue type influences but does not fully determine tumor classification • Classification might help identify cancers of unknown primary origin or help identify new biomarkers. • Identifying similar molecular characteristics across tumors of different tissues might help us use information from one tumor/cell type to gain information about other tumor/cell types.
TCGA Pan Cancer Atlas Working Group +725 individuals from around the world