STA 302 Regression Analysis See last slide for


 5")


- Slides: 29
STA 302: Regression Analysis See last slide for copyright information 1
Statistics • Objective: To draw reasonable conclusions from noisy numerical data • Entry point: Study relationships between variables 2
Data File • Rows are cases. There are n cases. • Columns are variables. A variable is a piece of information that is recorded for every case. 3
4
Variables can be • Independent or Predictor • Dependent or Response (predicted) 5
Simple regression and correlation • Simple means one independent variable. • Dependent variable quantitative. • Independent variable usually quantitative too. 6
Simple regression and correlation High School GPA University GPA 88 86 78 73 87 89 86 81 77 67 … … 7
Scatterplot 8
Least squares line 9
Correlation between variables • is an estimate of • 10
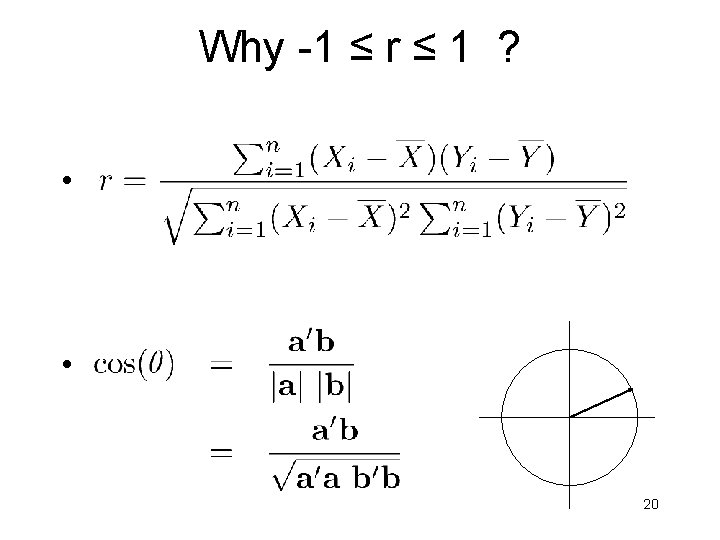
Correlation coefficient r • -1 ≤ r ≤ 1 • r = +1 indicates a perfect positive linear relationship. All the points are exactly on a line with a positive slope. • r = -1 indicates a perfect negative linear relationship. All the points are exactly on a line with a negative slope. • r = 0 means no linear relationship (curve possible). Slope of least squares line = 0 • r 2 = proportion of variation explained 11
r = 0. 004 12
r = 0. 112 13
r = 0. 368 14
r = 0. 547 15
r = 0. 733 16
r = - 0. 822 17
r = 0. 025 18
r = - 0. 811 19
A Statistical Model 21
One Independent Variable at a Time Can Produce Misleading Results • The standard elementary methods all have a single independent variable (at most), so they should be used with caution in practice. • Example: Artificial and extreme, to make a point: • Suppose the correlation between Age and Strength is r = -0. 96 22
23
Need multiple regression 24
Multiple regression in scalar form 25
Multiple regression in matrix form 26
So we need • Matrix algebra • Random vectors, especially multivariate normal • Software to do the computation 27
Reading • In Rencher and Schaalje’s Linear Models In Statistics. • Chapter 6 (only 10 pages). • Overview using simple regression: One explanatory variable. 28
Copyright Information This slide show was prepared by Jerry Brunner, Department of Statistical Sciences, University of Toronto. It is licensed under a Creative Commons Attribution - Share. Alike 3. 0 Unported License. Use any part of it as you like and share the result freely. These Powerpoint slides are available from the course website: http: //www. utstat. toronto. edu/~brunner/oldclass/302 f 20 29