QUALITY OF LIFE AND HEALTH IN ATLANTA Susannah



- Slides: 79
QUALITY OF LIFE AND HEALTH IN ATLANTA Susannah Lee Audrey Leous, MCRP Nisha Botchwey, Ph. D, MCRP, MPH Subhrajit Guhathakurta Ph. D, MCRP Center for Geographic Information Systems School of City and Regional Planning Georgia Institute of Technology Georgia Planning Association Meeting Jewelle Kennedy Columbus, GA Department of Planning & Community Development City of Atlanta 9. 26. 2012
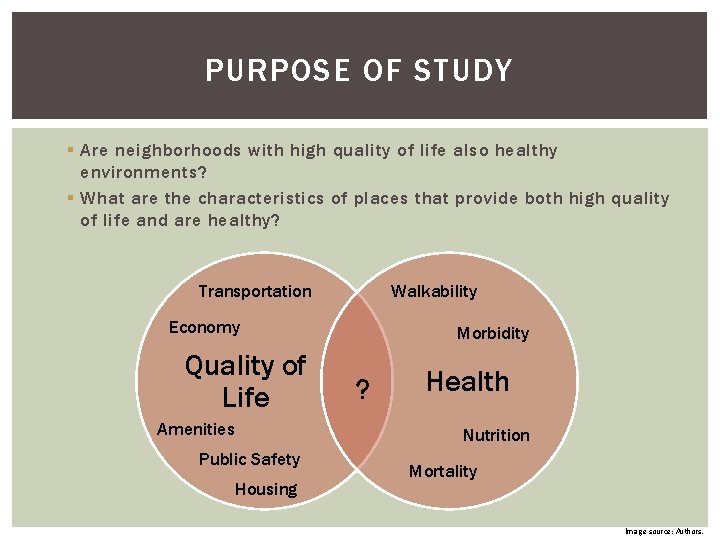
PURPOSE OF STUDY § Are neighborhoods with high quality of life also healthy environments? § What are the characteristics of places that provide both high quality of life and are healthy? Transportation Walkability Economy Quality of Life Amenities Morbidity ? Health Nutrition Public Safety Housing Mortality Image source: Authors.
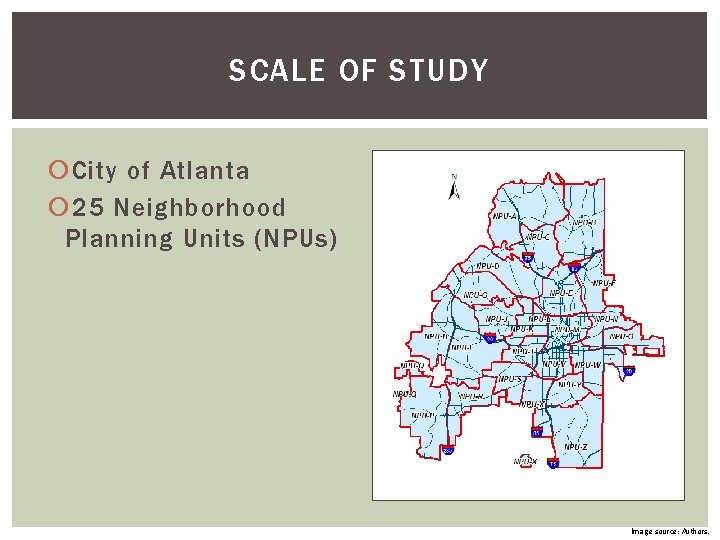
SCALE OF STUDY City of Atlanta 25 Neighborhood Planning Units (NPUs) Image source: Authors.
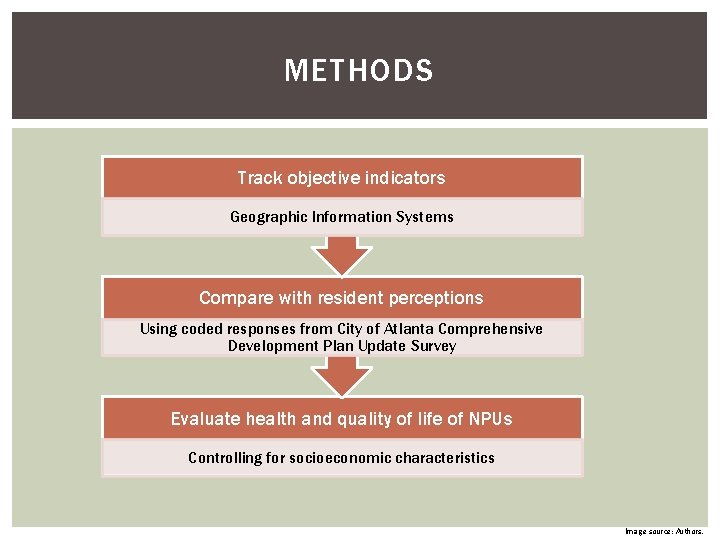
METHODS Track objective indicators Geographic Information Systems Compare with resident perceptions Using coded responses from City of Atlanta Comprehensive Development Plan Update Survey Evaluate health and quality of life of NPUs Controlling for socioeconomic characteristics Image source: Authors.
COMPREHENSIVE DEVELOPMENT PLAN (CDP) UPDATE http: //www. atlantaga. gov/index. aspx? page=376
COMPREHENSIVE PLANNING LEGISLATION The 1989 Georgia Planning Act calls for local governments to develop and adopt a Comprehensive Plan. An adopted Comprehensive Plan is necessary to maintain the City’s Qualified Local Government (QLG) certification. § QLG Certification is needed to be eligible for various state and regional funding. The City Charter mandates the preparation of Comprehensive Development Plan every 3 to 5 years. a § The City of Atlanta was one of the first in the state to require Comprehensive Planning.
COMPREHENSIVE DEVELOPMENT PLAN Georgia State Department of Community Affairs (DCA) adopted new guidelines / requirements for local government comprehensive planning in 2005. DCA sets the schedule for plan adoption. § The 2011 Comprehensive Development Plan was adopted by the City of Atlanta in October 2011 per 11 -O-1234. New standards added information and changed process. Plans have a 20 year time horizon
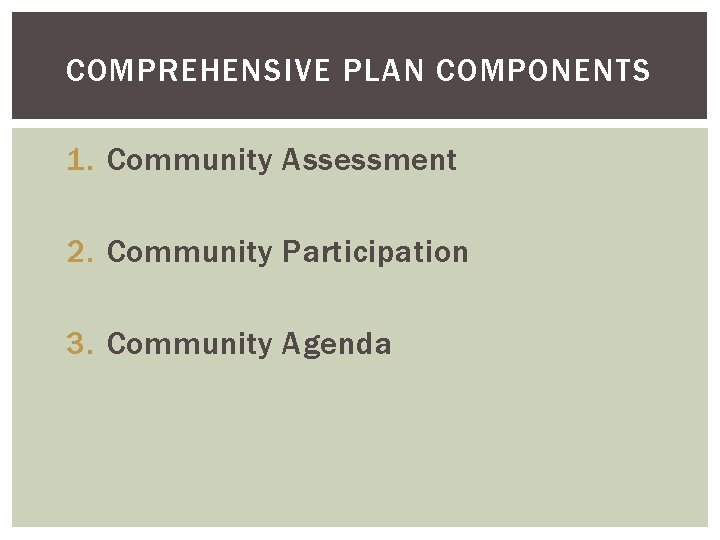
COMPREHENSIVE PLAN COMPONENTS 1. Community Assessment 2. Community Participation 3. Community Agenda
COMMUNITY PARTICIPATION PROGRAM The Community Participation Plan is the second part of the Comprehensive Plan. This plan outlines the strategy for ensuring involvement by the public, i. e. stakeholders in developing the “Community Agenda”. The plan has 3 components: 1. Identification of Stakeholders 2. Identification of Participation Techniques 3. Schedule for completion of the Community Agenda
COMMUNITY PARTICIPATION PROGRAM § Identification of Stakeholders § City Organizations: City Council, Mayor’s Office, City Departments § Community Groups: NPUs, residents, property owners § Advocacy Groups/Non-profits: PEDS, Park Pride, Georgia Stand Up § Civic Groups/Authorities: AHA, MARTA, CIDs § City Boards and Agencies: Invest Atlanta (ADA), ABI, BZA, AUDC, APABs
COMMUNITY PARTICIPATION PROGRAM § Identification of Participation Techniques § Informative – Website, printed information, public displays, Council and Cabinet presentations, presentations and announcements at NPU meetings, press releases, meeting notices, presentations, etc. § Public Input: § Public hearings § On-line survey
COMMUNITY PARTICIPATION PROGRAM § Identification of Participation Techniques § Interactive § Community meetings – each meeting held 3 times § Issues and Opportunities & review of vision § Identification of Character Areas § Visions for Character areas § City Council work sessions § Open House
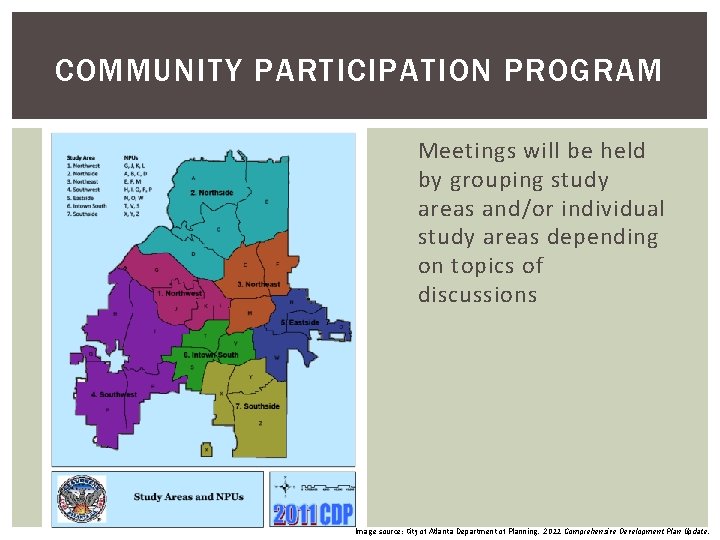
COMMUNITY PARTICIPATION PROGRAM Meetings will be held by grouping study areas and/or individual study areas depending on topics of discussions Image source: City of Atlanta Department of Planning. 2011 Comprehensive Development Plan Update.
RESIDENT PERCEPTIONS
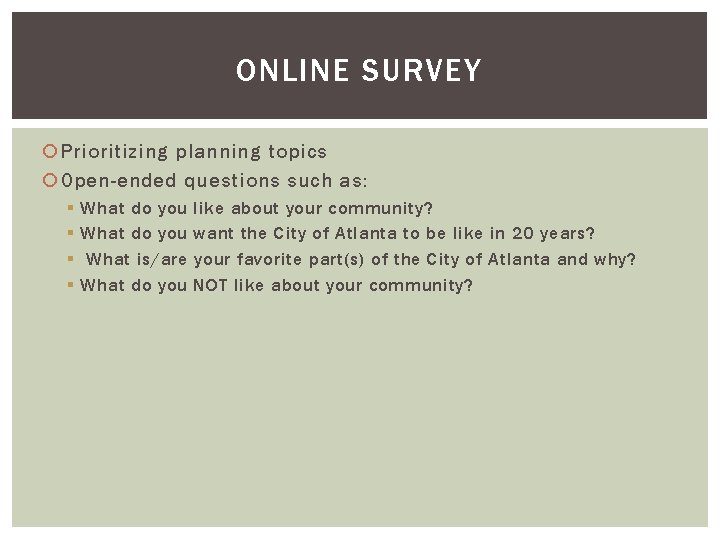
ONLINE SURVEY Prioritizing planning topics Open-ended questions such as: § § What do you What is/are What do you like about your community? want the City of Atlanta to be like in 20 years? your favorite part(s) of the City of Atlanta and why? NOT like about your community?
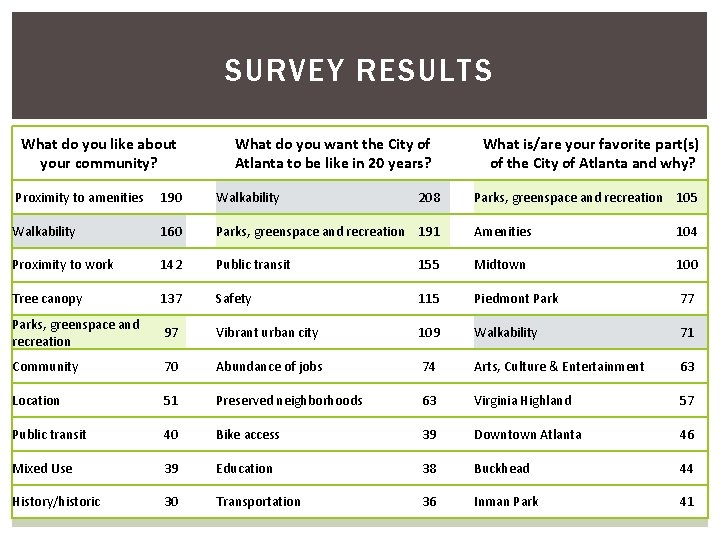
SURVEY RESULTS What do you like about your community? What do you want the City of Atlanta to be like in 20 years? 208 What is/are your favorite part(s) of the City of Atlanta and why? Proximity to amenities 190 Walkability Parks, greenspace and recreation 105 Walkability 160 Parks, greenspace and recreation 191 Amenities 104 Proximity to work 142 Public transit 155 Midtown 100 Tree canopy 137 Safety 115 Piedmont Park 77 Parks, greenspace and recreation 97 Vibrant urban city 109 Walkability 71 Community 70 Abundance of jobs 74 Arts, Culture & Entertainment 63 Location 51 Preserved neighborhoods 63 Virginia Highland 57 Public transit 40 Bike access 39 Downtown Atlanta 46 Mixed Use 39 Education 38 Buckhead 44 History/historic 30 Transportation 36 Inman Park 41
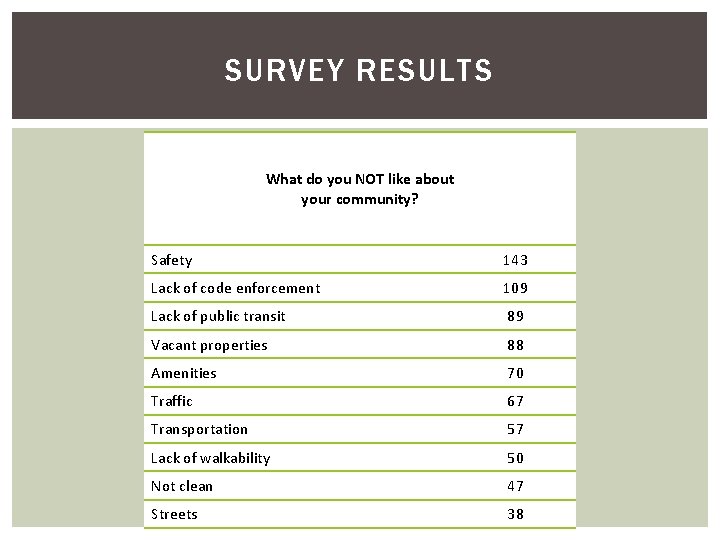
SURVEY RESULTS What do you NOT like about your community? Safety 143 Lack of code enforcement 109 Lack of public transit 89 Vacant properties 88 Amenities 70 Traffic 67 Transportation 57 Lack of walkability 50 Not clean 47 Streets 38
SOCIOECONOMIC CONDITIONS (SEC) INDEX
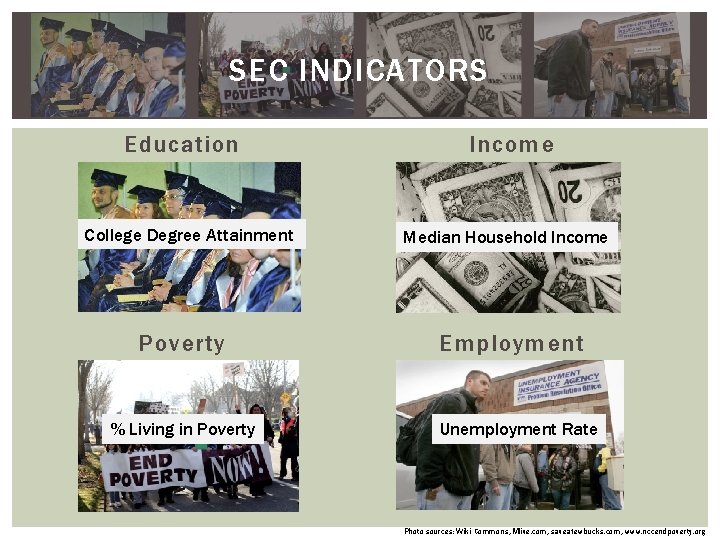
SEC INDICATORS Education College Degree Attainment Poverty % Living in Poverty Income Median Household Income Employment Unemployment Rate Photo sources: Wiki Commons, Mlive. com, saveafewbucks. com, www. nccendpoverty. org
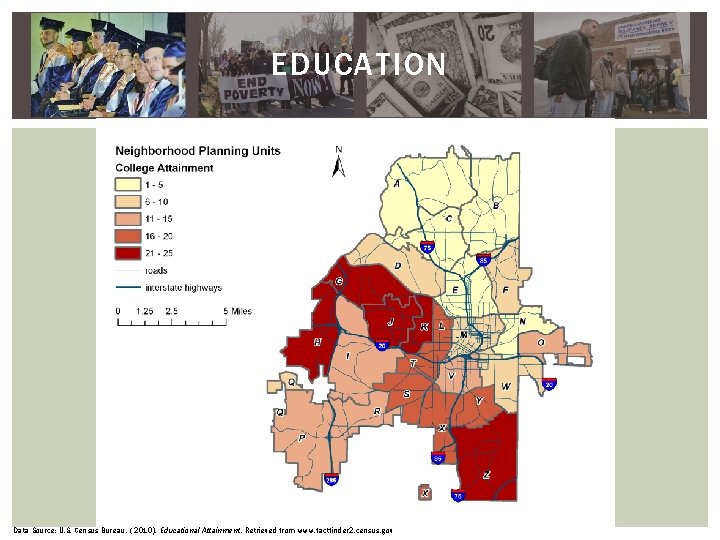
EDUCATION Data Source: U. S. Census Bureau. ( 2010). Educational Attainment. Retrieved from www. factfinder 2. census. gov
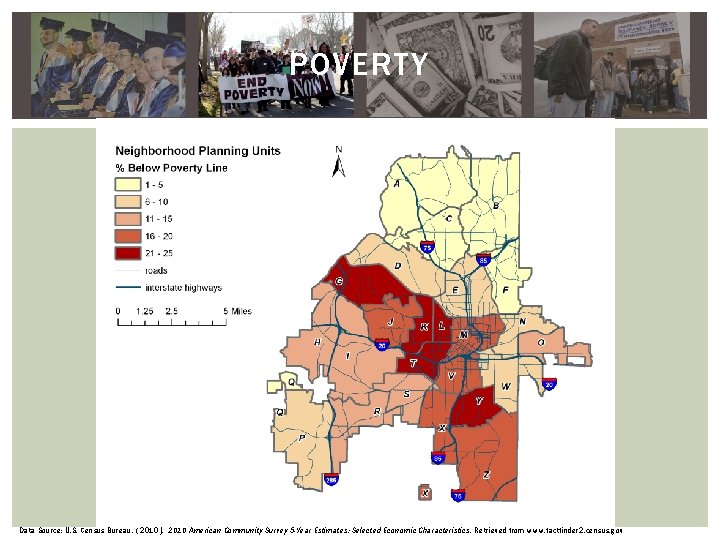
POVERTY Data Source: U. S. Census Bureau. ( 2010 ). 2010 American Community Survey 5 -Year Estimates: Selected Economic Characteristics. Retrieved from www. factfinder 2. census. gov
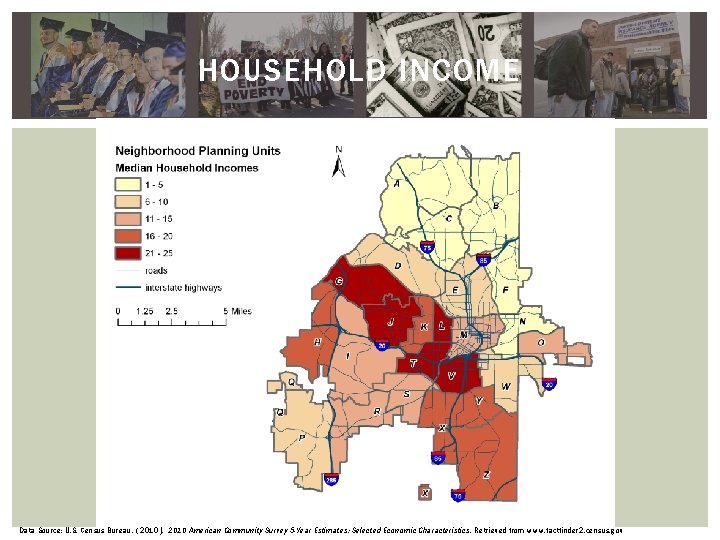
HOUSEHOLD INCOME Data Source: U. S. Census Bureau. ( 2010 ). 2010 American Community Survey 5 -Year Estimates: Selected Economic Characteristics. Retrieved from www. factfinder 2. census. gov
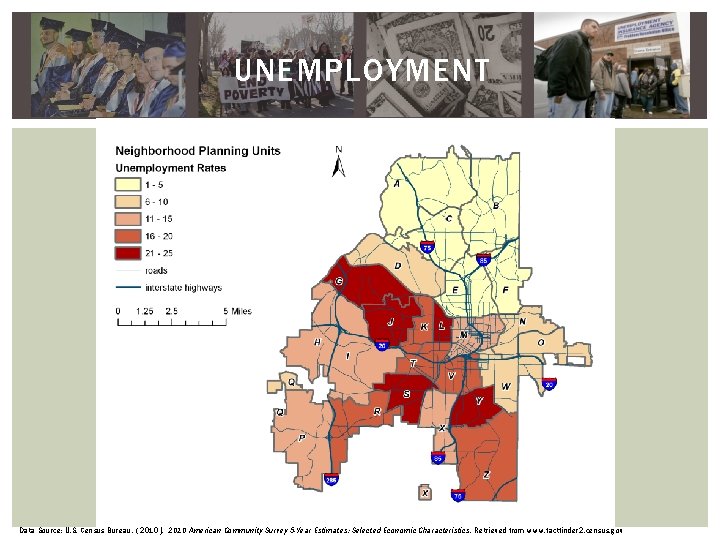
UNEMPLOYMENT Data Source: U. S. Census Bureau. ( 2010 ). 2010 American Community Survey 5 -Year Estimates: Selected Economic Characteristics. Retrieved from www. factfinder 2. census. gov
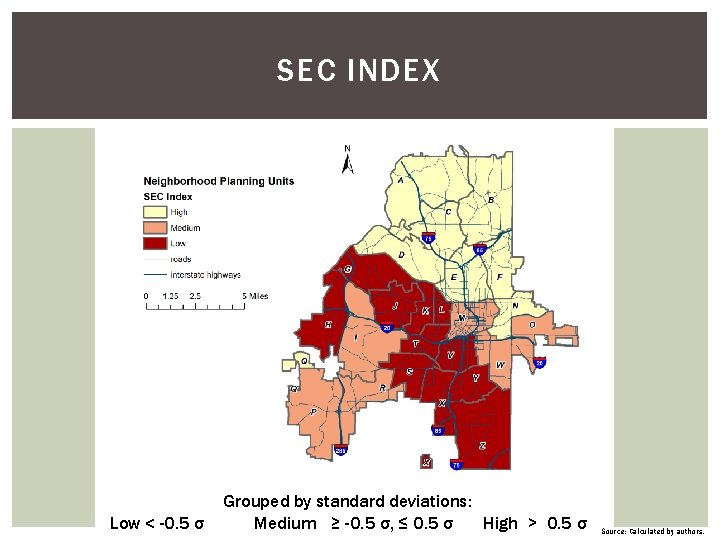
SEC INDEX Low < -0. 5 σ Grouped by standard deviations: Medium ≥ -0. 5 σ, ≤ 0. 5 σ High > 0. 5 σ Source: Calculated by authors.
NEIGHBORHOOD QUALITY OF LIFE INDEX
QUALITY OF LIFE What is Quality of Life (Qo. L)? How can it be measured? Of what use is it to planning?
DEFINING QOL Informed by both objective measurements and resident perceptions Varies over time and space Inherent linkage to place Viable planning tool, since planning aims to further community development and wellbeing Results can serve to inform targeted policy recommendations
INDICATOR SELECTION Indicators… § Should be valid at the neighborhood level § Should be associated with place § Should capture attributes of importance to residents
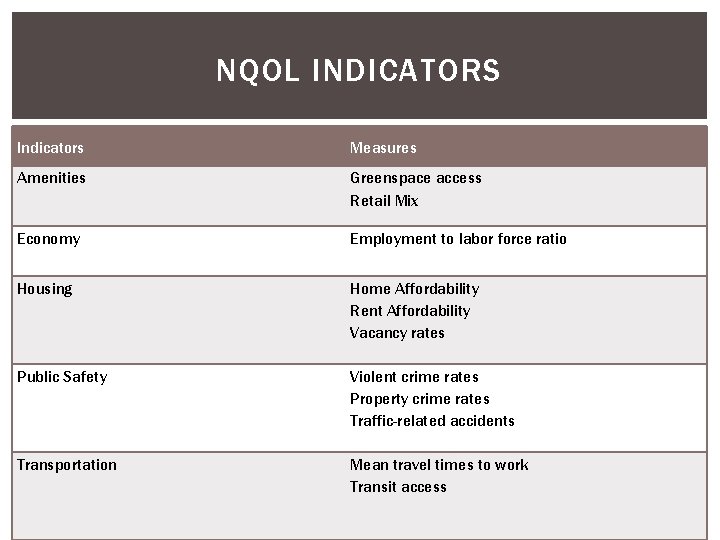
NQOL INDICATORS Indicators Measures Amenities Greenspace access Retail Mix Economy Employment to labor force ratio Housing Home Affordability Rent Affordability Vacancy rates Public Safety Violent crime rates Property crime rates Traffic-related accidents Transportation Mean travel times to work Transit access
ATLANTA NEIGHBORHOOD QUALITY OF LIFE INDEX RESULTS
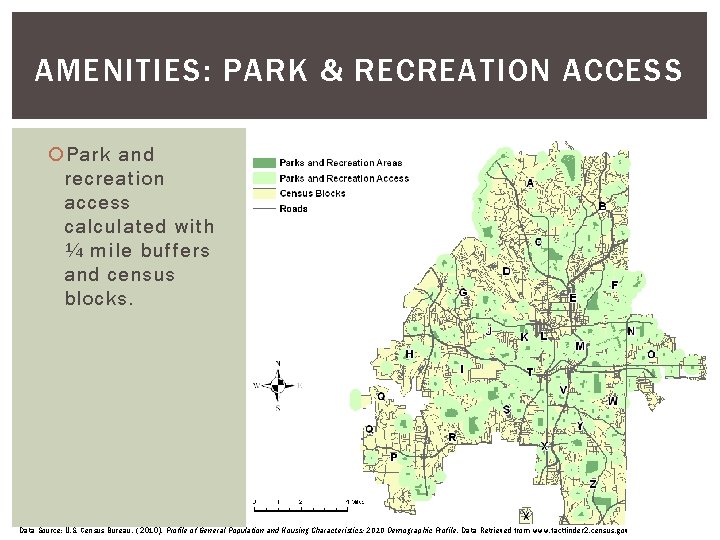
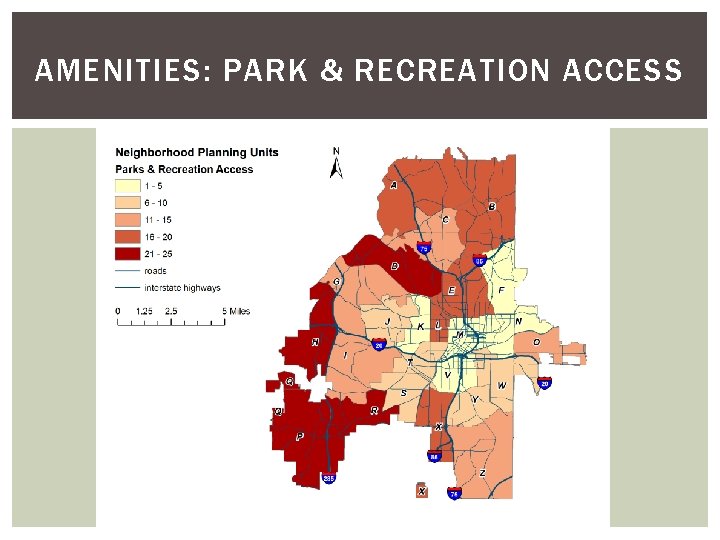
AMENITIES: PARK & RECREATION ACCESS Park and recreation access calculated with ¼ mile buffers and census blocks. Data Source: U. S. Census Bureau. ( 2010). Profile of General Population and Housing Characteristics: 2010 Demographic Profile. Data Retrieved from www. factfinder 2. census. gov
AMENITIES: PARK & RECREATION ACCESS
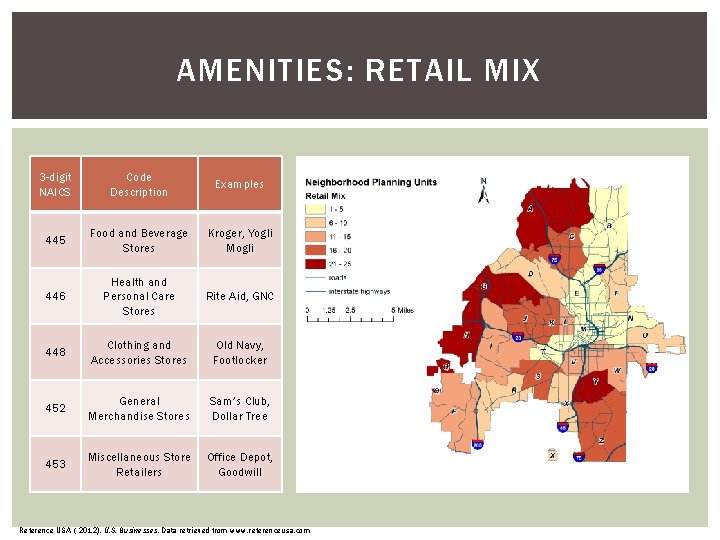
AMENITIES: RETAIL MIX 3 -digit NAICS Code Description Examples 445 Food and Beverage Stores Kroger, Yogli Mogli 446 Health and Personal Care Stores Rite Aid, GNC 448 Clothing and Accessories Stores Old Navy, Footlocker 452 General Merchandise Stores Sam’s Club, Dollar Tree 453 Miscellaneous Store Retailers Office Depot, Goodwill Reference USA. ( 2012). U. S. Businesses. Data retrieved from www. referenceusa. com
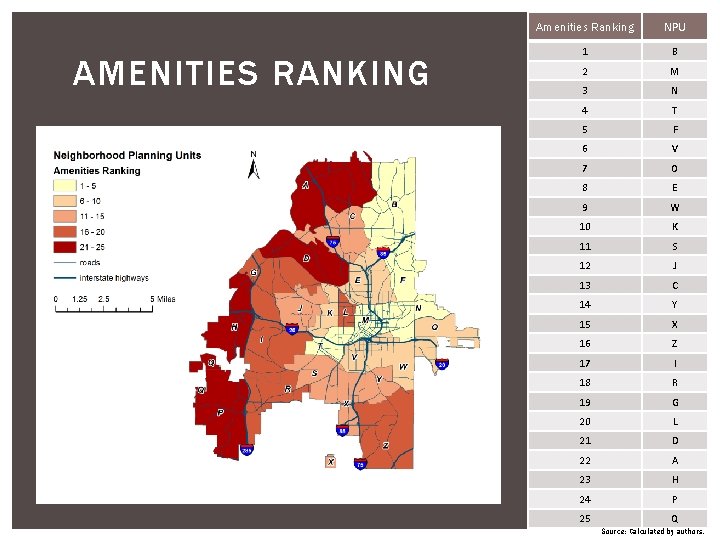
AMENITIES RANKING Amenities Ranking NPU 1 B 2 M 3 N 4 T 5 F 6 V 7 O 8 E 9 W 10 K 11 S 12 J 13 C 14 Y 15 X 16 Z 17 I 18 R 19 G 20 L 21 D 22 A 23 H 24 P 25 Q Source: Calculated by authors.
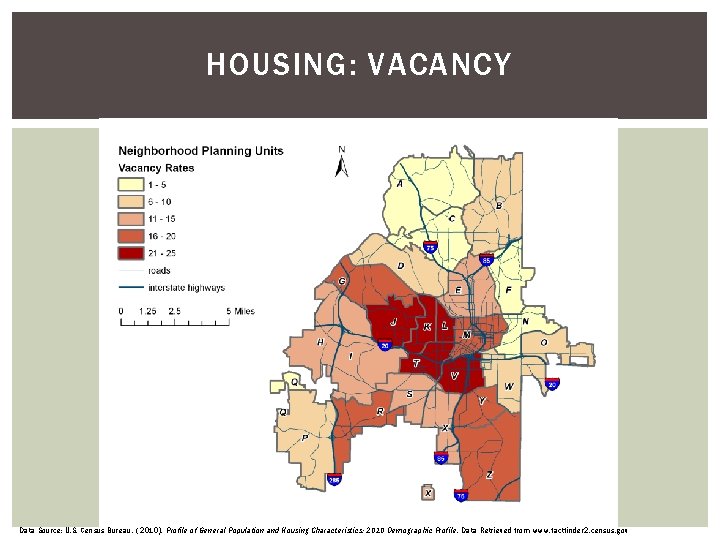
HOUSING: VACANCY Data Source: U. S. Census Bureau. ( 2010). Profile of General Population and Housing Characteristics: 2010 Demographic Profile. Data Retrieved from www. factfinder 2. census. gov
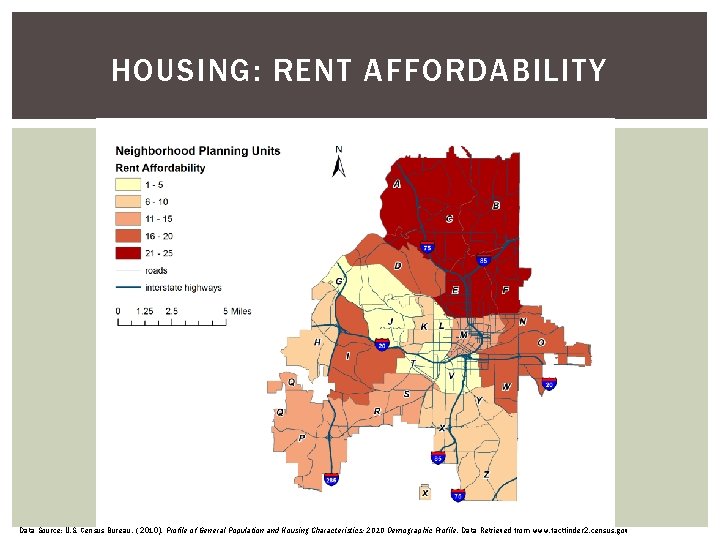
HOUSING: RENT AFFORDABILITY Data Source: U. S. Census Bureau. ( 2010). Profile of General Population and Housing Characteristics: 2010 Demographic Profile. Data Retrieved from www. factfinder 2. census. gov
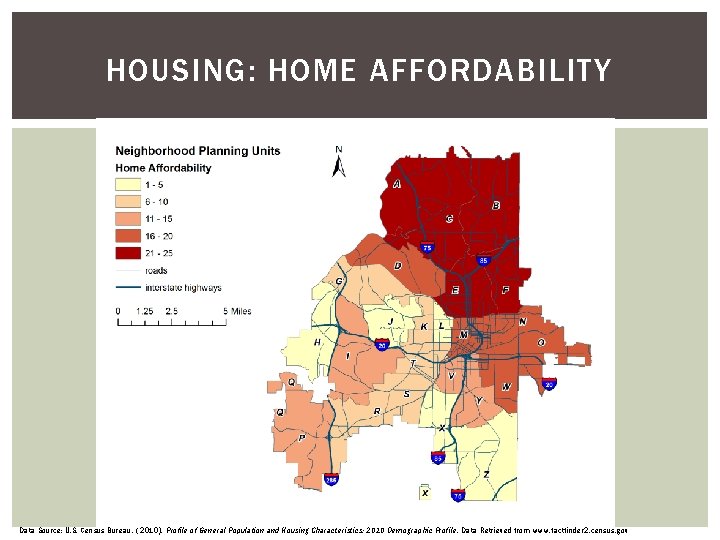
HOUSING: HOME AFFORDABILITY Data Source: U. S. Census Bureau. ( 2010). Profile of General Population and Housing Characteristics: 2010 Demographic Profile. Data Retrieved from www. factfinder 2. census. gov
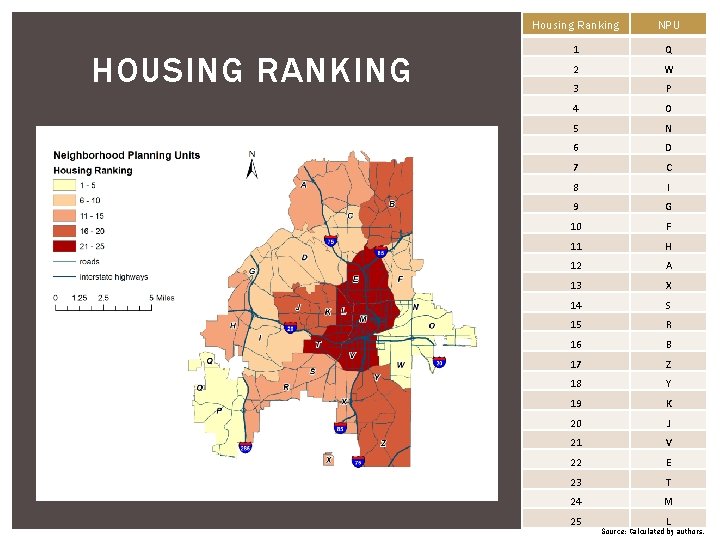
HOUSING RANKING Housing Ranking NPU 1 Q 2 W 3 P 4 O 5 N 6 D 7 C 8 I 9 G 10 F 11 H 12 A 13 X 14 S 15 R 16 B 17 Z 18 Y 19 K 20 J 21 V 22 E 23 T 24 M 25 L Source: Calculated by authors.
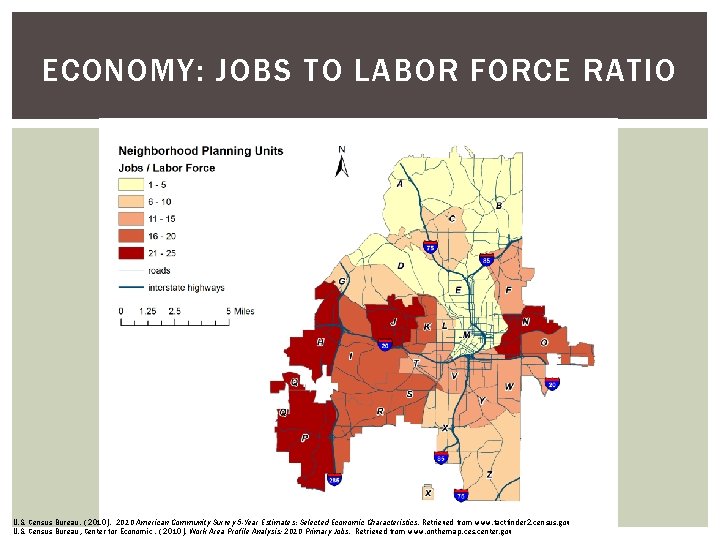
ECONOMY: JOBS TO LABOR FORCE RATIO U. S. Census Bureau. ( 2010). 2010 American Community Survey 5 -Year Estimates: Selected Economic Characteristics. Retrieved from www. factfinder 2. census. gov U. S. Census Bureau, Center for Economic. ( 2010 ). Work Area Profile Analysis: 2010 Primary Jobs. Retrieved from www. onthemap. ces. center. gov
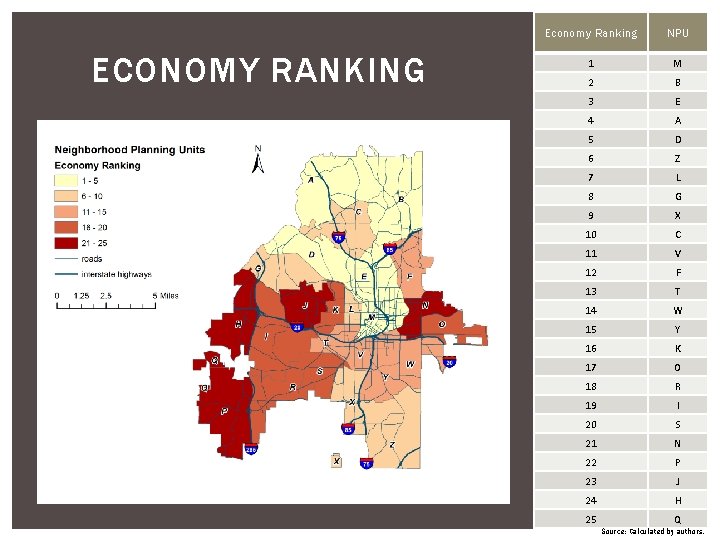
ECONOMY RANKING Economy Ranking NPU 1 M 2 B 3 E 4 A 5 D 6 Z 7 L 8 G 9 X 10 C 11 V 12 F 13 T 14 W 15 Y 16 K 17 O 18 R 19 I 20 S 21 N 22 P 23 J 24 H 25 Q Source: Calculated by authors.
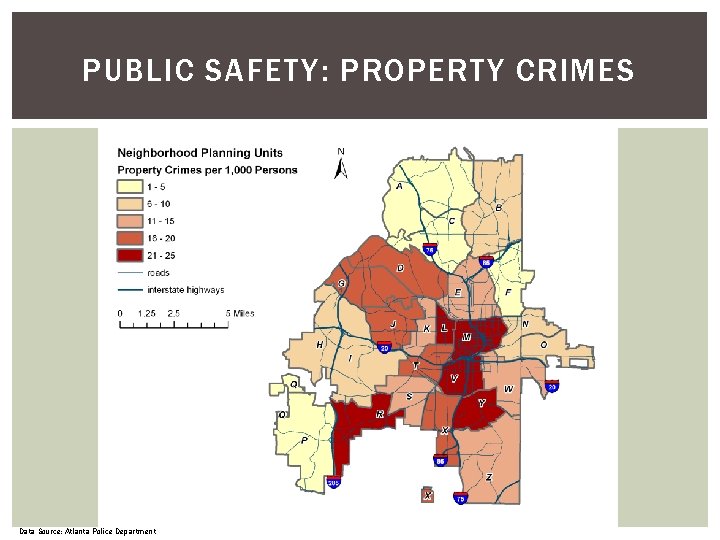
PUBLIC SAFETY: PROPERTY CRIMES Data Source: Atlanta Police Department
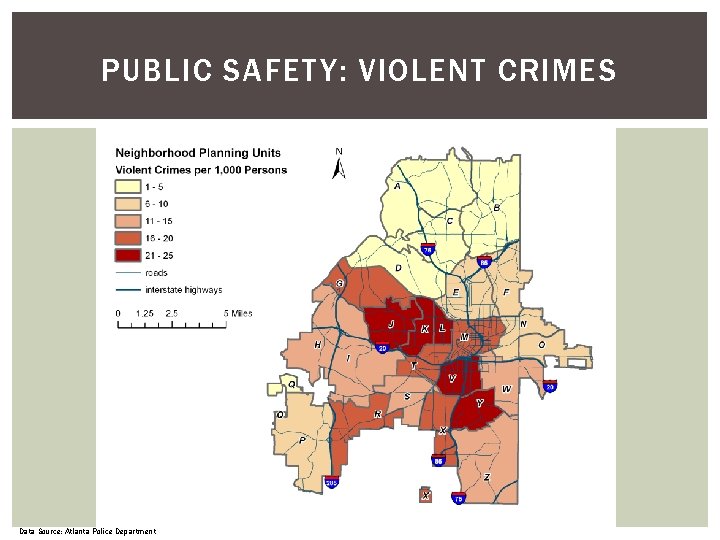
PUBLIC SAFETY: VIOLENT CRIMES Data Source: Atlanta Police Department
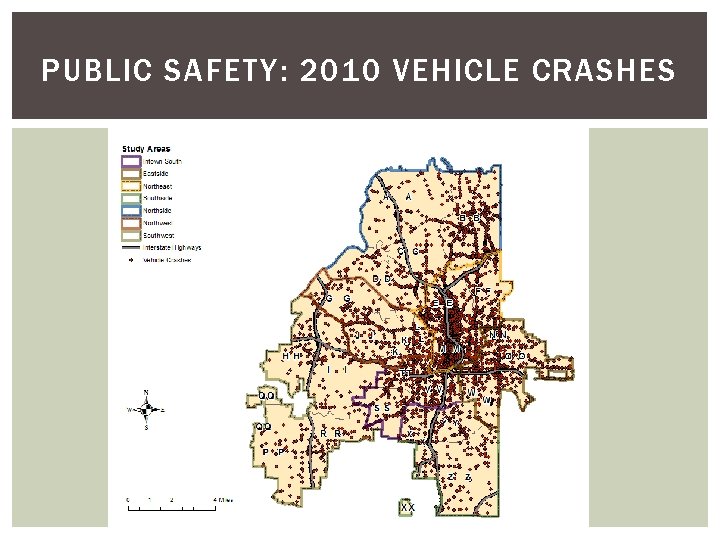
PUBLIC SAFETY: 2010 VEHICLE CRASHES
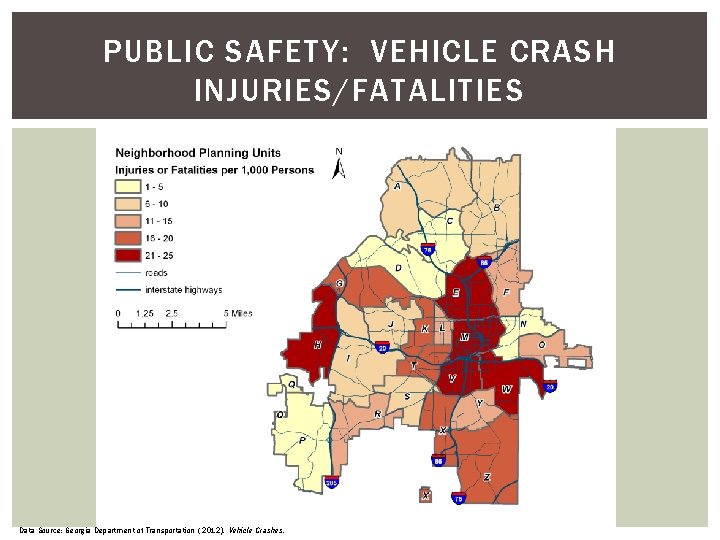
PUBLIC SAFETY: VEHICLE CRASH INJURIES/FATALITIES Data Source: Georgia Department of Transportation ( 2012). Vehicle Crashes.
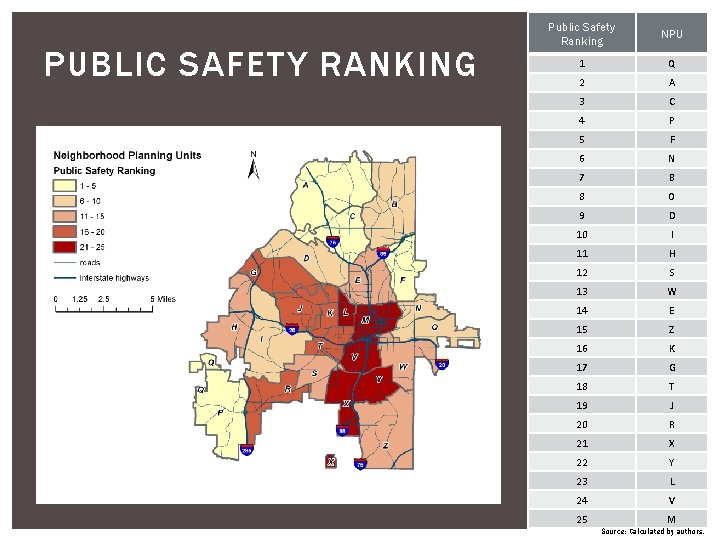
PUBLIC SAFETY RANKING Public Safety Ranking NPU 1 Q 2 A 3 C 4 P 5 F 6 N 7 B 8 O 9 D 10 I 11 H 12 S 13 W 14 E 15 Z 16 K 17 G 18 T 19 J 20 R 21 X 22 Y 23 L 24 V 25 M Source: Calculated by authors.
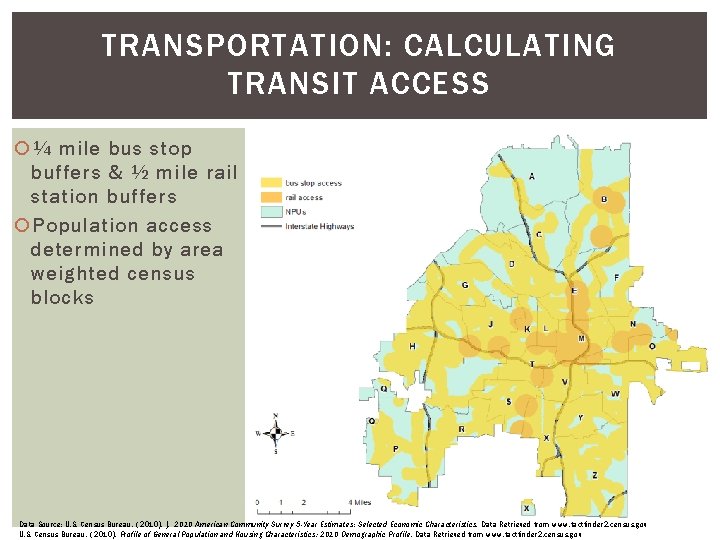
TRANSPORTATION: CALCULATING TRANSIT ACCESS ¼ mile bus stop buffers & ½ mile rail station buffers Population access determined by area weighted census blocks Data Source: U. S. Census Bureau. ( 2010). ). 2010 American Community Survey 5 -Year Estimates: Selected Economic Characteristics. Data Retrieved from www. factfinder 2. census. gov U. S. Census Bureau. ( 2010). Profile of General Population and Housing Characteristics: 2010 Demographic Profile. Data Retrieved from www. factfinder 2. census. gov
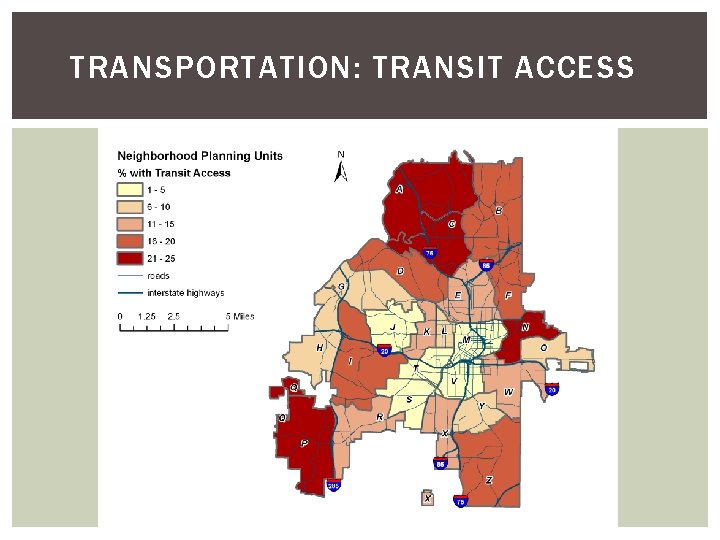
TRANSPORTATION: TRANSIT ACCESS
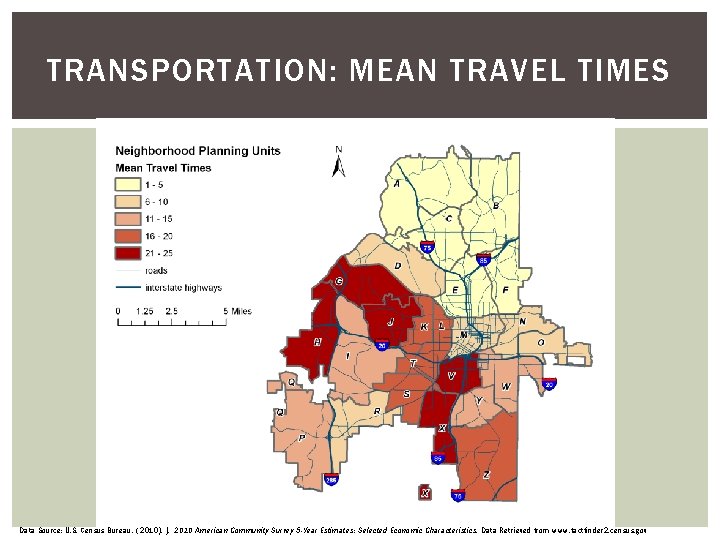
TRANSPORTATION: MEAN TRAVEL TIMES Data Source: U. S. Census Bureau. ( 2010). ). 2010 American Community Survey 5 -Year Estimates: Selected Economic Characteristics. Data Retrieved from www. factfinder 2. census. gov
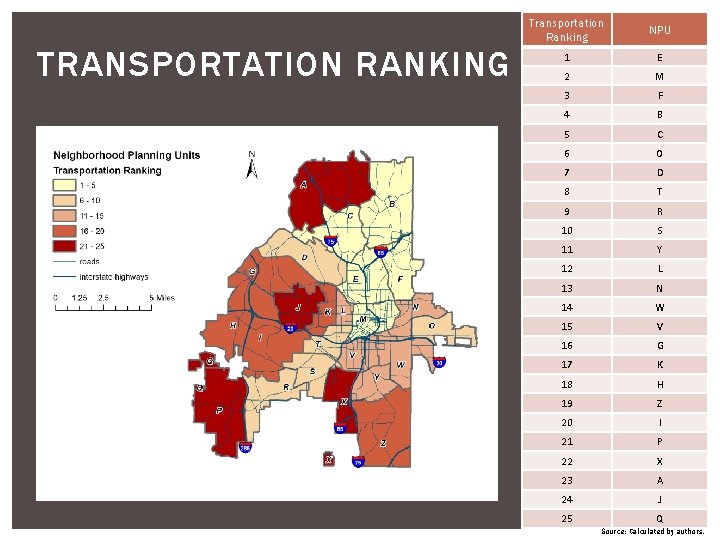
TRANSPORTATION RANKING Transportation Ranking NPU 1 E 2 M 3 F 4 B 5 C 6 O 7 D 8 T 9 R 10 S 11 Y 12 L 13 N 14 W 15 V 16 G 17 K 18 H 19 Z 20 I 21 P 22 X 23 A 24 J 25 Q Source: Calculated by authors.
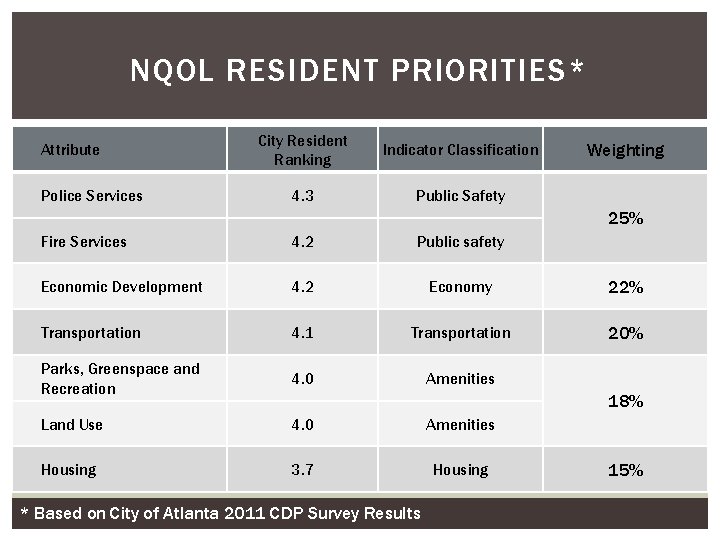
NQOL RESIDENT PRIORITIES* Attribute Police Services City Resident Ranking Indicator Classification 4. 3 Public Safety Weighting 25% Fire Services 4. 2 Public safety Economic Development 4. 2 Economy 22% Transportation 4. 1 Transportation 20% Parks, Greenspace and Recreation 4. 0 Amenities Land Use 4. 0 Amenities Housing 3. 7 Housing 18% * Based on City of Atlanta 2011 CDP Survey Results 15%
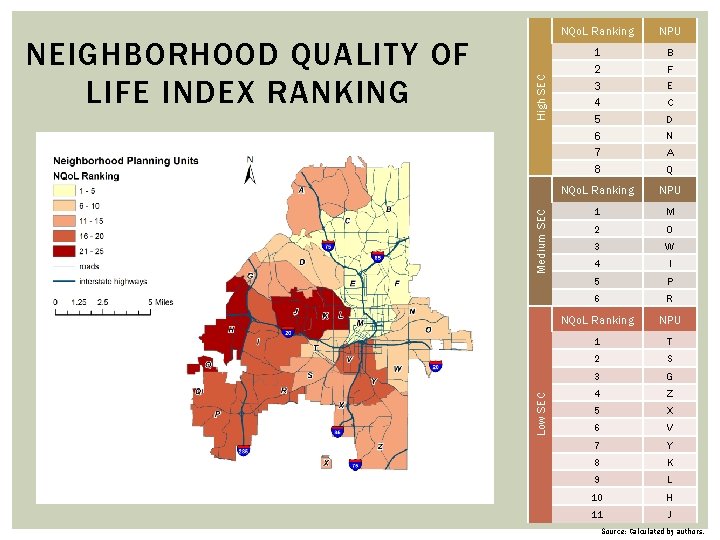
High SEC Medium SEC Low SEC NEIGHBORHOOD QUALITY OF LIFE INDEX RANKING NQo. L Ranking NPU 1 2 3 4 5 6 7 8 B F E C D N A Q NQo. L Ranking NPU 1 M 2 O 3 W 4 I 5 P 6 R NQo. L Ranking NPU 1 T 2 S 3 G 4 Z 5 X 6 V 7 Y 8 K 9 L 10 H 11 J Source: Calculated by authors.
NEIGHBORHOOD HEALTH INDEX
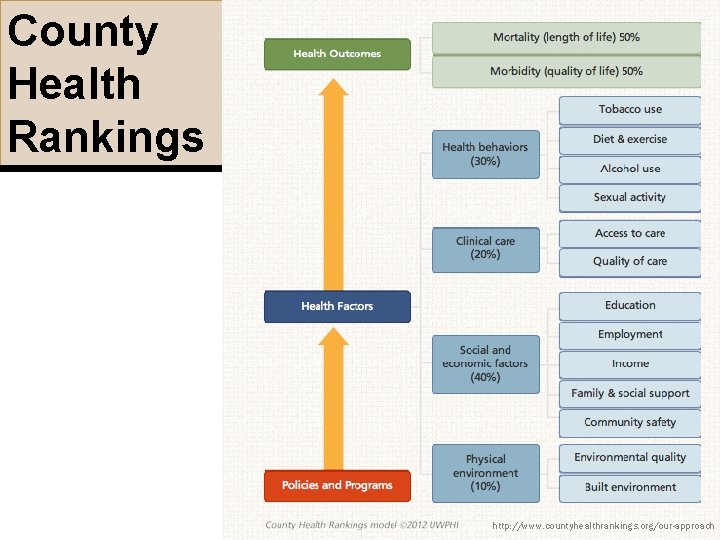
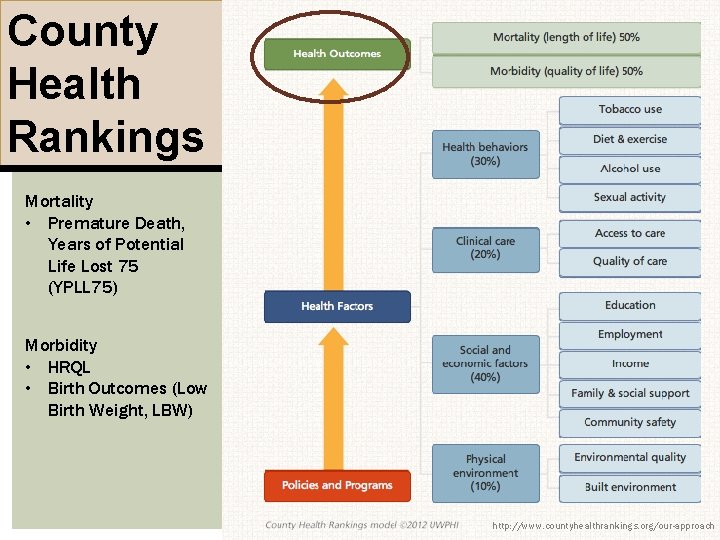
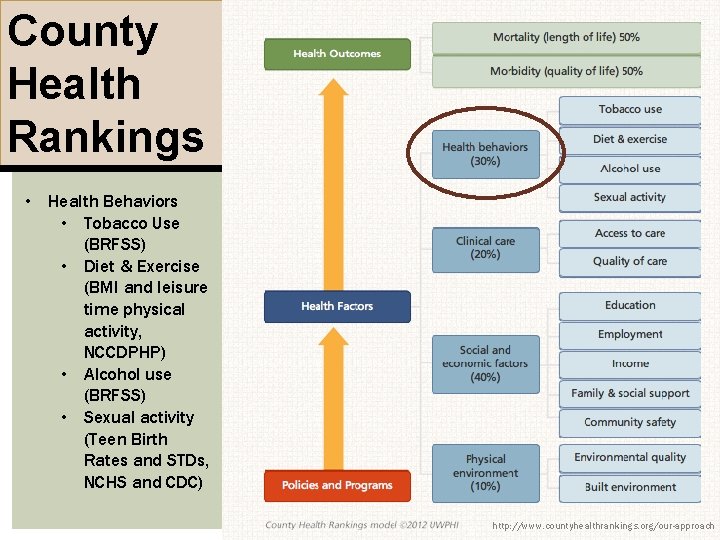
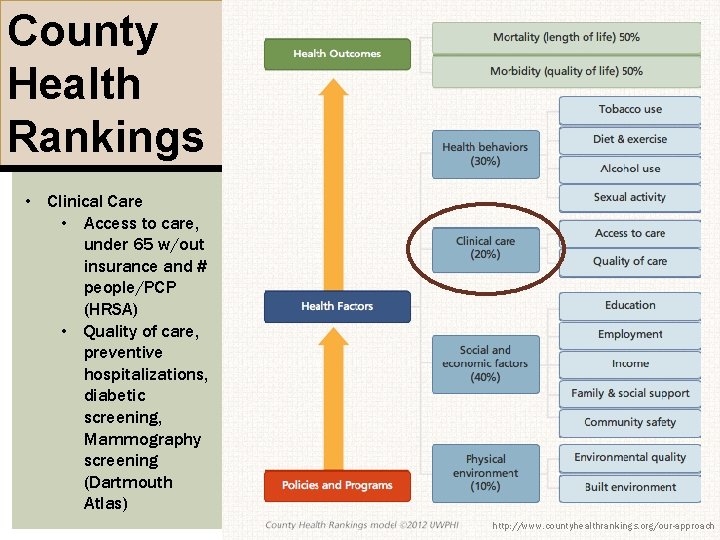
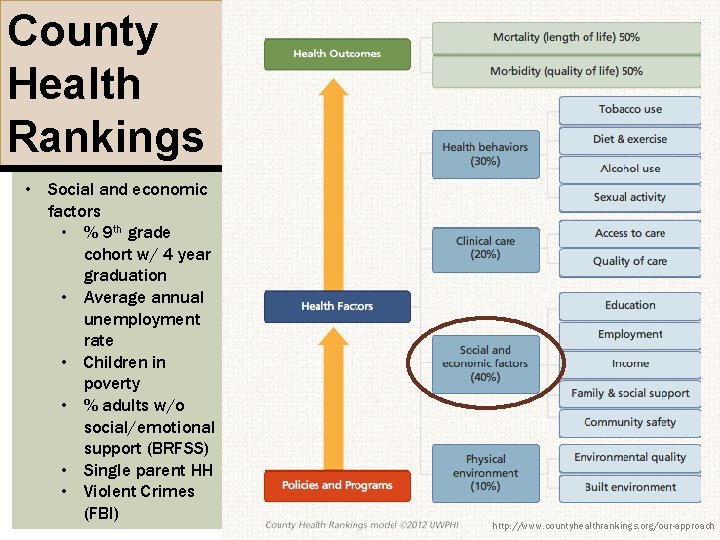
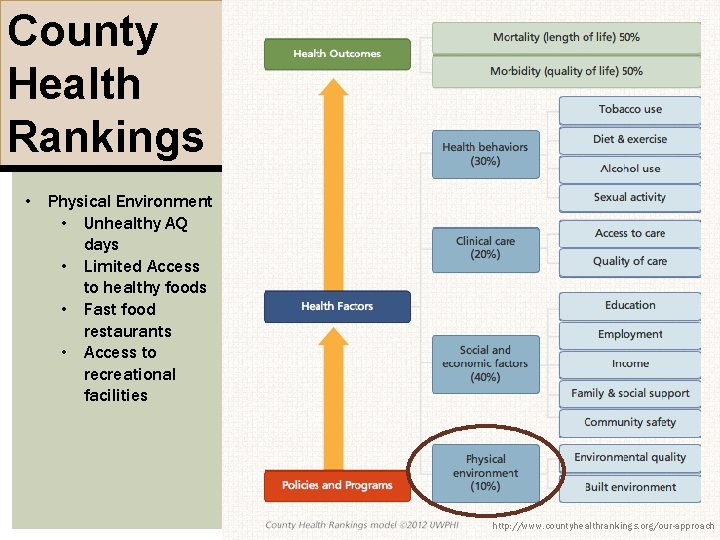
County Health Rankings http: //www. countyhealthrankings. org/our-approach
County Health Rankings Mortality • Premature Death, Years of Potential Life Lost 75 (YPLL 75) Morbidity • HRQL • Birth Outcomes (Low Birth Weight, LBW) http: //www. countyhealthrankings. org/our-approach
County Health Rankings • Health Behaviors • Tobacco Use (BRFSS) • Diet & Exercise (BMI and leisure time physical activity, NCCDPHP) • Alcohol use (BRFSS) • Sexual activity (Teen Birth Rates and STDs, NCHS and CDC) http: //www. countyhealthrankings. org/our-approach
County Health Rankings • Clinical Care • Access to care, under 65 w/out insurance and # people/PCP (HRSA) • Quality of care, preventive hospitalizations, diabetic screening, Mammography screening (Dartmouth Atlas) http: //www. countyhealthrankings. org/our-approach
County Health Rankings • Social and economic factors • % 9 th grade cohort w/ 4 year graduation • Average annual unemployment rate • Children in poverty • % adults w/o social/emotional support (BRFSS) • Single parent HH • Violent Crimes (FBI) http: //www. countyhealthrankings. org/our-approach
County Health Rankings • Physical Environment • Unhealthy AQ days • Limited Access to healthy foods • Fast food restaurants • Access to recreational facilities http: //www. countyhealthrankings. org/our-approach
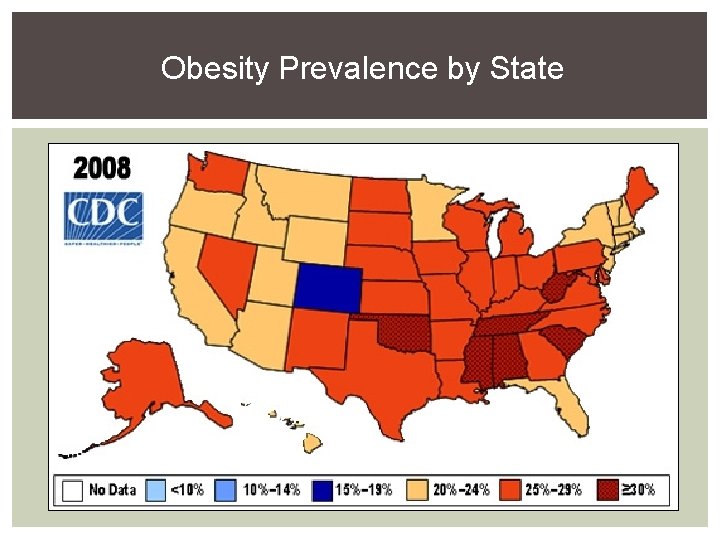
Obesity Prevalence by State
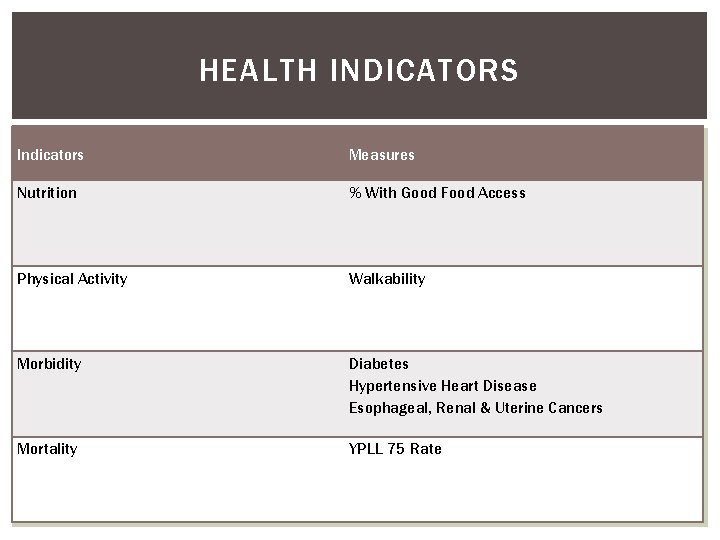
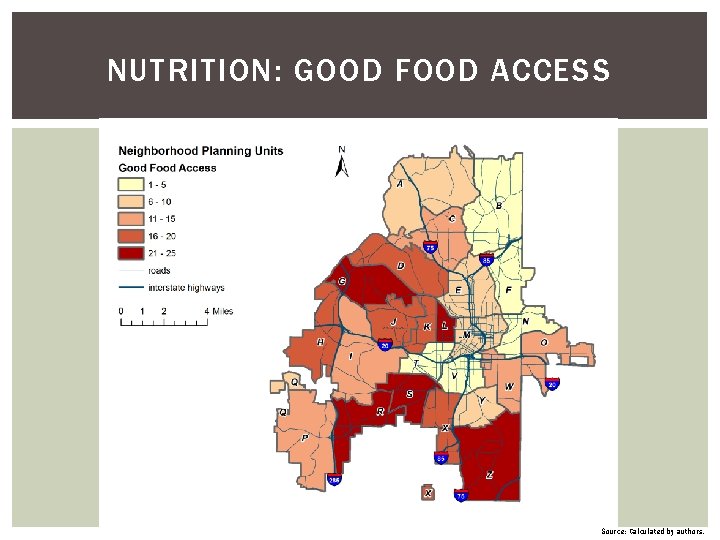
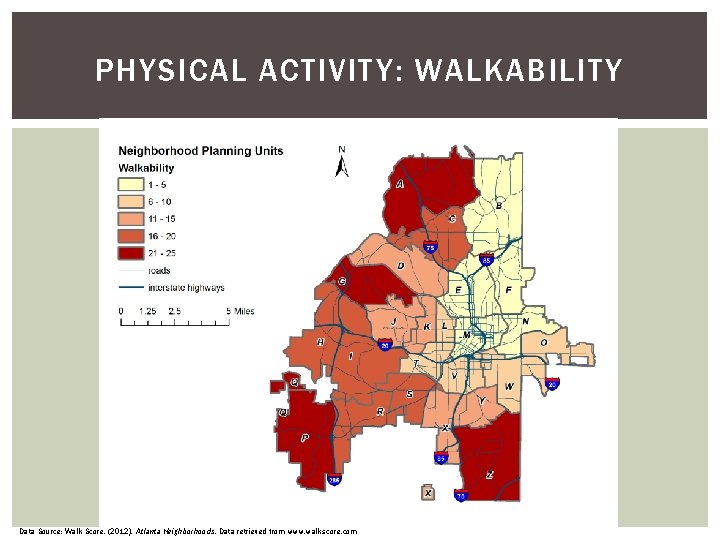
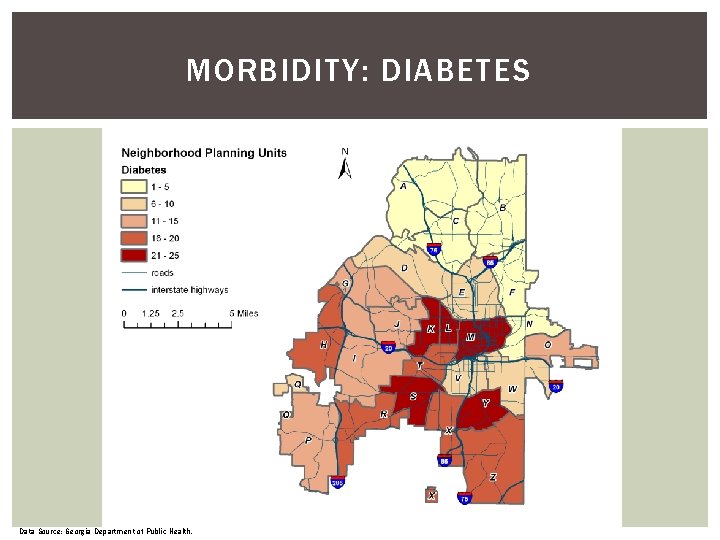
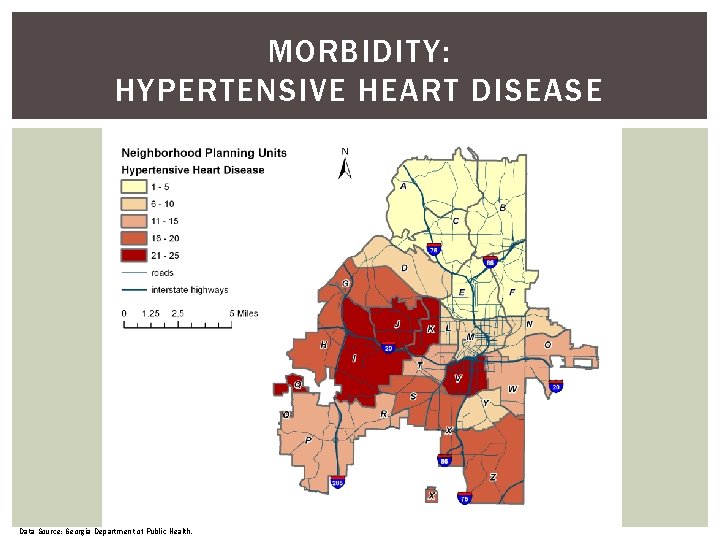
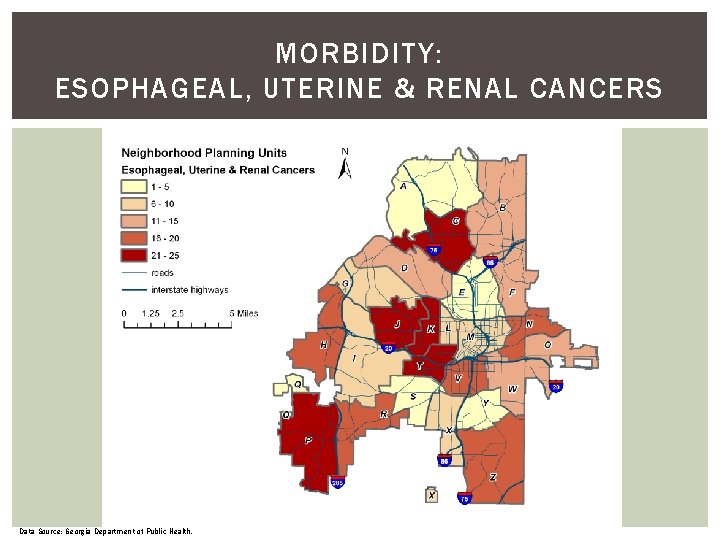
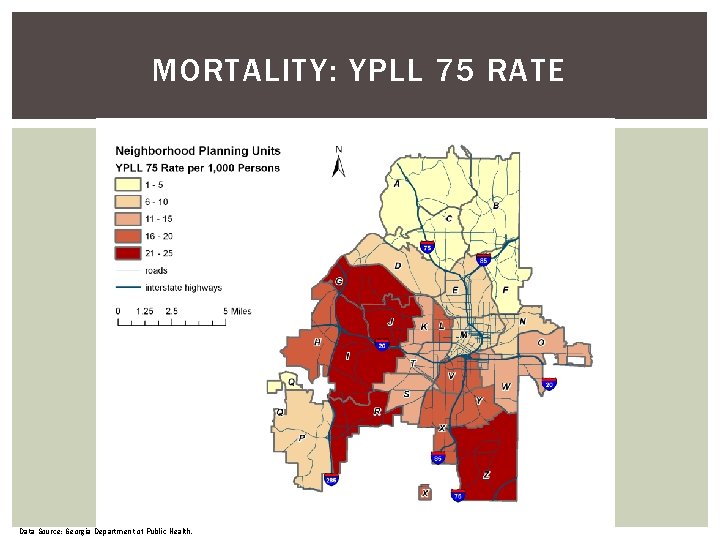
HEALTH INDICATORS Indicators Measures Nutrition % With Good Food Access Physical Activity Walkability Morbidity Diabetes Hypertensive Heart Disease Esophageal, Renal & Uterine Cancers Mortality YPLL 75 Rate
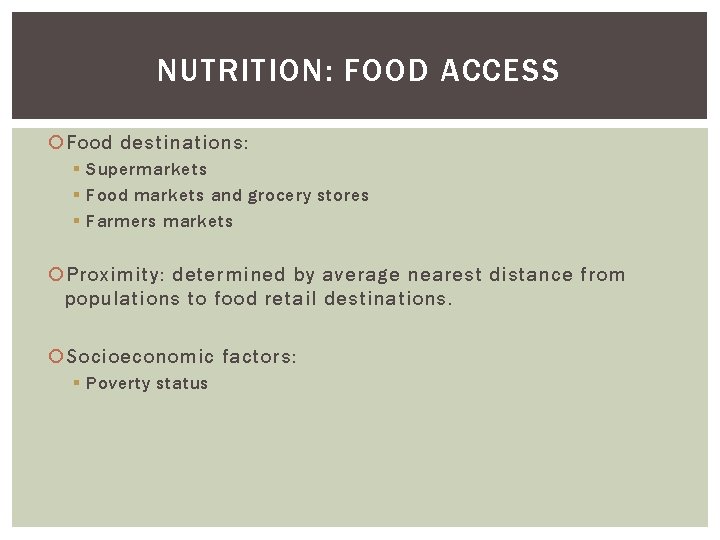
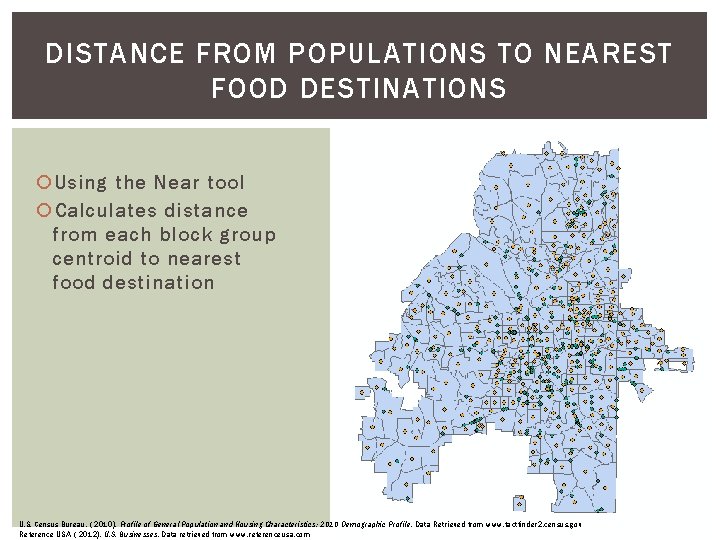
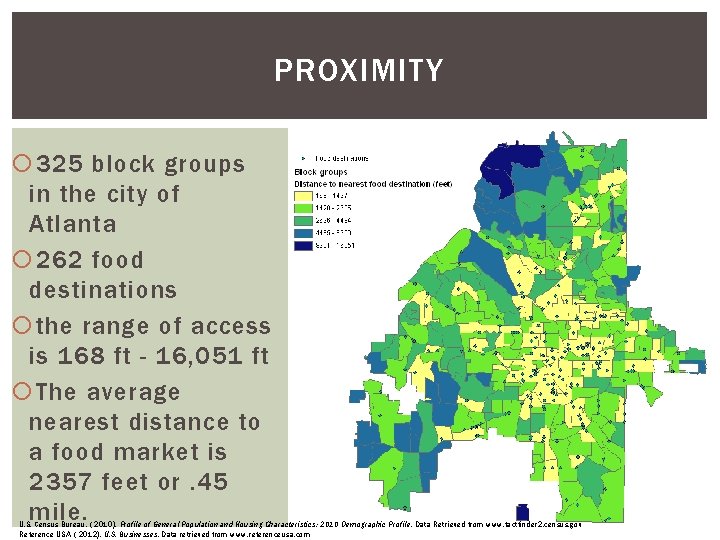
NUTRITION: FOOD ACCESS Food destinations: § Supermarkets § Food markets and grocery stores § Farmers markets Proximity: determined by average nearest distance from populations to food retail destinations. Socioeconomic factors: § Poverty status
DISTANCE FROM POPULATIONS TO NEAREST FOOD DESTINATIONS Using the Near tool Calculates distance from each block group centroid to nearest food destination U. S. Census Bureau. ( 2010). Profile of General Population and Housing Characteristics: 2010 Demographic Profile. Data Retrieved from www. factfinder 2. census. gov Reference USA. ( 2012). U. S. Businesses. Data retrieved from www. referenceusa. com
PROXIMITY 325 block groups in the city of Atlanta 262 food destinations the range of access is 168 ft - 16, 051 ft The average nearest distance to a food market is 2357 feet or. 45 mile. U. S. Census Bureau. ( 2010). Profile of General Population and Housing Characteristics: 2010 Demographic Profile. Data Retrieved from www. factfinder 2. census. gov Reference USA. ( 2012). U. S. Businesses. Data retrieved from www. referenceusa. com
NUTRITION: GOOD FOOD ACCESS Source: Calculated by authors.
PHYSICAL ACTIVITY: WALKABILITY Data Source: Walk Score. (2012). Atlanta Neighborhoods. Data retrieved from www. walkscore. com
MORBIDITY: DIABETES Data Source: Georgia Department of Public Health.
MORBIDITY: HYPERTENSIVE HEART DISEASE Data Source: Georgia Department of Public Health.
MORBIDITY: ESOPHAGEAL, UTERINE & RENAL CANCERS Data Source: Georgia Department of Public Health.
MORTALITY: YPLL 75 RATE Data Source: Georgia Department of Public Health.
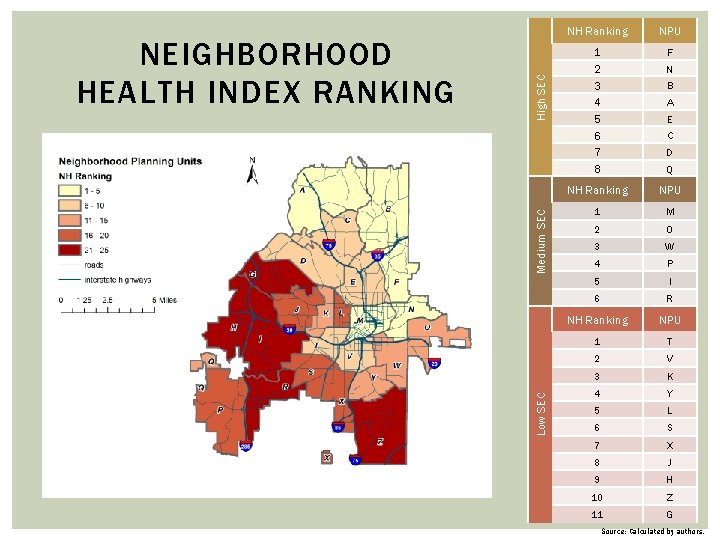
High SEC Medium SEC Low SEC NEIGHBORHOOD HEALTH INDEX RANKING NH Ranking NPU 1 2 3 4 5 6 7 8 F N B A E C D Q NH Ranking NPU 1 M 2 O 3 W 4 P 5 I 6 R NH Ranking NPU 1 T 2 V 3 K 4 Y 5 L 6 S 7 X 8 J 9 H 10 Z 11 G Source: Calculated by authors.
DISCUSSION
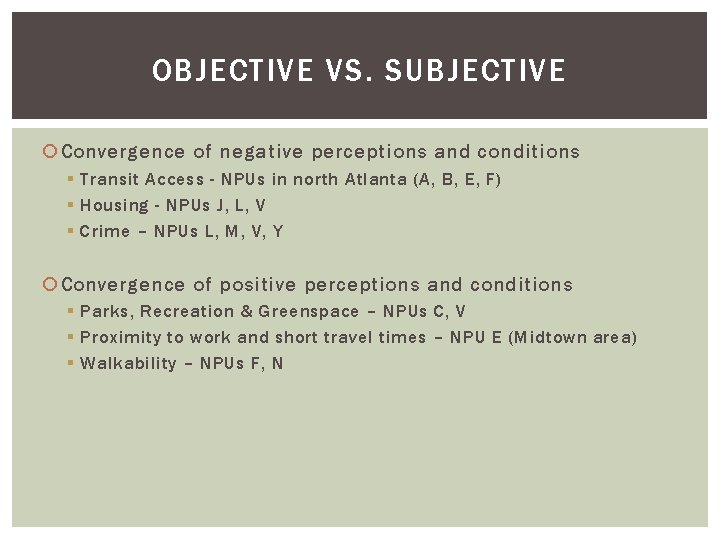
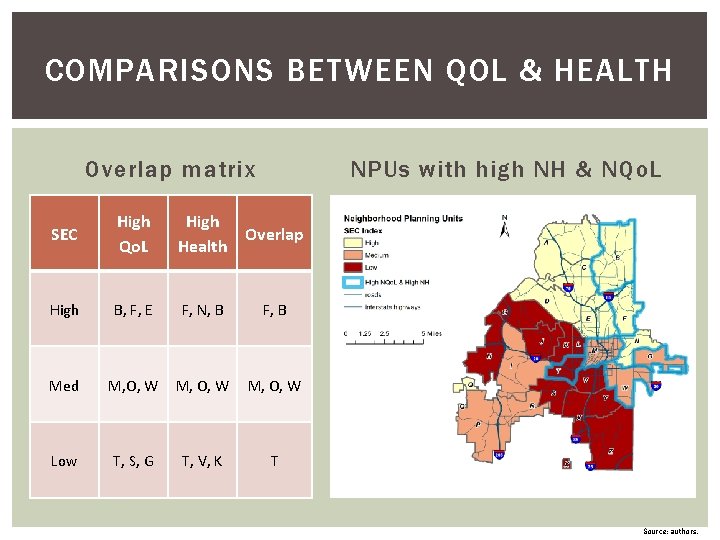
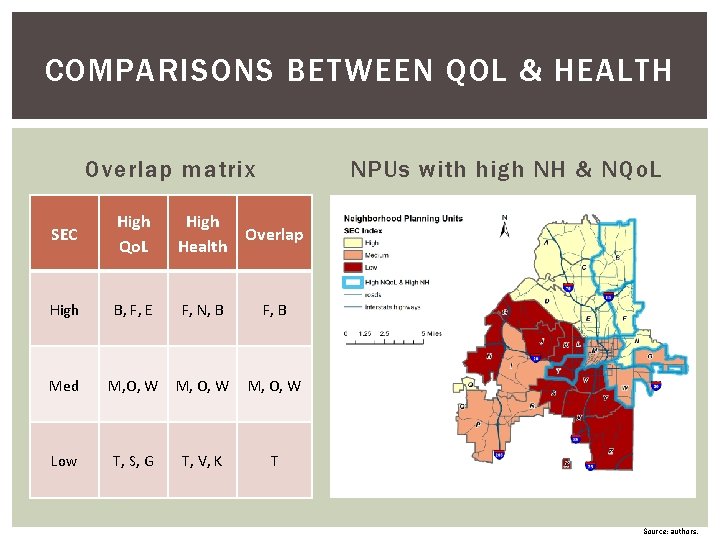
OBJECTIVE VS. SUBJECTIVE Convergence of negative perceptions and conditions § Transit Access - NPUs in north Atlanta (A, B, E, F) § Housing - NPUs J, L, V § Crime – NPUs L, M, V, Y Convergence of positive perceptions and conditions § Parks, Recreation & Greenspace – NPUs C, V § Proximity to work and short travel times – NPU E (Midtown area) § Walkability – NPUs F, N
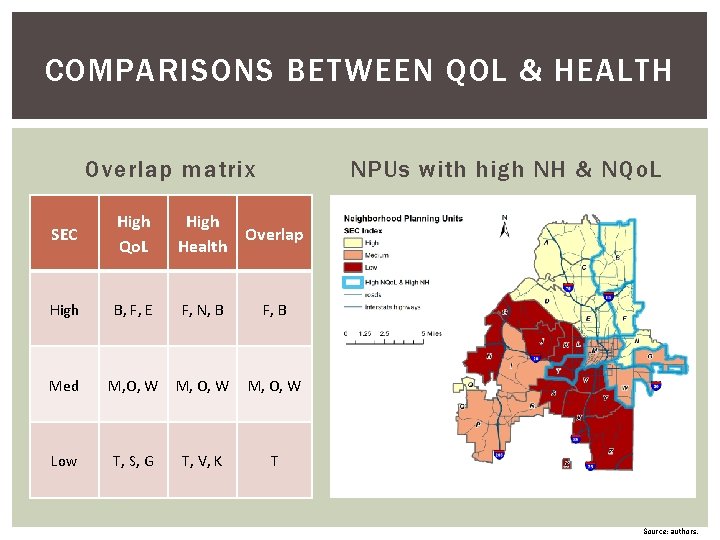
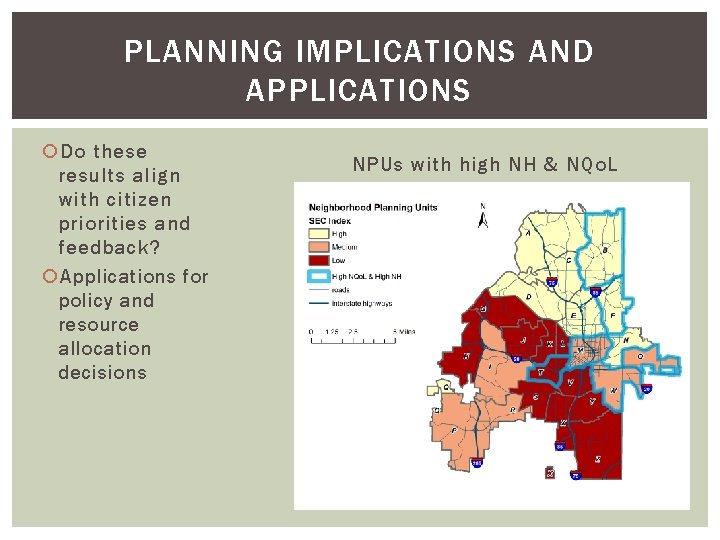
COMPARISONS BETWEEN QOL & HEALTH Overlap matrix NPUs with high NH & NQo. L SEC High Qo. L High Overlap Health High B, F, E F, N, B F, B Med M, O, W Low T, S, G T, V, K T Source: authors.
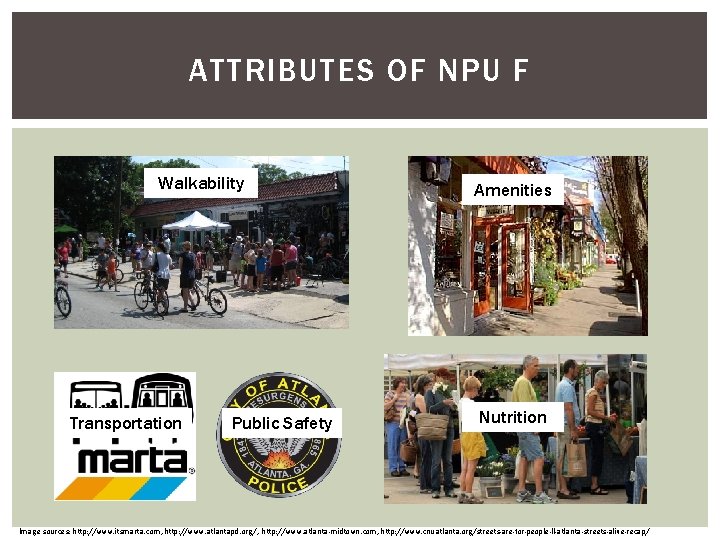
ATTRIBUTES OF NPU F Walkability Transportation Public Safety Amenities Nutrition Image sources: http: //www. itsmarta. com, http: //www. atlantapd. org/, http: //www. atlanta-midtown. com, http: //www. cnuatlanta. org/streets-are-for-people-ll-atlanta-streets-alive-recap/
COMPARISONS BETWEEN QOL & HEALTH Overlap matrix NPUs with high NH & NQo. L SEC High Qo. L High Overlap Health High B, F, E F, N, B F, B Med M, O, W Low T, S, G T, V, K T Source: authors.
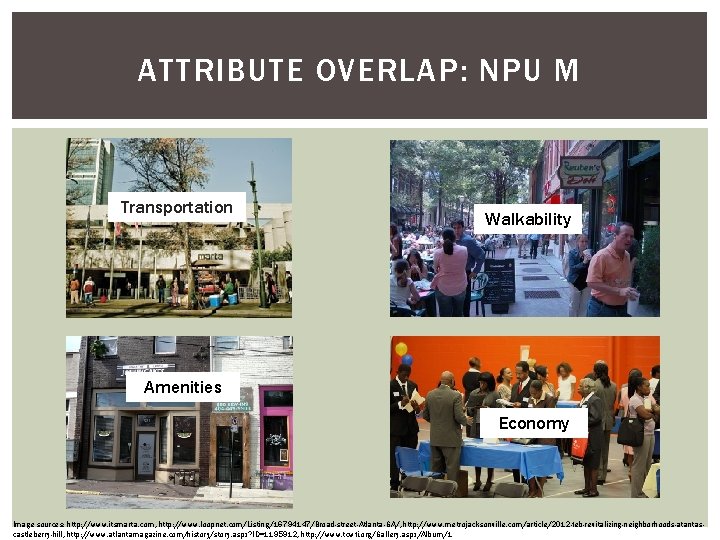
ATTRIBUTE OVERLAP: NPU M Transportation Walkability Amenities Economy Image sources: http: //www. itsmarta. com, http: //www. loopnet. com/Listing/16794147/Broad-street-Atlanta-GA/, http: //www. metrojacksonville. com/article/2012 -feb-revitalizing-neighborhoods-atantascastleberry-hill, http: //www. atlantamagazine. com/history/story. aspx? ID=1195912, http: //www. tcwfi. org/Gallery. aspx/Album/1
COMPARISONS BETWEEN QOL & HEALTH Overlap matrix NPUs with high NH & NQo. L SEC High Qo. L High Overlap Health High B, F, E F, N, B F, B Med M, O, W Low T, S, G T, V, K T Source: authors.
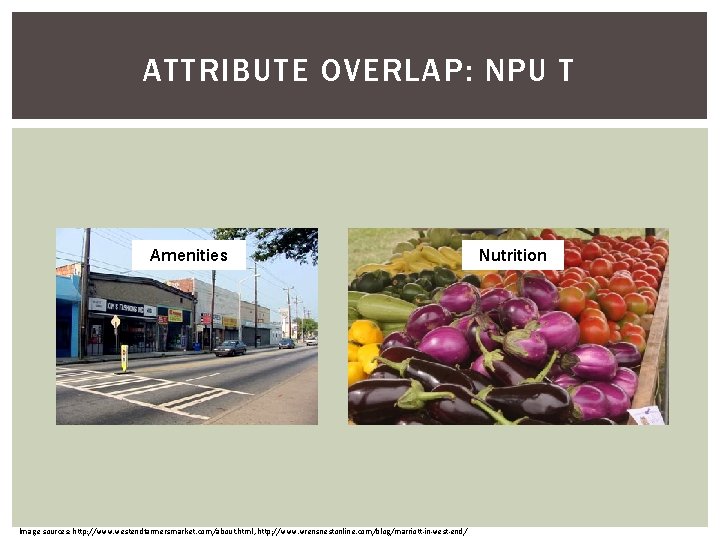
ATTRIBUTE OVERLAP: NPU T Amenities Image sources: http: //www. westendfarmersmarket. com/about. html, http: //www. wrensnestonline. com/blog/marriott-in-west-end/ Nutrition
PLANNING IMPLICATIONS AND APPLICATIONS Do these results align with citizen priorities and feedback? Applications for policy and resource allocation decisions NPUs with high NH & NQo. L