Quality Function Deployment QFD What is Quality Function
")
 is a teambased planning")


. Determining Customer")


 v How Important")

 Primary Secondary Performance Aesthetics Reasonable Cost Aerodynamic Look Nice Finish Corrosion")
 • The next step of the QFD process after identifying what")


 Customer")
 HOW’S vs. HOW’S Identifies interrelationship between each technical descriptor’s ● Strong")

 HOWS vs. HOWS • The main")


 • Assign")

 (medium- finish)")


 • Useful for prioritizing efforts and")


 = Absolute")


- Slides: 72
Quality Function Deployment (QFD)
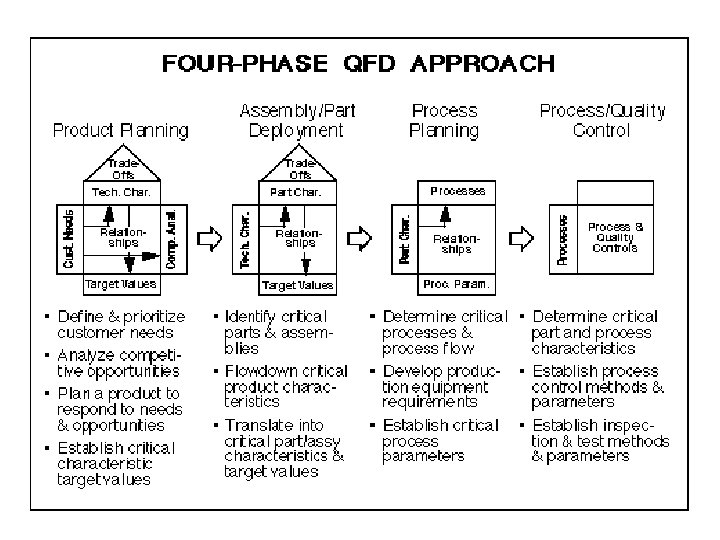
What is Quality Function Deployment? • Quality Function Deployment (QFD) is a teambased planning tool used for fulfilling customer expectations or requirements • • Deployed through: Product Planning Assembly/Part Development Process Planning Process/Quality Control
• Quality Function Deployment is…. • Customer-Driven Engineering • House of Quality • Customer-Driven Project Design • Voice of the Customer • Decision Matrix
Benefits of QFD • Product Development/Implementation time • Product Quality • Improves Customer Satisfaction • Promotes Teamwork
Steps: Quality Function Deployment 1. 2. 3. 4. 5. Identifying the Customer(s). Determining Customer Req. Prioritizing the Requirements. Competition Benchmarking. Translating the Customer Requirements into Measurable Engineering Requirements 6. Prioritize Customer Requirements
QFD is…Customer Needs • In order to begin the process for building or forming a House of Quality, one must know what the customer what wants & needs. • The QFD process incorporates the desires of the customer into the design process. The quality is built into the product during manufacturing.
Voice of the Customer This part of the design is most in depth Quality is defined by the…CUSTOMER What are their expectations? Are their expectations uses to drive the design process? • What are some things the design team can do to help achieve customer satisfaction? • •
Voice of the Customer…continued • In many instances customer requirements/expectations are not always simple or easy to identify. • The QFD Team will assist in identifying the Technical Requirements as well.
Management Tools used to Collect Data • Affinity Diagram – (Figure 17 -1 p. 446) • Interrelationship Diagram (Figure 17 -2 p. 445) • Tree Diagram (Figure 17 -3 p. 448)
Welcome to the House of Quality • A product planning matrix that is developed in Quality Function Deployment and shows the relationship between what a customer wants and how the firm that produces the product is going to meet those wants. • Increases cross functional integration within organizations. (marketing, engineering, and manufacturing) • Considered by many to be the primary chart in quality planning
Parts of the House of Quality • First and most importance – Customer Requirements (WHATs) • Second – Technical Descriptors (HOWs) • Third – Relationship between customers needs and design attributes (WHATs vs. HOWs) • Correlation Matrix (HOWs vs. HOW’s) • Customer Competitive Assessment • Technical Competitive Assessment (Set of weighted graphs) • Engineering Measures
Our Project A company that manufactures bicycle parts wants to expand their product line by producing handles for mountain bikes.
Goal of any QFD team: To make the product either more appealing then it exists or what the competition has or introduce a need that the customer is not expecting but would appreciate
The House of Quality Customer Needs § Defines relationship between customers desires and the firms product/product capabilities Correlation Matrix Technical Descriptors Relationships between Customer Needs and Design Attributes Customer Competitive Assessment Technical Competitive Assessment Engineering Measures
Key Element Voice of the Customer v Spoken & unspoken (Why) v How Important the Needs (What’s) are TO THE CUSTOMER Need 1 Need 2 Need 3 Need 4 Need 5 Need 6 Need 7
Our Affinity Diagram Aesthetics Performance Cost Lightweight Aerodynamic Strength Nice Finish Durable Corrosion Res
Customer Requirements (WHATS) Primary Secondary Performance Aesthetics Reasonable Cost Aerodynamic Look Nice Finish Corrosion Resistant Lightweight Strength Durable
Technical Descriptors (HOWs) • The next step of the QFD process after identifying what the customer wants is HOW! • How can we satisfy these wants. • Regulatory standards and requirements dictated by management must be identified. • Brainstorming • Correlation between team and customer critical
HOW CAN WE ACCOMPLISH WHAT CUSTOMER WANTS HOW HOW HOW Technical Descriptors Need 1 Need 2 Need 3 Need 4 Need 5 Need 6 Need 7 Keep to the voice of the Customer
Secondary Powder Metallurgy Forging Sand Casting Die Casting Materials Selection Welding Titanium Aluminum Steel Secondary Primary Manufacturing Process
HOW’s vs. WHAT’s WHAT 1 WHAT 2 WHAT 3 WHAT 4 WHAT 5 WHAT 6 WHAT 7 s n ip sh Re io lat HOW 7 HOW 6 HOW 5 HOW 4 HOW 3 HOW 2 Strength of the Interrelation Between the What’s and the How’s ● Strong 0 Medium ∆ Weak HOW 1 Relationship Matrix
Points to Remember • The relationship matrix shows us the relationship between customer requirements (WHATs) and Technical Descriptors (HOWs) • Customer requirements are translated into engineering characteristics (Technical Descriptors)
Steel • Steel ranks strong in reasonable cost, strength and durability in the relationship between customer requirements and technical Descriptors • It ranks medium in nice finish • It ranks weak in corrosion resistance and being lightweight • No relationship with aerodynamic look, leave blank
Aluminum Ø Aluminum ranks strong in relationship between customer requirements and technical descriptors in reasonable cost, nice finish, corrosion resistant, and being lightweight ØIt is medium in strength and being durable ØIt ranks weak in the aerodynamic look
Titanium • Titanium ranks strong in relationship between customer requirements and technical descriptors in nice finish, corrosion resistant, lightweight and strength • It ranks medium in being durable • It ranks weak in reasonable cost and aerodynamic look
Welding • Welding ranks strong in relationship between customer requirements and technical Descriptors as far as reasonable cost • It ranks weak in aerodynamic look, nice finish, corrosion resistant, strength and durability • There is no relationship between welding and being lightweight so leave blank
Die Casting • Die Casting ranks strong in the relationship between customer requirements and technical descriptors in aerodynamic look and nice finish and being durable. • It ranks medium in cost and corrosion resistant and strength • There is no relationship between die casting and being lightweight so leave blank
Sand Casting • Sand Casting ranks strong in the relationship between customer requirements and technical descriptors in reasonable cost • It ranks medium in aerodynamic look and corrosion resistant and being durable and strength • There is a weak relationship with nice finish • There is no relationship between sand casting and being lightweight so leave blank
Forging • Forging ranks strong in the relationship between customer requirements and technical descriptors in strength and being durable • There is a medium relationship in aerodynamic look, corrosion resistant , cost and a nice finish • There is no relationship between forging and being lightweight so leave blank
Powder Metallurgy • Powder Metallurgy ranks strong in the relationship between customer requirements and technical descriptors in aerodynamic look and nice finish • It ranks medium in being durable and corrosion resistant • There is a weak relationship with strength and lightweight and reasonable cost
Points to Consider with Relationship Matrix • If there are empty rows (horizontal) Customer requirement has not been met! • If there are empty columns, (vertical) then that particular technical descriptor does not affect customer requirements and may be removed from House of Quality
Correlation Matrix (Roof) HOW’S vs. HOW’S Identifies interrelationship between each technical descriptor’s ● Strong Positive ○ Positive X Negative * Strong Negative
Positive Correlation Negative correlation A strong positive correlation would be nearly perfect correlation (technical descriptor’s support each other) A strong negative correlation mean technical descriptor’s do not support each other
Interrelationship Matrix • Next –Correlate the Interrelationship (Roof) HOWS vs. HOWS • The main function of the interrelationship matrix is to establish a connection between the customer’s product requirements and the performance measures designed to improve the product.
Steel • • • Steel is strong positive in Welding Steel is positive in Die casting Steel is strong positive in Sand Casting Steel is strong negative in Forging Steel is negative in Powder Metallurgy
Aluminum • • • Aluminum is: Positive in Welding Strong positive in Die Casting Positive in Sand Casting Negative in Forging Positive in Powder Metallurgy
Titanium • • • It is a negative relationship in Welding It is positive in Die Casting It is a strong negative in Sand Casting It is negative in Forging It is a strong positive relationship in Powder Metallurgy
Conflicting Technical Descriptors can mean Tradeoffs Using the QFD matrix lets you acknowledge Tradeoffs in the planning stage before actual production If tradeoffs not resolved they can lead to customer unfulfilled requirements, increased costs, poorer quality, longer production times
Next – Customer Competitive Assessment Voice of the Customer • Customers perception of product relative to competition (collected data) v Has customer requirements been met? v What areas to concentrate on? v Where does our competition rank?
Customer Information
r Product 3 4 4 4 3 3 3 This is how our Product Ranked in the Customer Competitive Assessment
Competition • A’s Product 4 5 5 4 4 3 3 B’s Product 2 3 3 2 2 4 4
Technical Competitive Assessment • Evaluation for Technical Descriptors (HOWs vs. competitors HOWs) • Assign ratings to each technical descriptor (1= worst to 5 = best) • Evaluation of competition helps to highlight the absolute strengths and weaknesses in competing products.
Competition A’s • Titanium • Die Casting B’s • Steel • Welding Ours ?
Technical Competitive Assessment- Material ü Steel = (strong – cost, strength, durability) (medium- finish) (weak -weight, corrosion res. ) ü Aluminum= (strong – cost, finish, corrosion res. & weight) (medium- strength, durability) (weak –look) ü Titanium =(strong – finish, corrosion res. lightweight, strength) (medium-durable)(weak – cost, look)
Technical Competitive Assessment Steel Aluminum Titanium Welding Die-casting Sand Casting Forging Powder OURS 0 5 A’s 0 0 B’s 5 0 0 0 5 5 0 4 0 0 0 0 0
Technical Competitive Assessment Ours • Aluminum • Die Casting A’s • Titanium • Die Casting B’s • Steel • 80% Welding
Prioritized Customer Requirements • Customer rankings determine the base that requirements are prioritized. 1. Importance to Customer 2. Target Value 3. Scale-up Factor 4. Sales Point 5. Absolute Weight
Focus Team Information (ranks relative importance to customer) • Useful for prioritizing efforts and trade-off decisions Team may have different priorities
Importance to Customer 8 5 5 2 7 5 3 Rank each customers requirement by assigning it a value- 10 the highest -1 the least importance Our focus team states: Cost ranks 8 out of 10 Lightweight is 7 out of 10 Aerodynamic Look, Finish, Strength are medium at a 5 out of 10 Durable is 3 out of 10 Corrosion Resistant is 2 out of 10
Target Value This is the column where the QFD Team decides if they want to: v keep their product unchanged v improve the product v or make the product better then what the competition does.
Target Value Cost +1 Look Finish Corrosion Res. Lightweight +1 Strength Durable
Our Product 3 4 4 4 3 3 3 Target Value Cost Look 4 Finish Corrosion Res. 4 Lightweight Strength Durable 4 4 4 3 3
Scale-Up Factor • The ratio of target value to the product rating given in the customer competitive assessment. • The question is what level is the product on now and what is the target rating? Is the distance within reason? The higher the number, the more effort is needed. • Sometimes there is not a choice due to difficulties in reaching target. Therefore the target has to be reduced to attainable levels.
Scale –Up Factor
Ratio of Scale-Up Cost 1. 3 Weight 1. 3 1 1 1 • Ratio of target value to the product rating given in the customer competitive assessment • In this case, Cost and Lightweight had a product rating of 3 and the target value is 4 so scale-up factor is 1. 3 • The other items are multiplied by 1 to show no further target value
Sales Point Weight for Marketability 1. 5 1 1 2 1 1 • How well a Customer Requirement will Sell • Object- Promote the Best Customer Requirement and any other of the customer requirement that will help in the sale of the product • Sales Point is a value between 1. 0 and 2. 0 with 2. 0 being the Highest • In this case, lightweight is the strongest at 2 • The cost and Aerodynamic look rank 1. 5 • The rest are 1 as they do not factor in sale
Absolute Weight (Importance to the Customer x Scale-Up factor x Sales Point) = Absolute Weight After summing all the absolute weights, a percent and rank for each customer requirement can be determined.
Absolute Weight 16 8 5 2 18 5 3 The weight can then be used as a guide for the planning section of the product development
Prioritized Technical Descriptors • This is a block of rows in the foundation of the house corresponding to each technical descriptor. These contain degree of technical difficulty, target value and absolute and relative weights. The QFD team identifies technical descriptors that are most needed to fulfill customers expectations and need improvement
Voice of the Company Engineers and trained personal provide objective data: üUncover gaps in engineering ü Enable designers to seek opportunities for improvement ü Links QFD to a company’s strategic vision and allows priorities to be set in the design process.
Points to Consider Team should consider: • • Available technology Technical characteristics Cost Schedule Supplier/subcontractor capability Manufacturing capabilities Personnel qualifications
Probability Factor Probability factors represent the perceived possibility of achieving each how. A low possibility factor can indicate that a current solution will not be competitive. Probability factors are used to weigh each HOW and affect the final QFD results
Degree of Technical Difficulty This step provides objectives that guide the design, objectively assesses progress 1 6 9 4 7 3 6 9 Least Difficult = 1 to Most Difficult = 10 Example- The degree of difficulty for Die Casting is 7 and the degree of difficulty for Sand Casing is 3 because it is a much easier manufacturing process-
Target This is a objective measure that defines Value values that must be obtained to achieve the technical descriptors. How much it takes to meet or exceed the customers expectations is answered by evaluating all the information entered into the House of Quality and selecting target values 5 5 5 4 5 0 0 0
Absolute Weights assigned to relationship matrix times Importance to Customer • Translate symbol into numbers • Example – Aluminum is for reasonable cost. =9 • Corresponding row in Importance to Customer is 8 (9 x 8)+(1 x 5)+(9 x 2)+(9 x 7)+(3 x 5)+(3 x 3) = 227 Absolute weight for aluminum is 227
Relative Weights assigned to relationship matrix times Absolute Weight • Translate symbol into numbers • Example – Aluminum is for reasonable cost. =9 • Corresponding row in Absolute Weight 16 • (9 x 16)+(1 x 8)+(9 x 5)+(9 x 2)+(9 x 18)+(3 x 5)+(3 x 3) = 401 Relative Weight for Aluminum is 401
Absolute Weights Relative Weights • • Steel Aluminum Titanium Welding Die Casting Sand Casting Forging Powder Metallurgy 168 251 227 401 193 92 162 122 132 125 303 167 213 203 165 171
Customer and Design Requirements • Higher absolute and Relative ratings identify areas where engineering efforts need to be concentrated • Handlebars will involve: • Aluminum for the material • Die Casting for the process
Component Requirements Process Operations 4 Quality Control Plan Process Operations 3 Component Requirements 2 Design Requirements Customer Requirements 1 CONCLUSION Design Requirements The How’s at One Level Become the What’s at the Next Level
References DR. RICK EDGEMAN, PROFESSOR & CHAIR – SIX SIGMA BLACK BELT Department of Statistics University of Idaho TOTAL QUALITY MANAGEMENT DALE BESTERFIELD, CAROL BESTERFIELD-MICHINA, GLEN BESTERFIELD, MARY BESTERFIELD-SACRE 2003 KIPP REYNOLDS STUDENT EASTERN UNIVERSITY 2007