QAD West Coast User Group Demand Planning 7



- Slides: 66
QAD West Coast User Group Demand Planning 7. 0 Mark K Williams, CFPIM, CSCP 2013 QAD Global Supply Chain Planning Practice March 18,
Introduction Agenda • Introduction to Dyna. Sys • Introduction to forecasting • Demand Planning 7. 0 attributes • Easy On Boarding 2
Introduction to Dyna. Sys 3
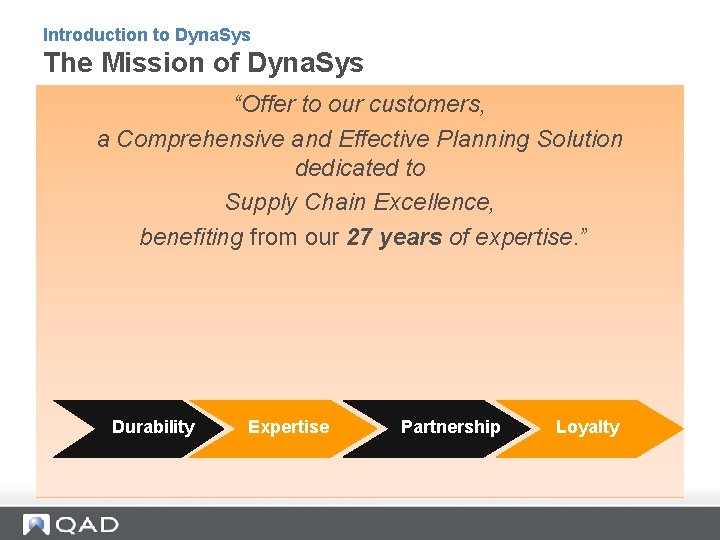
Introduction to Dyna. Sys The Mission of Dyna. Sys “Offer to our customers, a Comprehensive and Effective Planning Solution dedicated to Supply Chain Excellence, benefiting from our 27 years of expertise. ” Durability Expertise Partnership Loyalty
A Few Dyna. Sys Customers 5
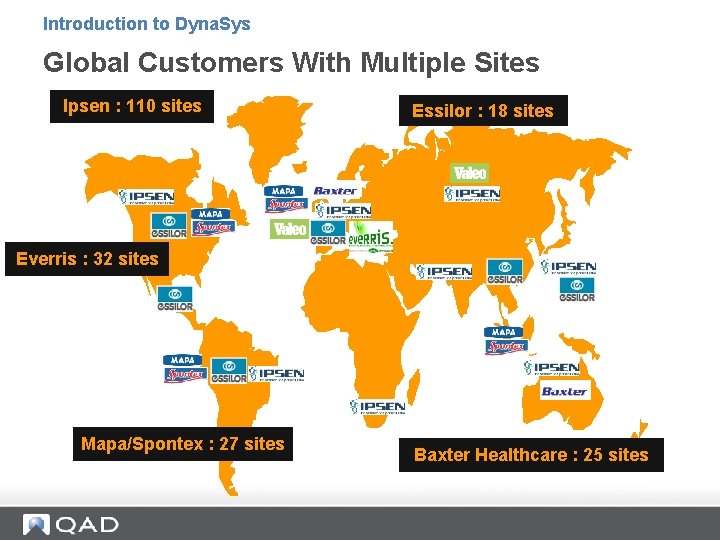
Introduction to Dyna. Sys Global Customers With Multiple Sites Ipsen : 110 sites Essilor : 18 sites Everris : 32 sites Mapa/Spontex : 27 sites Baxter Healthcare : 25 sites
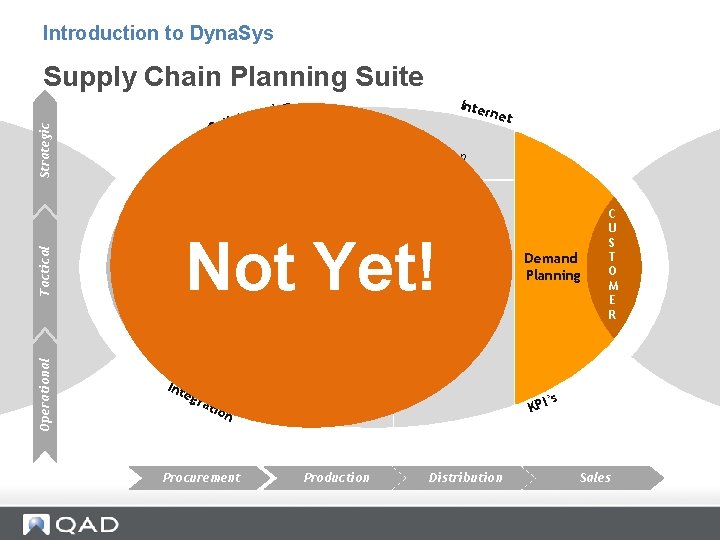
Introduction to Dyna. Sys Supply Chain Planning Suite Inte r ion Operational Tactical Strategic rat o b a l Col net Master Planning Network & Inventory Optimisation S U P P Procurement L Planning I E R Not Yet! Int egr Production Planning Distribution Planning ’s KPI ati on Procurement Demand Planning C U S T O M E R Production Distribution Sales
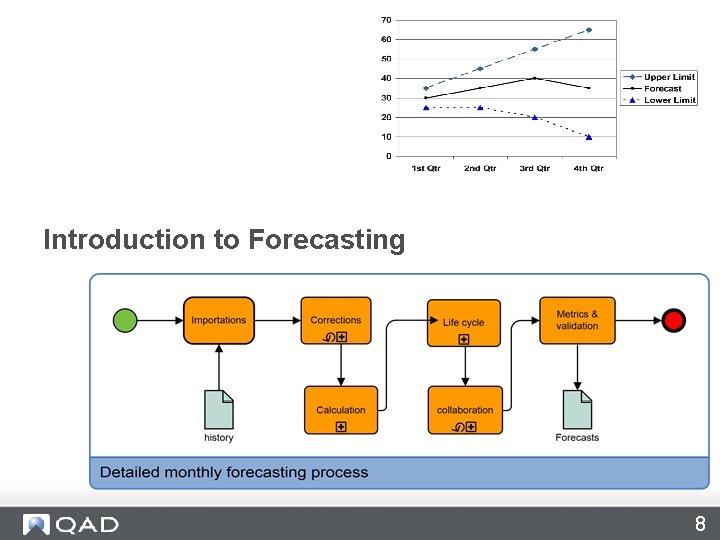
Introduction to Forecasting 8
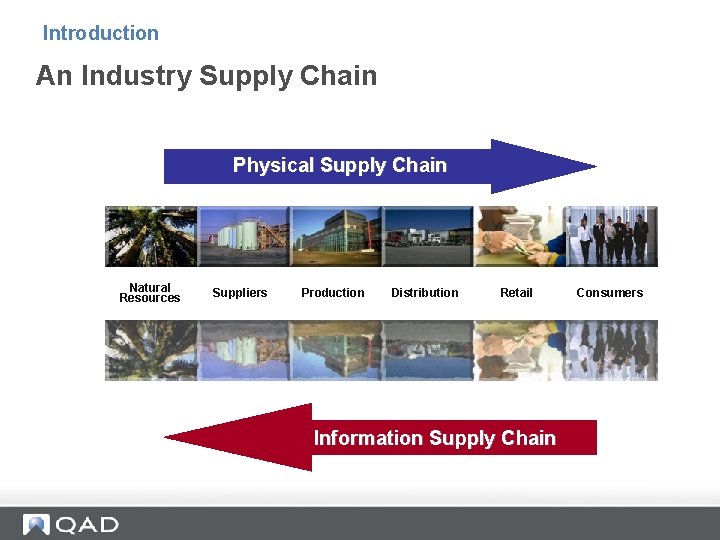
Introduction An Industry Supply Chain Physical Supply Chain Natural Resources Suppliers Production Distribution Retail Information Supply Chain Consumers
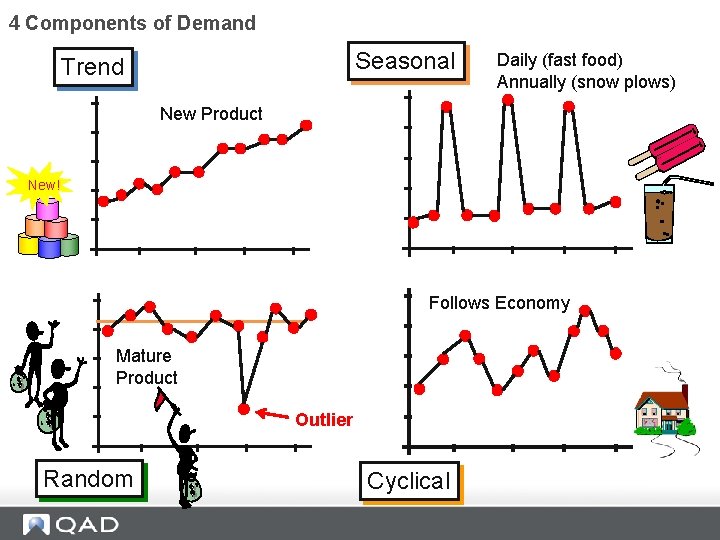
Introduction What is a Forecast? An estimate of future demand. A forecast can be constructed using quantitative methods, qualitative methods, or a combination of methods, and it can be based on extrinsic (external) or intrinsic (internal) factors. Various forecasting techniques attempt to predict one or more of the four components of demand: cyclical, random, seasonal, and trend. APICS Dictionary
4 Components of Demand Seasonal Trend Daily (fast food) Annually (snow plows) New Product New! Follows Economy Mature Product Outlier Random Cyclical
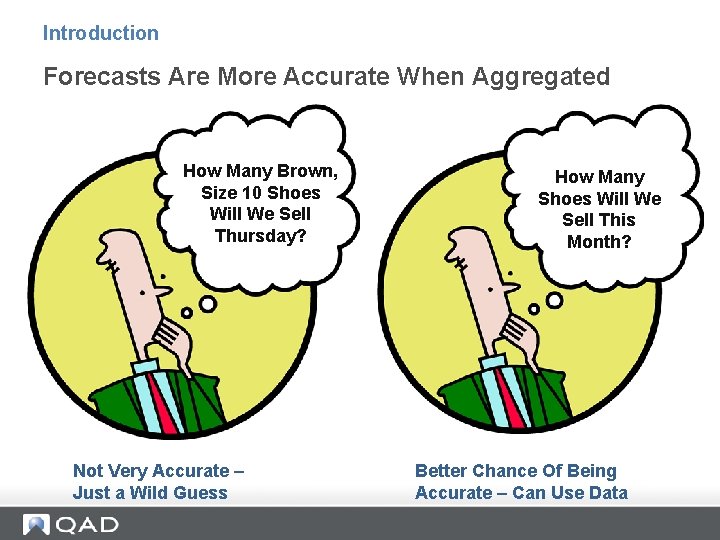
Introduction Forecasts Are More Accurate When Aggregated How Many Brown, Size 10 Shoes Will We Sell Thursday? Not Very Accurate – Just a Wild Guess How Many Shoes Will We Sell This Month? Better Chance Of Being Accurate – Can Use Data
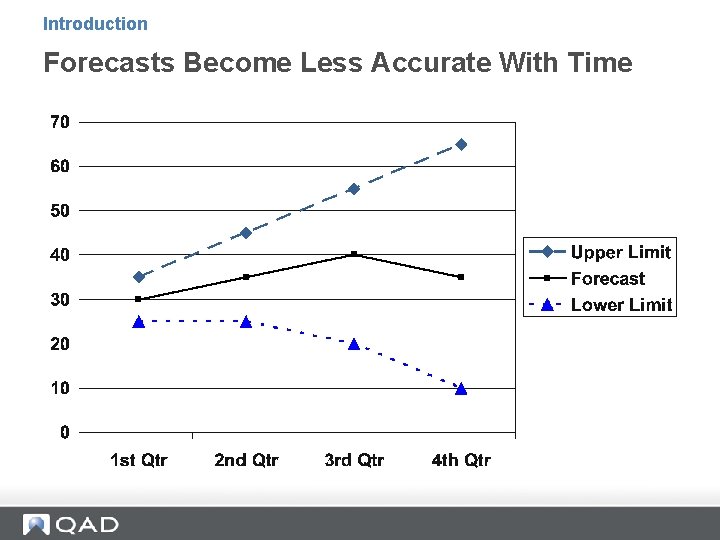
Introduction Forecasts Become Less Accurate With Time
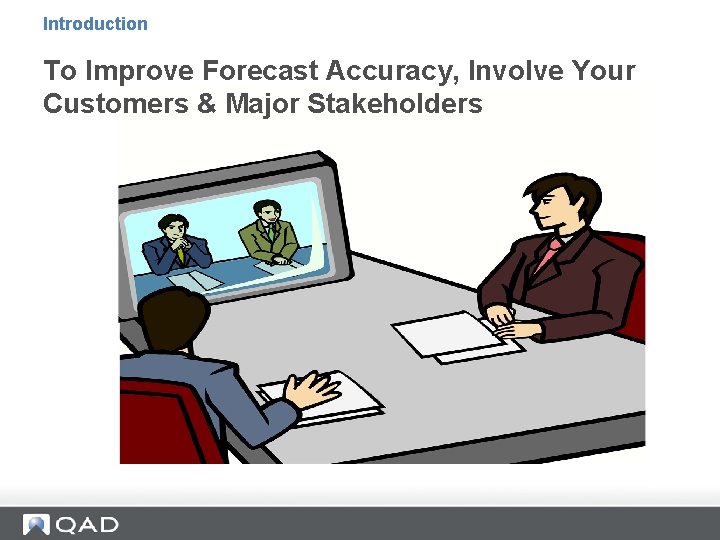
Introduction To Improve Forecast Accuracy, Involve Your Customers & Major Stakeholders
It All Sounds Good, But…. 15
Introduction Sr. Managers Meet To Discuss Forecasting 16
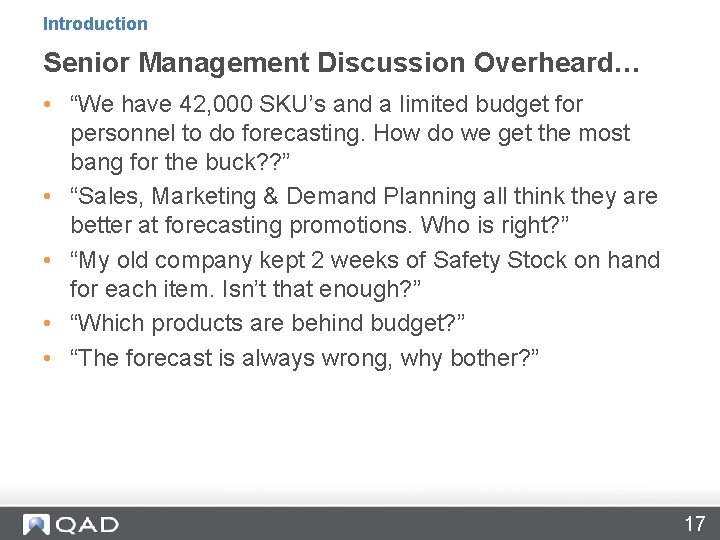
Introduction Senior Management Discussion Overheard… • “We have 42, 000 SKU’s and a limited budget for personnel to do forecasting. How do we get the most bang for the buck? ? ” • “Sales, Marketing & Demand Planning all think they are better at forecasting promotions. Who is right? ” • “My old company kept 2 weeks of Safety Stock on hand for each item. Isn’t that enough? ” • “Which products are behind budget? ” • “The forecast is always wrong, why bother? ” 17
Senior Management Overheard…. “The Forecast Is Always Wrong, Why Bother? ” 18
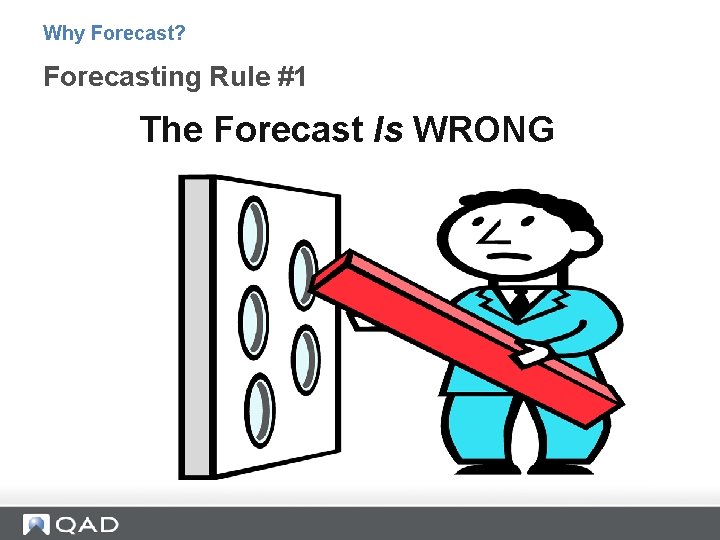
Why Forecast? Forecasting Rule #1 The Forecast Is WRONG
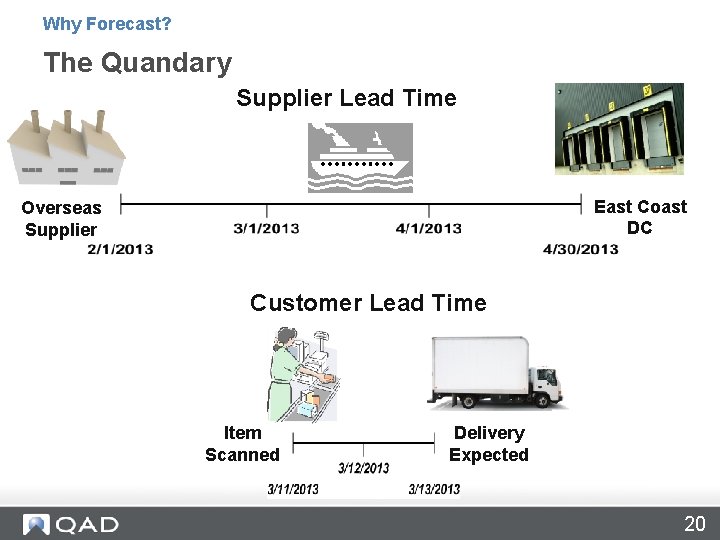
Why Forecast? The Quandary Supplier Lead Time East Coast DC Overseas Supplier Customer Lead Time Item Scanned Delivery Expected 20
Why Forecast? Companies That Do Not Adequately Forecast: • Often have employees that work overtime for months, followed by layoffs • Are poor users of manufacturing capacity • Are unable to fulfill “surprise” customer orders • Face huge expediting charges • Have excessive inventory write-offs • Have the dreaded combination of a poor customer service level and too much inventory! • Disappoint customers by not responding to promotions on time
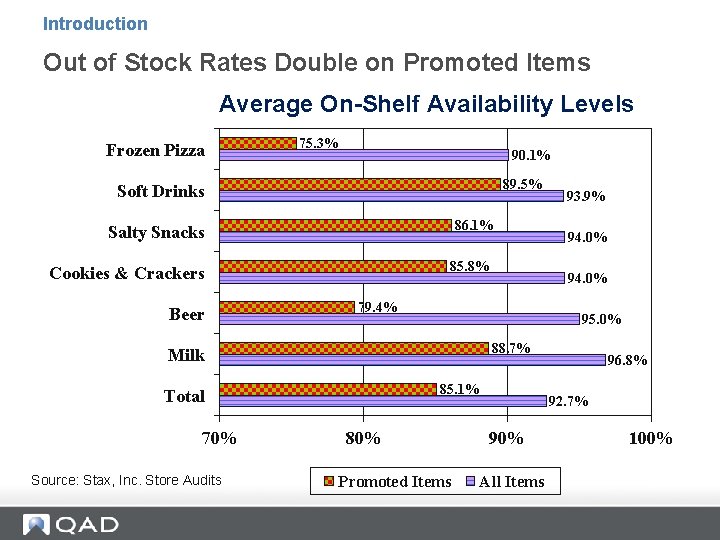
Introduction Out of Stock Rates Double on Promoted Items Average On-Shelf Availability Levels Frozen Pizza 75. 3% 90. 1% 89. 5% Soft Drinks 86. 1% Salty Snacks 85. 8% Cookies & Crackers Beer 95. 0% 88. 7% 85. 1% Total Source: Stax, Inc. Store Audits 94. 0% 79. 4% Milk 70% 93. 9% 80% Promoted Items 96. 8% 92. 7% 90% All Items 100%
Senior Management Overheard…. “We have 42, 000 SKU’s and a limited budget for personnel in forecasting. How do we get the most bang for the buck? ? ” 23
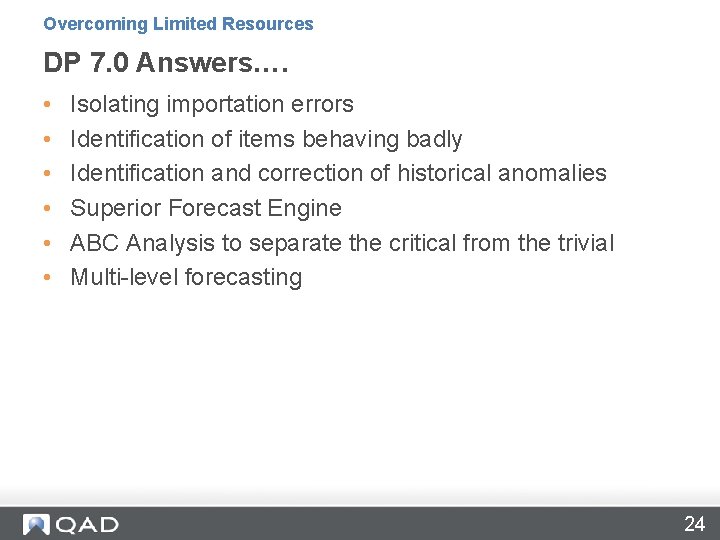
Overcoming Limited Resources DP 7. 0 Answers…. • • • Isolating importation errors Identification of items behaving badly Identification and correction of historical anomalies Superior Forecast Engine ABC Analysis to separate the critical from the trivial Multi-level forecasting 24
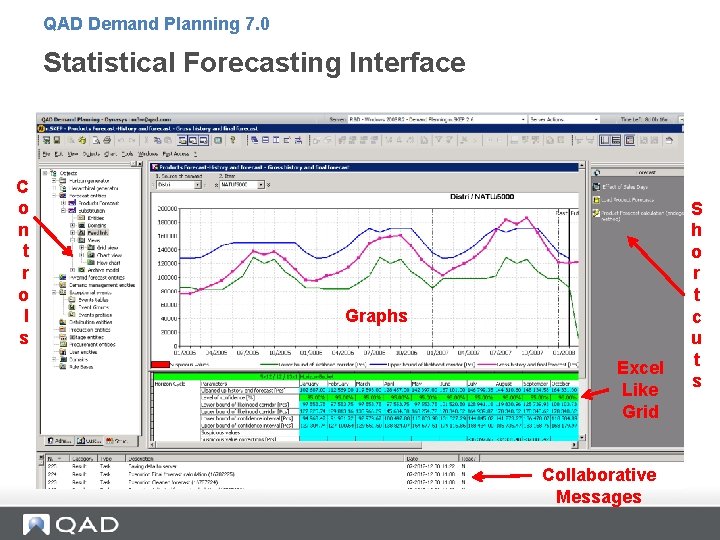
QAD Demand Planning 7. 0 Statistical Forecasting Interface C o n t r o l s Graphs Excel Like Grid Collaborative Messages S h o r t c u t s
Overcoming Limited Resources Isolating Importation Errors 26
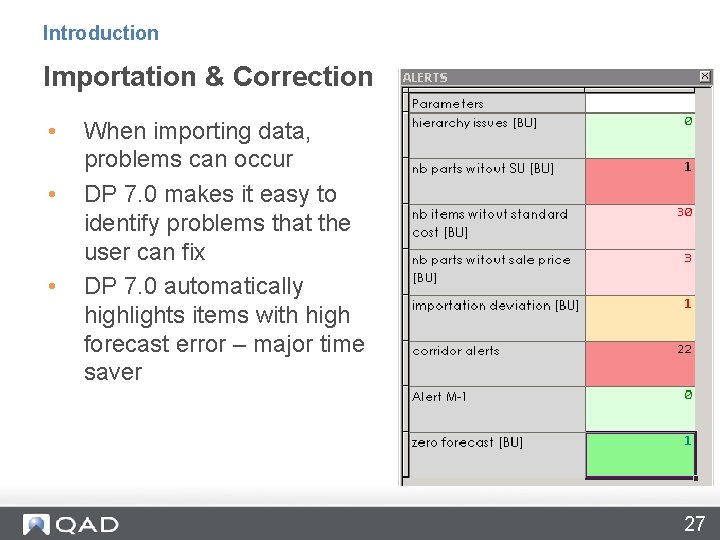
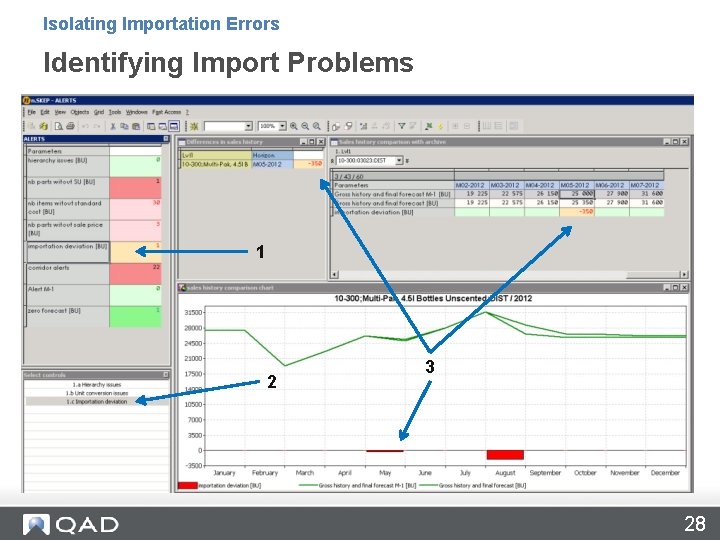
Introduction Importation & Correction • • • When importing data, problems can occur DP 7. 0 makes it easy to identify problems that the user can fix DP 7. 0 automatically highlights items with high forecast error – major time saver 27
Isolating Importation Errors Identifying Import Problems 1 2 3 28
Overcoming Limited Resources Identification Of Items Behaving Badly 29
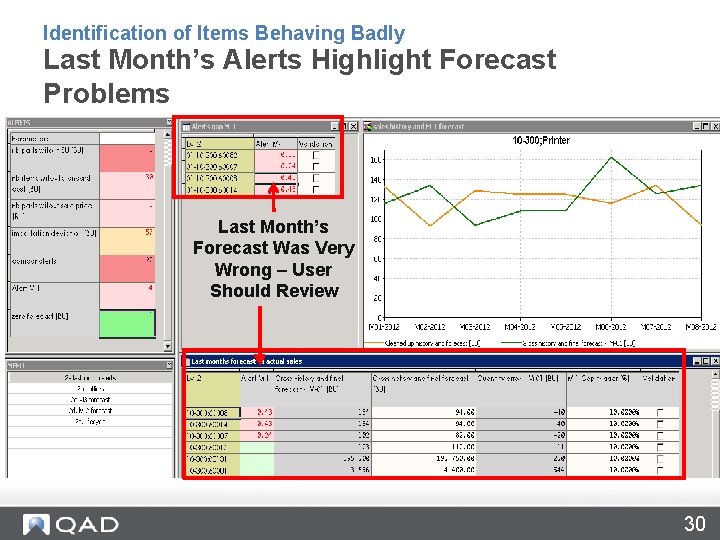
Identification of Items Behaving Badly Last Month’s Alerts Highlight Forecast Problems Last Month’s Forecast Was Very Wrong – User Should Review 30
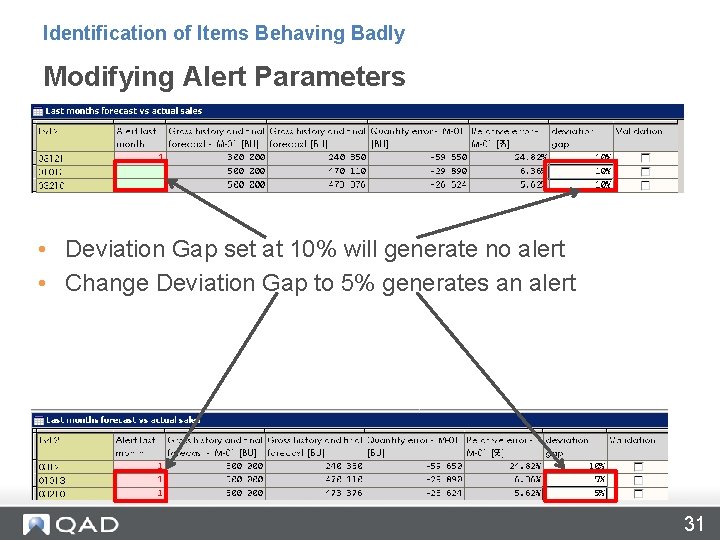
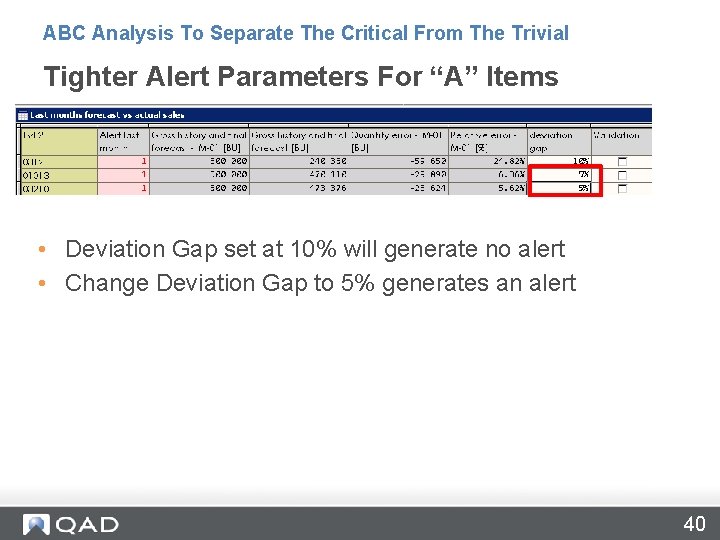
Identification of Items Behaving Badly Modifying Alert Parameters • Deviation Gap set at 10% will generate no alert • Change Deviation Gap to 5% generates an alert 31
Overcoming Limited Resources Identification And Correction Of Historical Anomalies 32
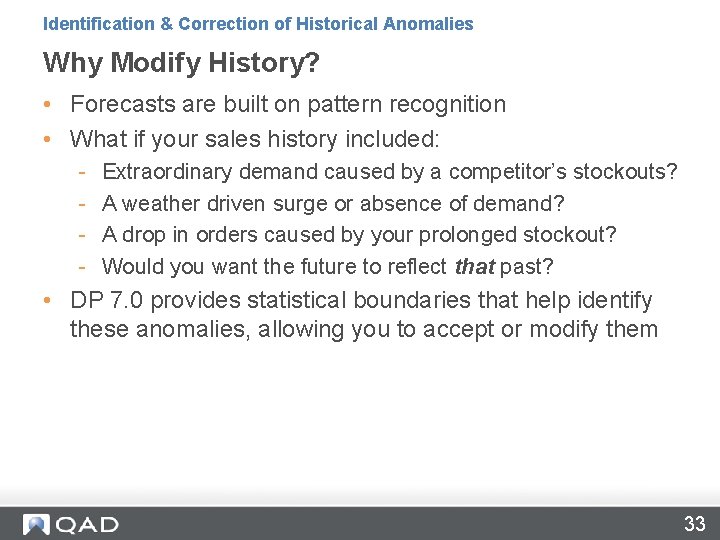
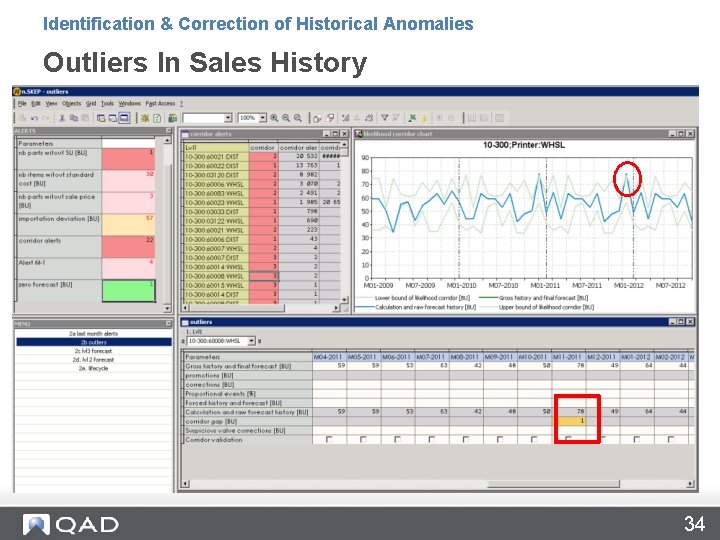
Identification & Correction of Historical Anomalies Why Modify History? • Forecasts are built on pattern recognition • What if your sales history included: - Extraordinary demand caused by a competitor’s stockouts? A weather driven surge or absence of demand? A drop in orders caused by your prolonged stockout? Would you want the future to reflect that past? • DP 7. 0 provides statistical boundaries that help identify these anomalies, allowing you to accept or modify them 33
Identification & Correction of Historical Anomalies Outliers In Sales History 34
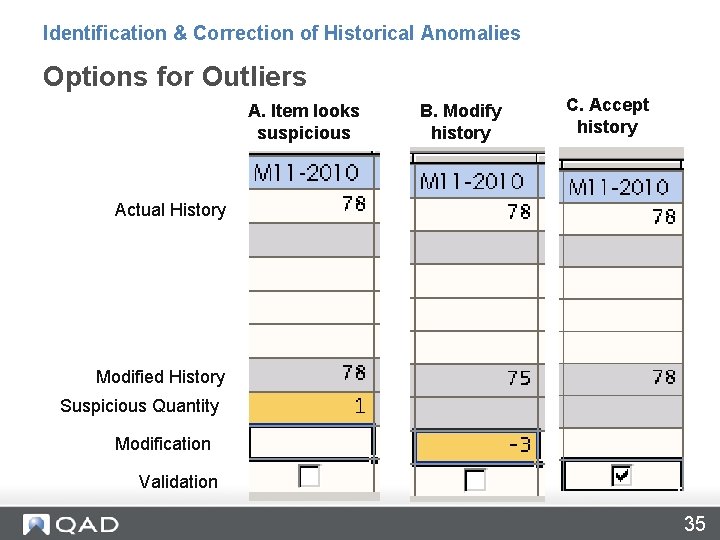
Identification & Correction of Historical Anomalies Options for Outliers A. Item looks suspicious B. Modify history C. Accept history Actual History Modified History Suspicious Quantity Modification Validation 35
Overcoming Limited Resources Superior Forecast Engine 36
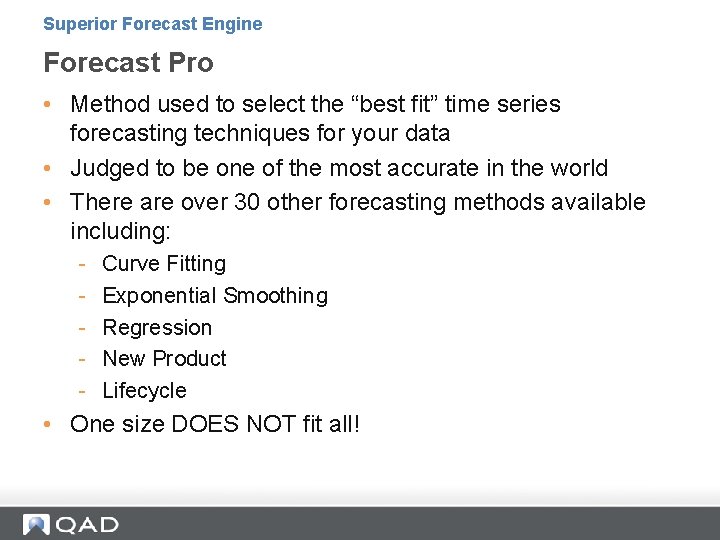
Superior Forecast Engine Forecast Pro • Method used to select the “best fit” time series forecasting techniques for your data • Judged to be one of the most accurate in the world • There are over 30 other forecasting methods available including: - Curve Fitting Exponential Smoothing Regression New Product Lifecycle • One size DOES NOT fit all!
Overcoming Limited Resources ABC Analysis To Separate The Critical From The Trivial 38
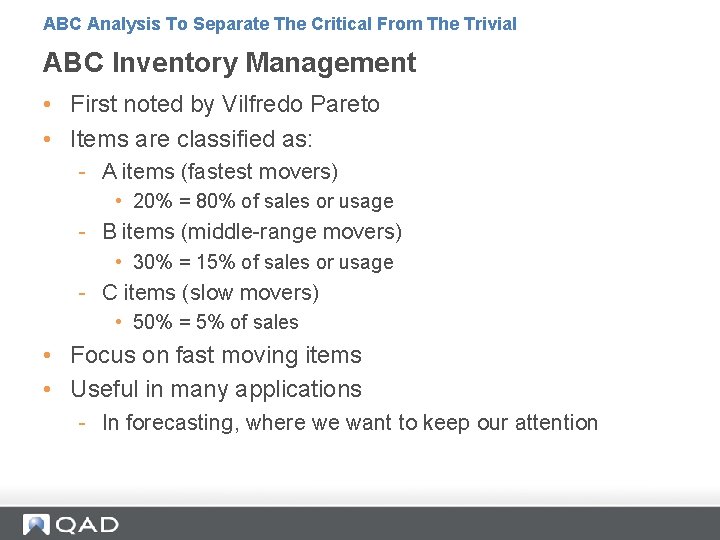
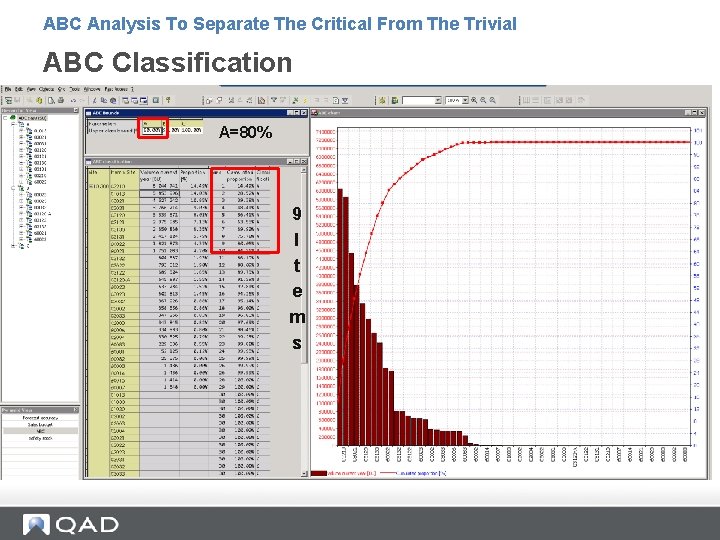
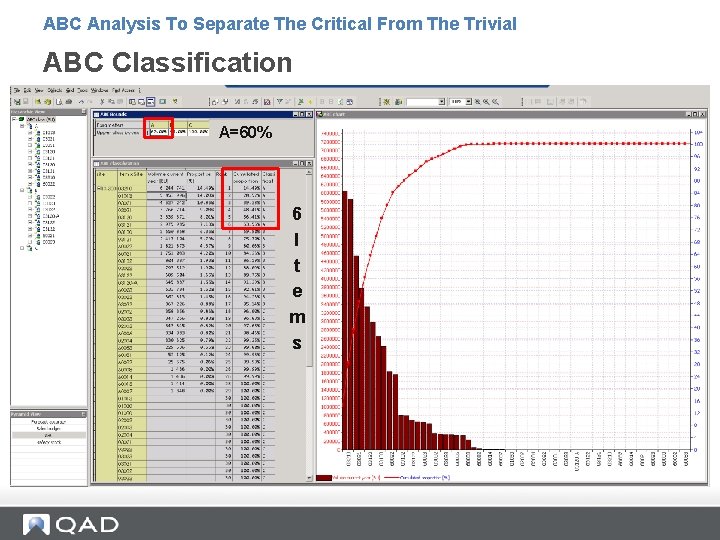
ABC Analysis To Separate The Critical From The Trivial ABC Inventory Management • First noted by Vilfredo Pareto • Items are classified as: - A items (fastest movers) • 20% = 80% of sales or usage - B items (middle-range movers) • 30% = 15% of sales or usage - C items (slow movers) • 50% = 5% of sales • Focus on fast moving items • Useful in many applications - In forecasting, where we want to keep our attention
ABC Analysis To Separate The Critical From The Trivial Tighter Alert Parameters For “A” Items • Deviation Gap set at 10% will generate no alert • Change Deviation Gap to 5% generates an alert 40
ABC Analysis To Separate The Critical From The Trivial ABC Classification A=80% 9 I t e m s
ABC Analysis To Separate The Critical From The Trivial ABC Classification A=60% 6 I t e m s
Overcoming Limited Resources Multi-Level Forecasting 43
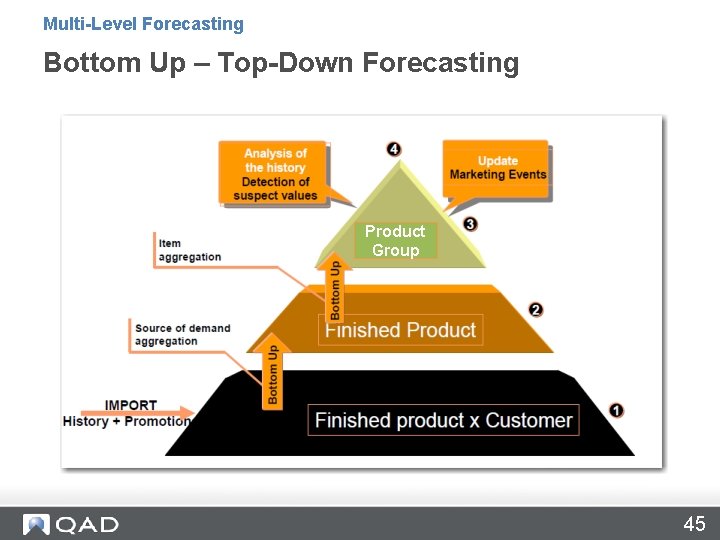
Multi-Level Forecasting Why Not Forecast At The Item Level? • • Number of SKU’s Aggregation improves accuracy Forecasting resources Collaboration 44
Multi-Level Forecasting Bottom Up – Top-Down Forecasting Product Group 45
Senior Management Overheard…. “Sales, Marketing & Demand Planning all think they are better at forecasting promotions. Who is right? ” 46
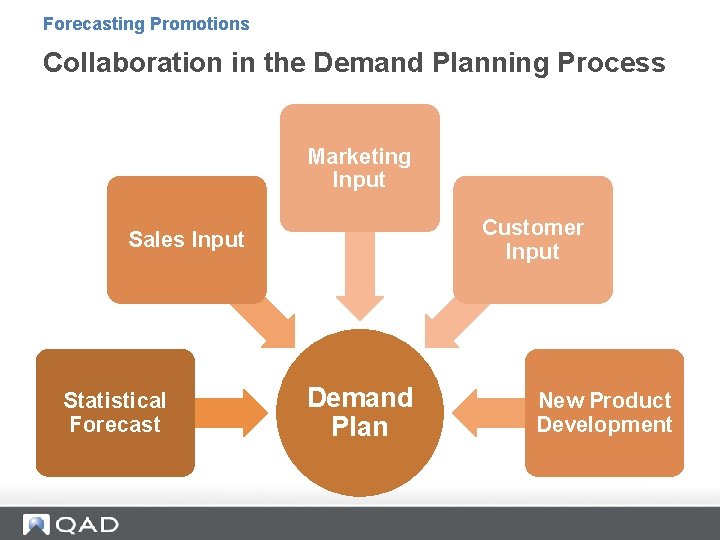
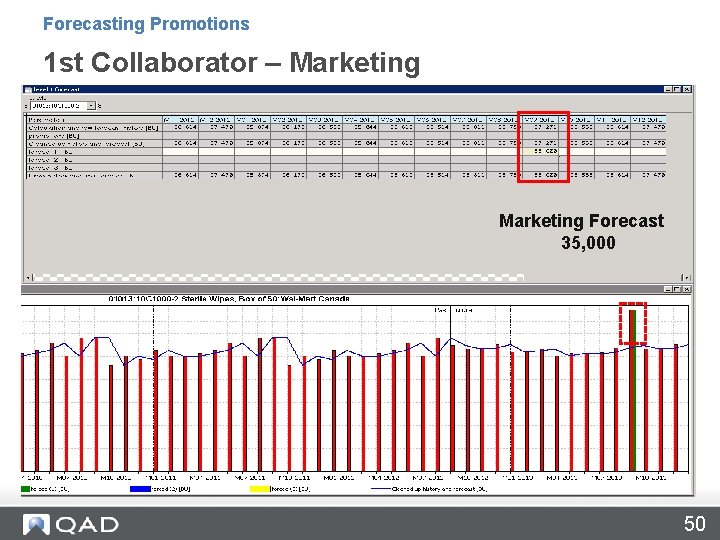
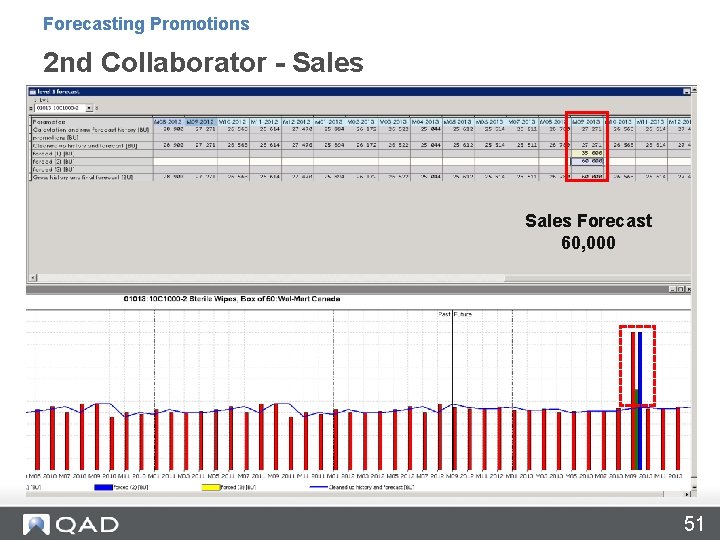
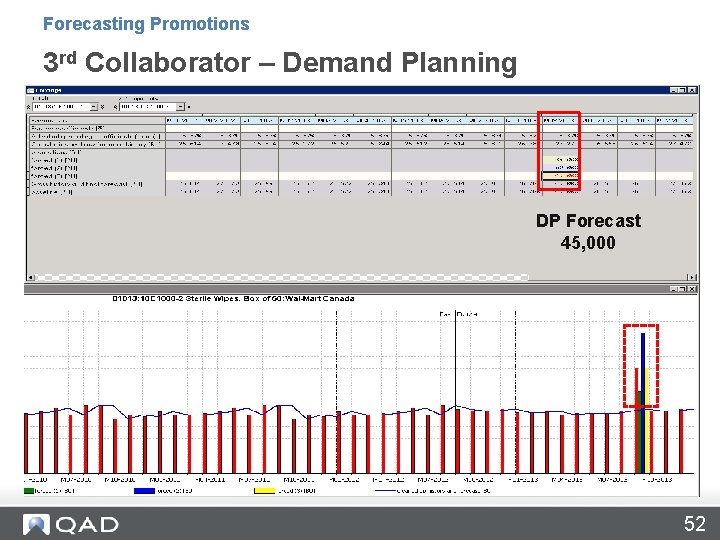
Forecasting Promotions Collaboration in the Demand Planning Process Marketing Input Customer Input Sales Input Statistical Forecast Demand Plan New Product Development
Forecasting Promotions DP 7. 0 Answers • Enable Collaboration • Retain each collaborators input • Measure each collaborators accuracy 48
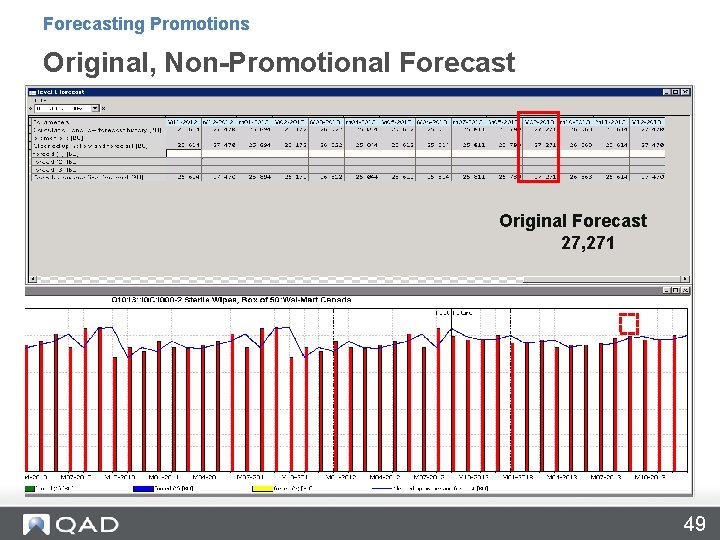
Forecasting Promotions Original, Non-Promotional Forecast Original Forecast 27, 271 49
Forecasting Promotions 1 st Collaborator – Marketing Forecast 35, 000 50
Forecasting Promotions 2 nd Collaborator - Sales Forecast 60, 000 51
Forecasting Promotions 3 rd Collaborator – Demand Planning DP Forecast 45, 000 52
Forecasting Promotions When Forecasting Promotions • Each collaborator inputs their forecast • A predefined hierarchy determines which forecast has precedence in determining the final forecast • All forecasts are stored in the system • After the promotion the system can determine which of the forecasts was the most accurate 53
Senior Management Overheard…. “My Old Company Kept 2 Weeks Of Safety Stock On Hand For Each Item. Isn’t That Enough? ” 54
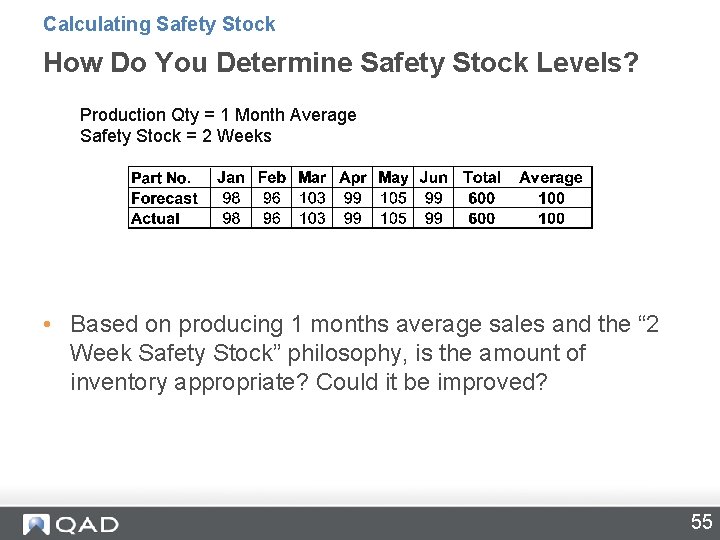
Calculating Safety Stock How Do You Determine Safety Stock Levels? Production Qty = 1 Month Average Safety Stock = 2 Weeks • Based on producing 1 months average sales and the “ 2 Week Safety Stock” philosophy, is the amount of inventory appropriate? Could it be improved? 55
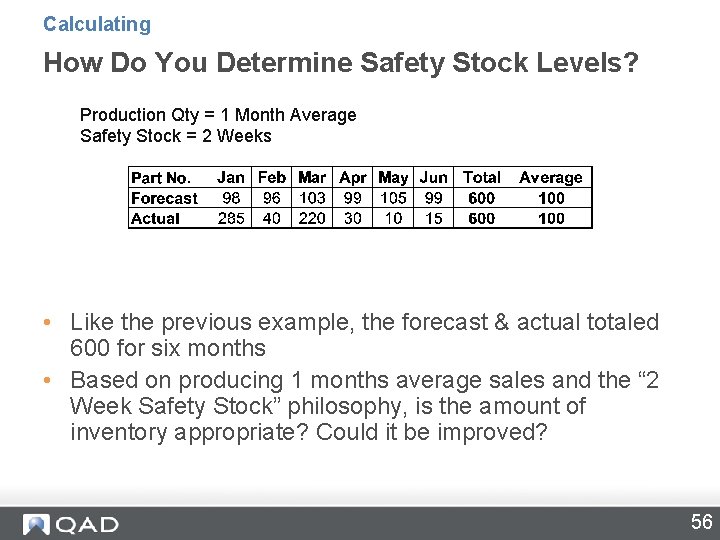
Calculating How Do You Determine Safety Stock Levels? Production Qty = 1 Month Average Safety Stock = 2 Weeks • Like the previous example, the forecast & actual totaled 600 for six months • Based on producing 1 months average sales and the “ 2 Week Safety Stock” philosophy, is the amount of inventory appropriate? Could it be improved? 56
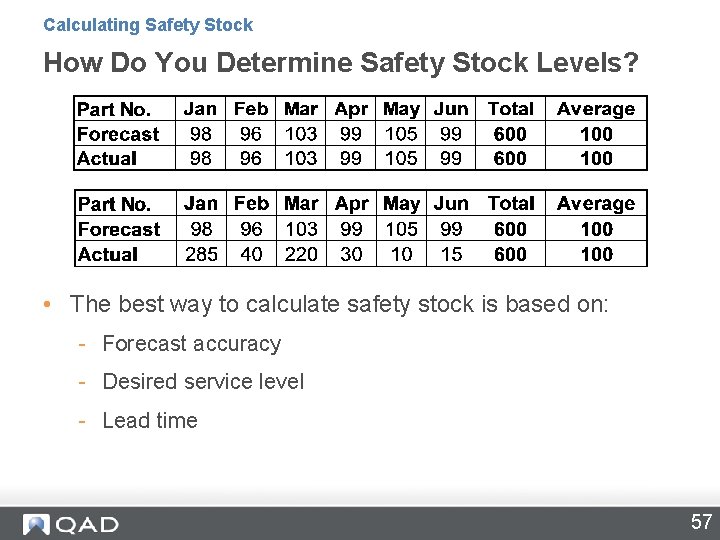
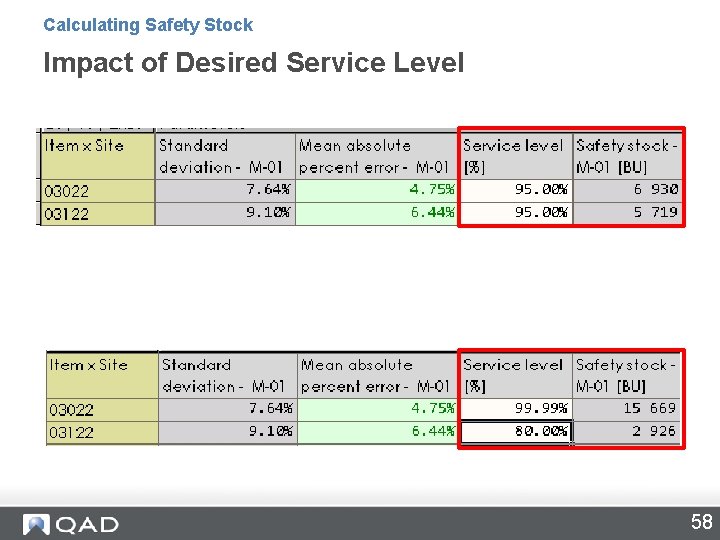
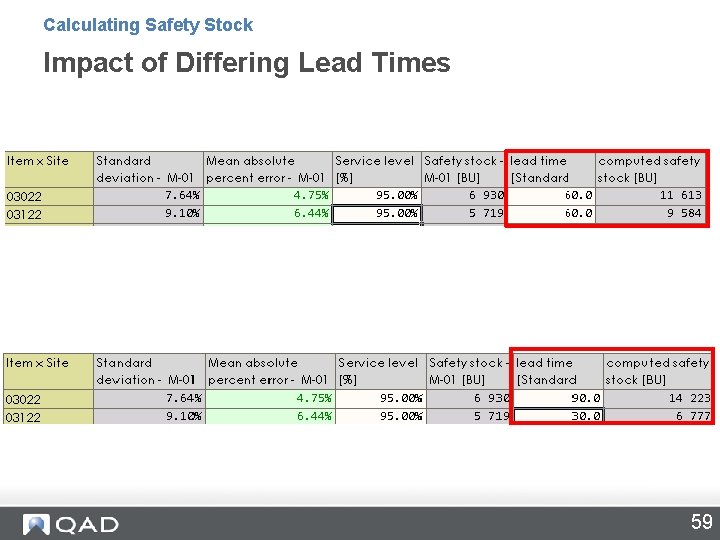
Calculating Safety Stock How Do You Determine Safety Stock Levels? • The best way to calculate safety stock is based on: - Forecast accuracy - Desired service level - Lead time 57
Calculating Safety Stock Impact of Desired Service Level 58
Calculating Safety Stock Impact of Differing Lead Times 59
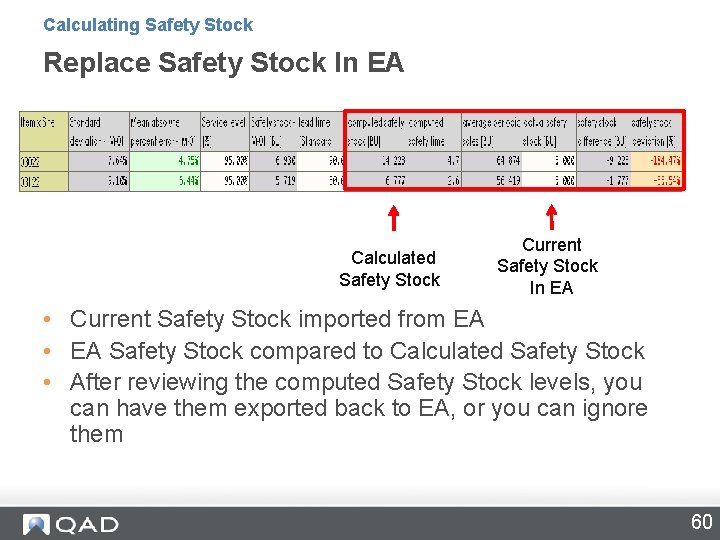
Calculating Safety Stock Replace Safety Stock In EA Calculated Safety Stock Current Safety Stock In EA • Current Safety Stock imported from EA • EA Safety Stock compared to Calculated Safety Stock • After reviewing the computed Safety Stock levels, you can have them exported back to EA, or you can ignore them 60
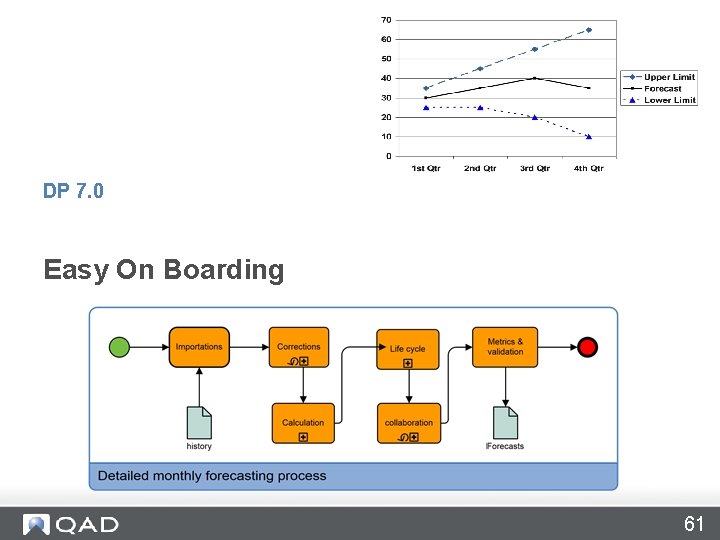
DP 7. 0 Easy On Boarding 61
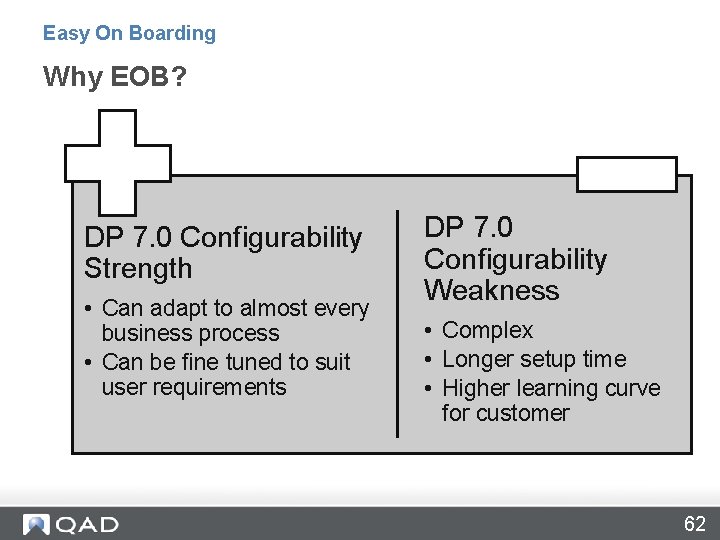
Easy On Boarding Why EOB? DP 7. 0 Configurability Strength • Can adapt to almost every business process • Can be fine tuned to suit user requirements DP 7. 0 Configurability Weakness • Complex • Longer setup time • Higher learning curve for customer 62
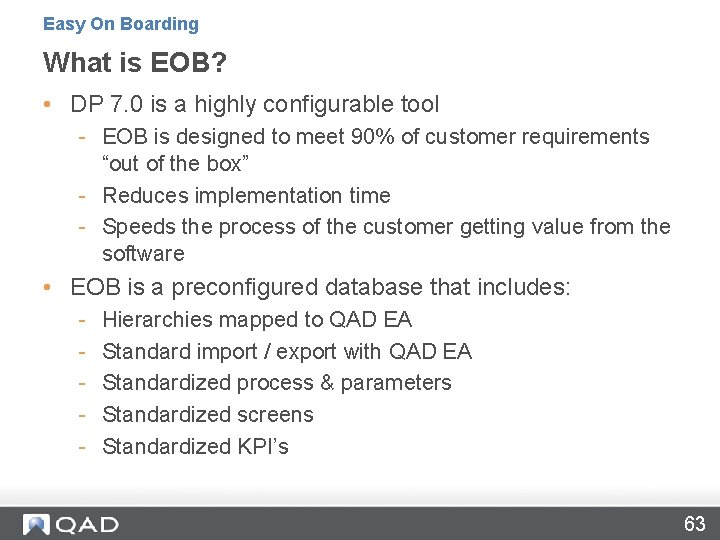
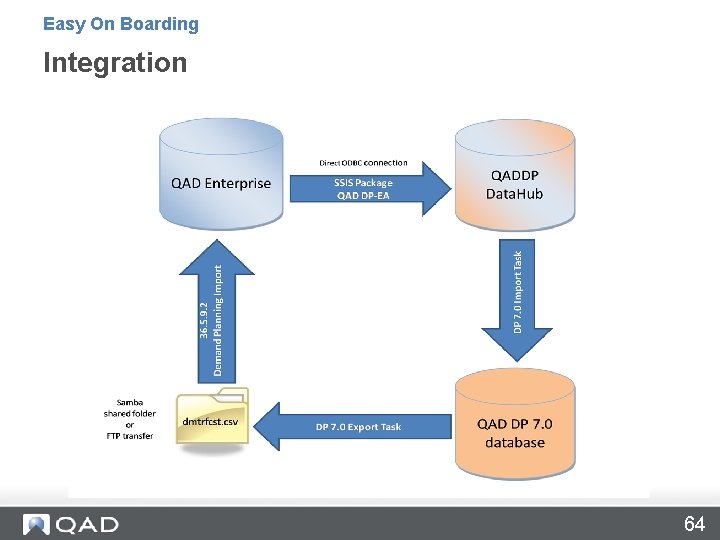
Easy On Boarding What is EOB? • DP 7. 0 is a highly configurable tool - EOB is designed to meet 90% of customer requirements “out of the box” - Reduces implementation time - Speeds the process of the customer getting value from the software • EOB is a preconfigured database that includes: - Hierarchies mapped to QAD EA Standard import / export with QAD EA Standardized process & parameters Standardized screens Standardized KPI’s 63
Easy On Boarding Integration 64
Building the Effective Enterprise Join us in San Antonio, TX May 6 -9, 2013 Early Bird Ends Soon! 65
Demand Planning 7. 0 Contact Mark K. Williams, CFPIM, CSCP m 3 w@qad. com QAD Global Supply Chain Practice www. qad. com © 2013 QAD Inc 66