Product Design 5 Power Point presentation to accompany
- Slides: 53
Product Design 5 Power. Point presentation to accompany Heizer and Render Operations Management, Global Edition, Eleventh Edition Principles of Operations Management, Global Edition, Ninth Edition Power. Point slides by Jeff Heyl © 2014 Pearson Education 5 -1
OUTLINE ▶ Goods and Services Selection ▶ New Product Development ▶ QFD ▶ Organizing for Product Development ▶ ▶ ▶ Key Isues for Product Design Documents for Product Definition Documents for Production Service Design Application of Decision Trees to Product Design © 2014 Pearson Education 5 -2
Goods and Services Selection ► ► Organizations exist to provide goods or services to society Goods and services selection are critical to achieving competitive advantage Great products are the key to success Top organizations typically focus on core products © 2014 Pearson Education 5 -3
Some Well Known Companies Having Competitive Advantage Through Their Products üHonda: engine technology üMicrosoft: PC software üIntel: Microprocessors üMichelin: Tires üDell Computer: Customized hardware and software and Dell does this very fast. © 2014 Pearson Education 5 -4
Product Decision The objective of the product decision is to develop and implement a product strategy that meets the demands of the marketplace with a competitive advantage © 2014 Pearson Education 5 -5
Product Strategy Options ► Differentiation u Shouldice Hospital in Canada specializing in hernia operation ► Low cost ► ► Taco Bell, Wallmart Rapid response u Toyota (product development under 2 years. Industry standard is over 2 years) © 2014 Pearson Education 5 -6
Product Life Cycles ► ► May be any length from a few days to decades The operations function must be able to introduce new products successfully © 2014 Pearson Education 5 -7
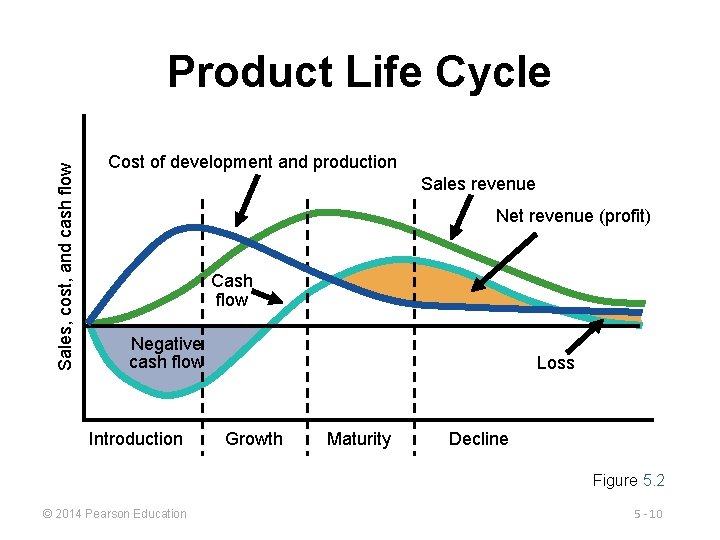
Product Life Cycles þ May be any length from a few hours (a newspaper), months (cell phones), years (furnitures), to decades (Wolgswagen Beetle) þ A product’s life is divided into four phases: 1. Introduction, 2. Growth, 3. Maturity, 4. Decline þ The operations function must be able to introduce new products successfully © 2014 Pearson Education 5 -8
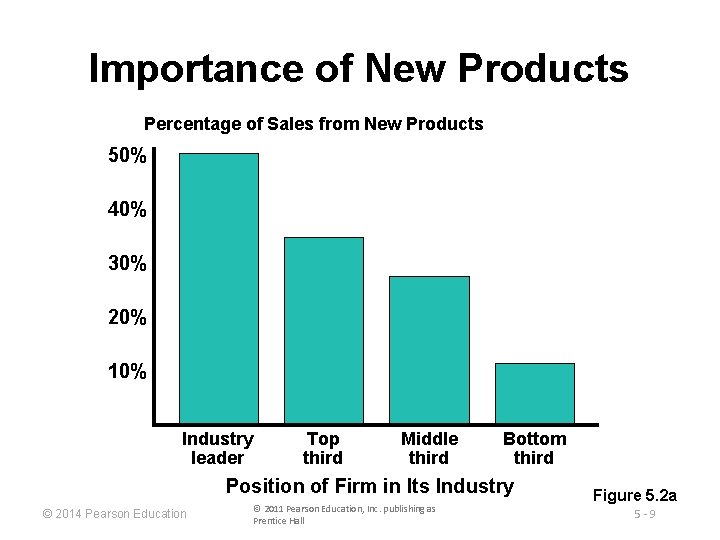
Importance of New Products Percentage of Sales from New Products 50% 40% 30% 20% 10% Industry leader Top third Middle third Bottom third Position of Firm in Its Industry © 2014 Pearson Education © 2011 Pearson Education, Inc. publishing as Prentice Hall Figure 5. 2 a 5 -9
Sales, cost, and cash flow Product Life Cycle Cost of development and production Sales revenue Net revenue (profit) Cash flow Negative cash flow Introduction Loss Growth Maturity Decline Figure 5. 2 © 2014 Pearson Education 5 - 10
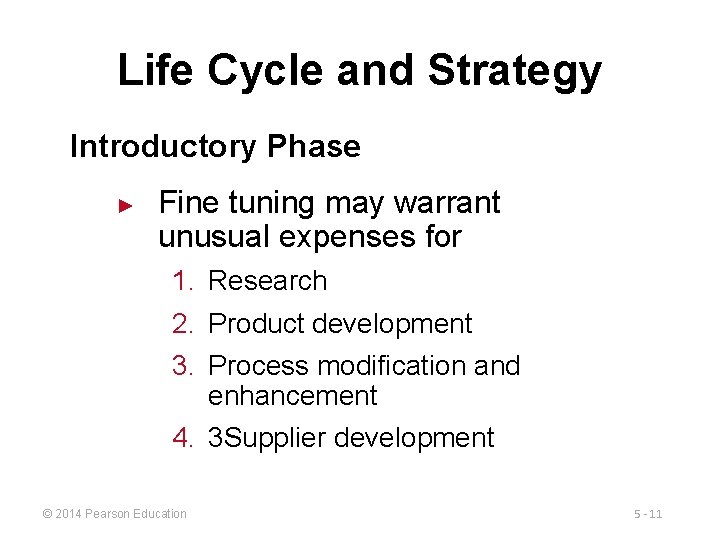
Life Cycle and Strategy Introductory Phase ► Fine tuning may warrant unusual expenses for 1. Research 2. Product development 3. Process modification and enhancement 4. 3 Supplier development © 2014 Pearson Education 5 - 11
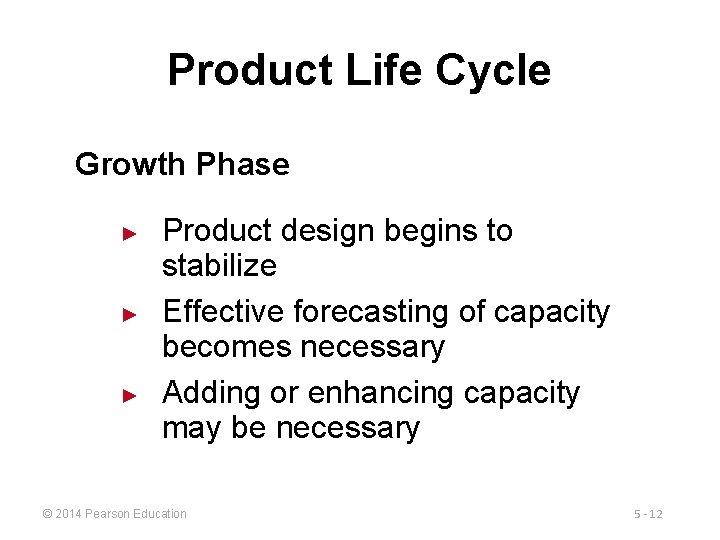
Product Life Cycle Growth Phase ► ► ► Product design begins to stabilize Effective forecasting of capacity becomes necessary Adding or enhancing capacity may be necessary © 2014 Pearson Education 5 - 12
Product Life Cycle Maturity Phase ► ► ► Competitors now established High volume, innovative production may be needed Improved cost control, reduction in options, paring down of product line © 2014 Pearson Education 5 - 13
Product Life Cycle Decline Phase ► Unless product makes a special contribution to the organization, must plan to terminate offering © 2014 Pearson Education 5 - 14
Product-by-Value Analysis u Lists products in descending order (from largest to smallest) of their individual dollar contribution to the firm u Lists the total annual dollar contribution of the product u Helps management to evaluate alternative strategies so that limited existing resourses are to be invested in few critical and not in many trivial. © 2014 Pearson Education © 2011 Pearson Education, Inc. publishing as Prentice Hall 5 - 15
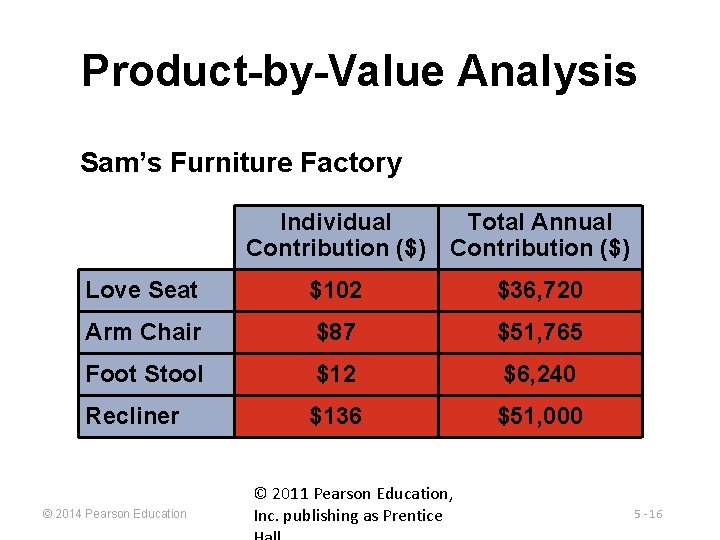
Product-by-Value Analysis Sam’s Furniture Factory Individual Contribution ($) Total Annual Contribution ($) Love Seat $102 $36, 720 Arm Chair $87 $51, 765 Foot Stool $12 $6, 240 Recliner $136 $51, 000 © 2014 Pearson Education © 2011 Pearson Education, Inc. publishing as Prentice 5 - 16
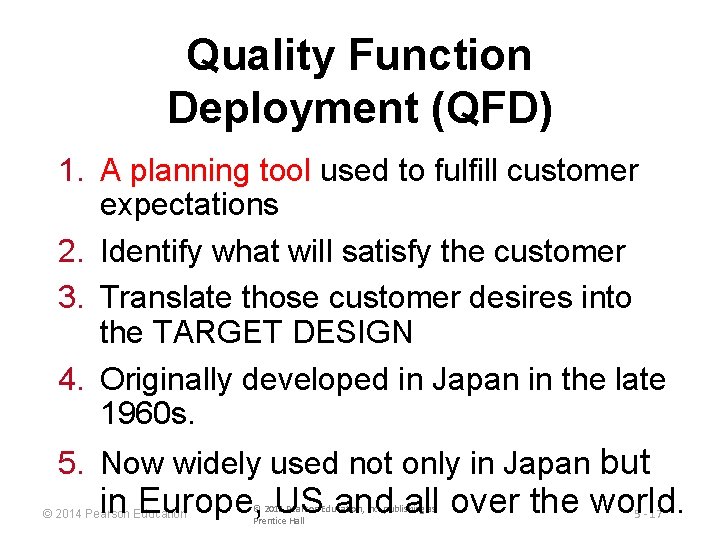
Quality Function Deployment (QFD) 1. A planning tool used to fulfill customer expectations 2. Identify what will satisfy the customer 3. Translate those customer desires into the TARGET DESIGN 4. Originally developed in Japan in the late 1960 s. 5. Now widely used not only in Japan but in Europe, US and all over the world. © 2014 Pearson Education © 2011 Pearson Education, Inc. publishing as Prentice Hall 5 - 17
House of Quality Example Your team has been charged with designing a new camera for Great Cameras, Inc. The first action is to construct a House of Quality © 2014 Pearson Education © 2011 Pearson Education, Inc. publishing as Prentice Hall 5 - 18
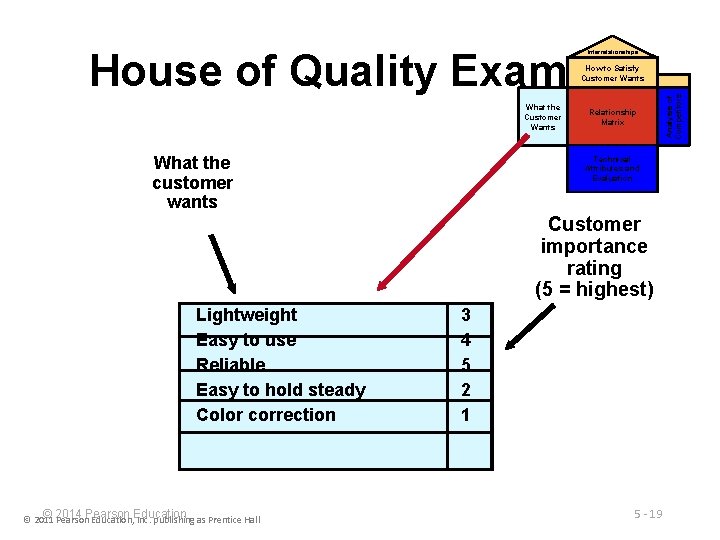
House of Quality Example Interrelationships What the Customer Wants What the customer wants Relationship Matrix Technical Attributes and Evaluation Customer importance rating (5 = highest) Lightweight Easy to use Reliable Easy to hold steady Color correction © 2014 Pearson Education © 2011 Pearson Education, Inc. publishing as Prentice Hall 3 4 5 2 1 5 - 19 Analysis of Competitors How to Satisfy Customer Wants
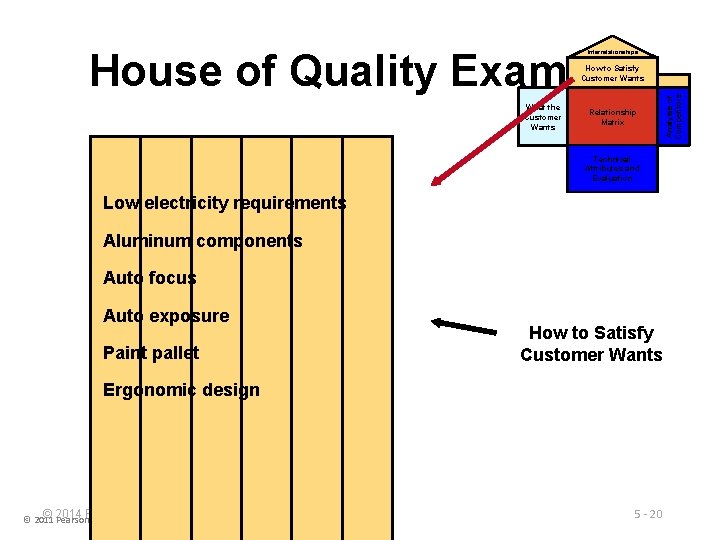
House of Quality Example Interrelationships What the Customer Wants Relationship Matrix Technical Attributes and Evaluation Low electricity requirements Aluminum components Auto focus Auto exposure Paint pallet How to Satisfy Customer Wants Ergonomic design © 2014 Pearson Education © 2011 Pearson Education, Inc. publishing as Prentice Hall 5 - 20 Analysis of Competitors How to Satisfy Customer Wants
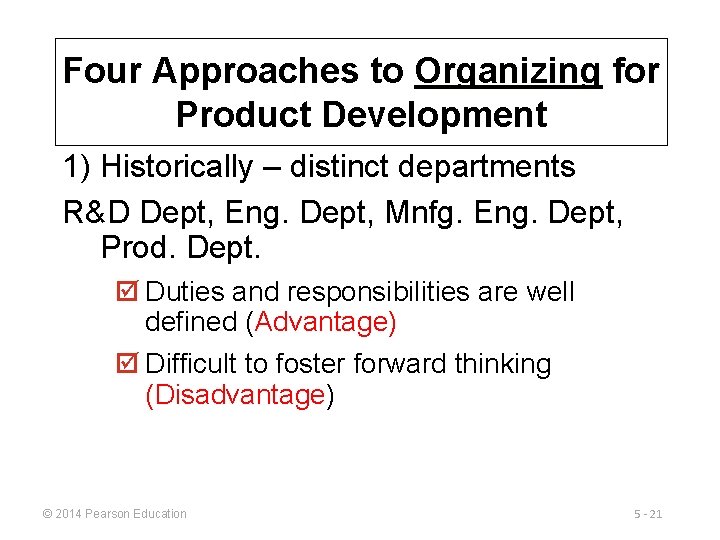
Four Approaches to Organizing for Product Development 1) Historically – distinct departments R&D Dept, Eng. Dept, Mnfg. Eng. Dept, Prod. Dept. þ Duties and responsibilities are well defined (Advantage) þ Difficult to foster forward thinking (Disadvantage) © 2014 Pearson Education 5 - 21
Organizing for Product Development 2) A Champion þTo assign a product manager to champion the product through the product development system and related organizations © 2014 Pearson Education 5 - 22
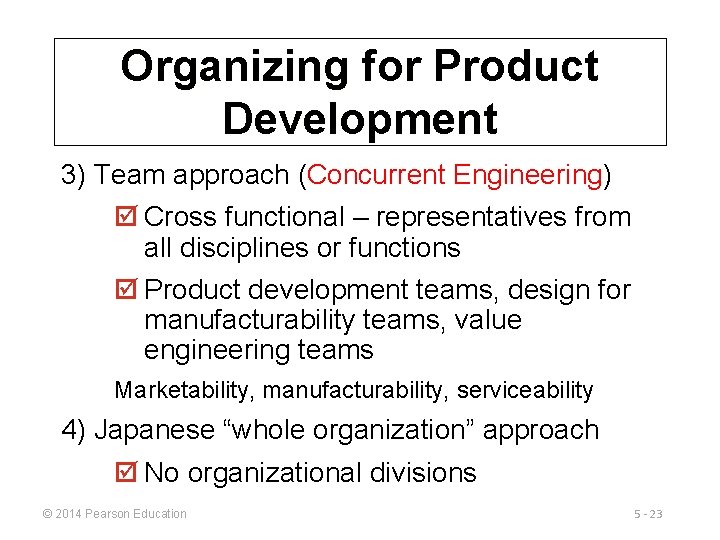
Organizing for Product Development 3) Team approach (Concurrent Engineering) þ Cross functional – representatives from all disciplines or functions þ Product development teams, design for manufacturability teams, value engineering teams Marketability, manufacturability, serviceability 4) Japanese “whole organization” approach þ No organizational divisions © 2014 Pearson Education 5 - 23
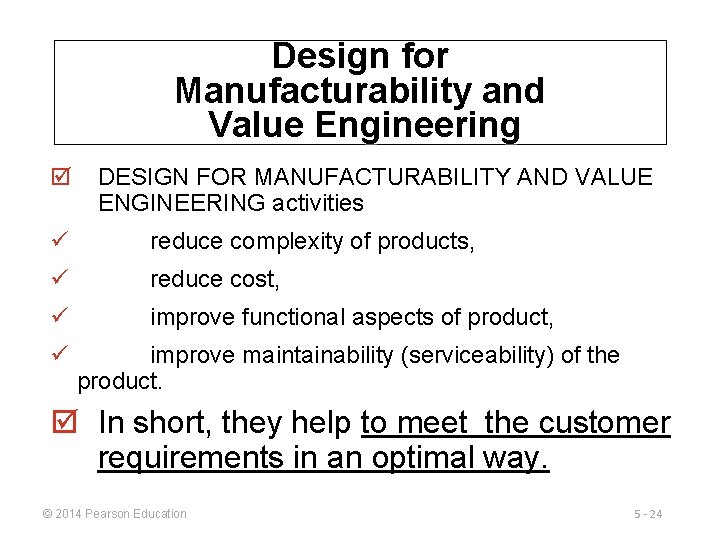
Design for Manufacturability and Value Engineering þ DESIGN FOR MANUFACTURABILITY AND VALUE ENGINEERING activities ü reduce complexity of products, ü reduce cost, ü improve functional aspects of product, ü improve maintainability (serviceability) of the product. þ In short, they help to meet the customer requirements in an optimal way. © 2014 Pearson Education 5 - 24
Design for Manufacturability and Value Engineering and Concurrent Engineering: Team approach to design products Cross functional – representatives from all disciplines or functions þ Product development teams, design for manufacturability teams, value engineering teams Marketability, manufacturability, serviceability © 2014 Pearson Education 5 - 25
Issues for Product Design Robust design ► Modular design ► Computer-aided design (CAD) ► Computer-aided manufacturing (CAM) ► Virtual reality technology ► Value analysis ► Environmentally friendly design ► © 2014 Pearson Education 5 - 26
Robust Design ► ► Product is designed so that small variations in production or assembly do not adversely affect the product Typically results in lower cost and higher quality © 2014 Pearson Education 5 - 27
Modular Design Products designed in easily segmented components ► Adds flexibility to both production and marketing ► Improved ability to satisfy customer requirements ► © 2014 Pearson Education 5 - 28
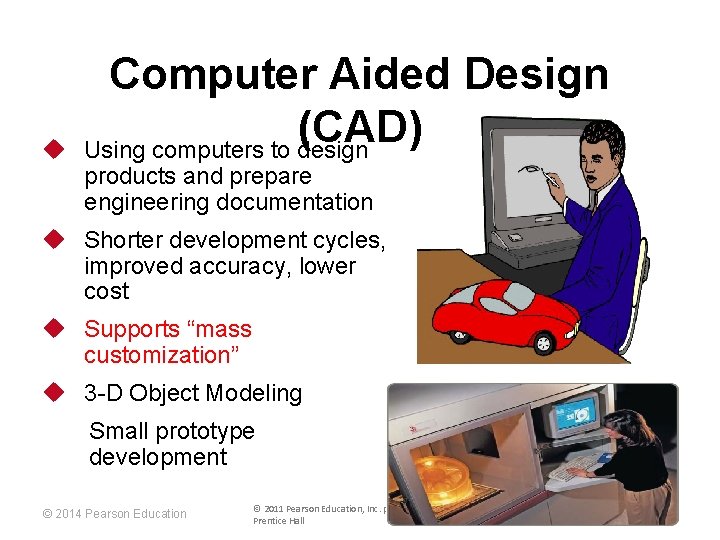
u Computer Aided Design (CAD) Using computers to design products and prepare engineering documentation u Shorter development cycles, improved accuracy, lower cost u Supports “mass customization” u 3 -D Object Modeling Small prototype development © 2014 Pearson Education © 2011 Pearson Education, Inc. publishing as Prentice Hall 5 - 29
Computer-Aided Manufacturing (CAM) u Utilizing specialized computers and program to control manufacturing equipment u Often driven by the CAD system (CAD/CAM) u CNC Machines © 2014 Pearson Education © 2011 Pearson Education, Inc. publishing as Prentice Hall 5 - 30
Virtual Reality Technology ► ► ► Computer technology used to develop an interactive, 3 -D model of a product from the basic CAD data Allows people to ‘see’ the finished design before a physical model is built Very effective in large-scale designs such as plant layout © 2014 Pearson Education 5 - 31
Value Analysis ► ► ► Focuses on design improvement during production Seeks improvements leading either to a better product or a product which can be produced more economically with less environmental impact Note that while Value Engineering focuses on preproduction design improvement, Value Analysis takes place during the production process. © 2014 Pearson Education 5 - 32
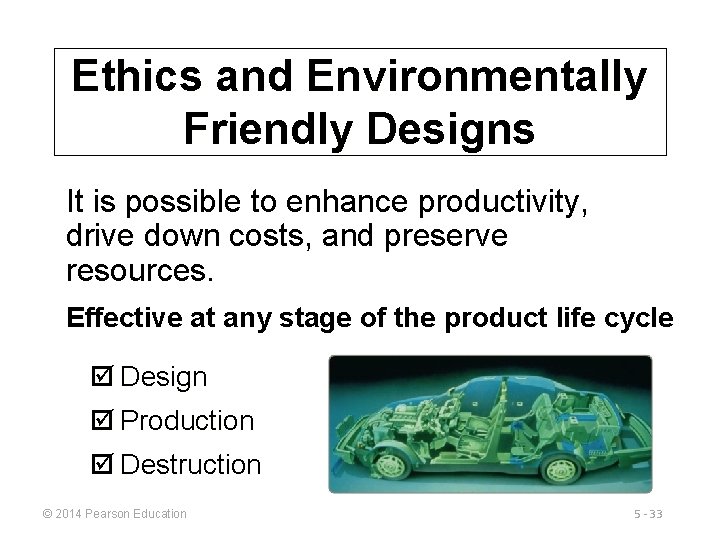
Ethics and Environmentally Friendly Designs It is possible to enhance productivity, drive down costs, and preserve resources. Effective at any stage of the product life cycle þ Design þ Production þ Destruction © 2014 Pearson Education 5 - 33
Guidelines for Environmentally Friendly Designs 1. Make products recyclable 2. Use recycled materials 3. Use less harmful ingredients (Using soy-based inks) 4. Use lighter components Mercedes is using banana plant fiber for car exteriors Biodegradable and lightweight 5. Use less energy 6. Use less material © 2014 Pearson Education 5 - 34
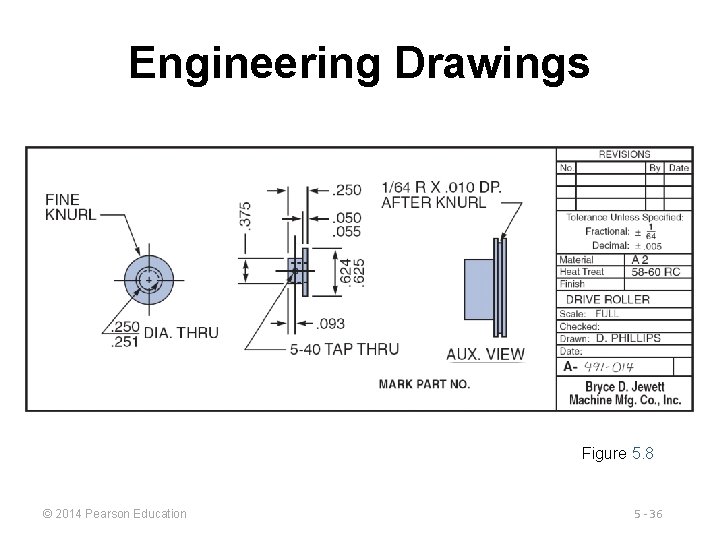
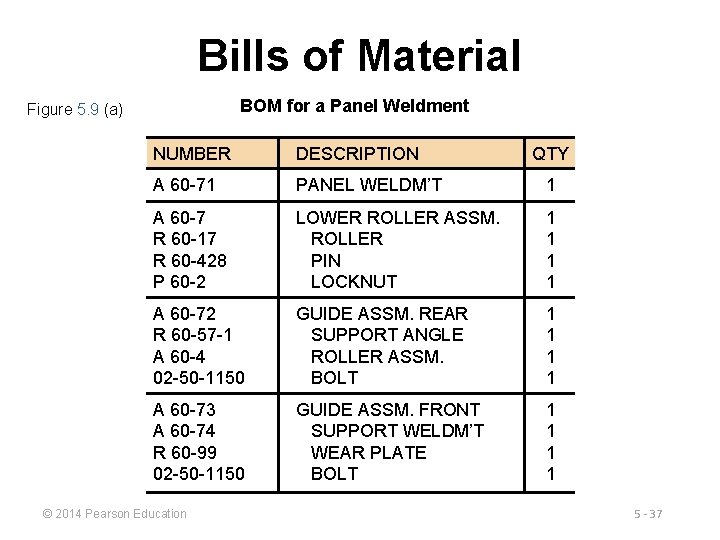
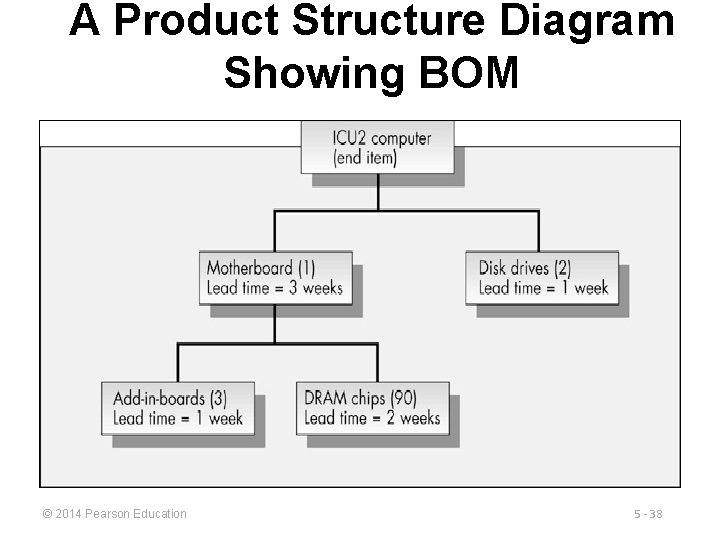
Product Definition Documents ► Engineering drawing ► ► ► Shows dimensions, tolerances, and materials Shows codes for Group Technology Bill of Material ► ► Lists components, quantities and where used Shows product structure © 2014 Pearson Education 5 - 35
Engineering Drawings Figure 5. 8 © 2014 Pearson Education 5 - 36
Bills of Material BOM for a Panel Weldment Figure 5. 9 (a) NUMBER DESCRIPTION A 60 -71 PANEL WELDM’T 1 A 60 -7 R 60 -17 R 60 -428 P 60 -2 LOWER ROLLER ASSM. ROLLER PIN LOCKNUT 1 1 A 60 -72 R 60 -57 -1 A 60 -4 02 -50 -1150 GUIDE ASSM. REAR SUPPORT ANGLE ROLLER ASSM. BOLT 1 1 A 60 -73 A 60 -74 R 60 -99 02 -50 -1150 GUIDE ASSM. FRONT SUPPORT WELDM’T WEAR PLATE BOLT 1 1 © 2014 Pearson Education QTY 5 - 37
A Product Structure Diagram Showing BOM © 2014 Pearson Education 5 - 38
Documents for Production ► ► ► Assembly drawing Assembly chart Route sheet Work order Engineering change notices (ECNs) © 2014 Pearson Education 5 - 39
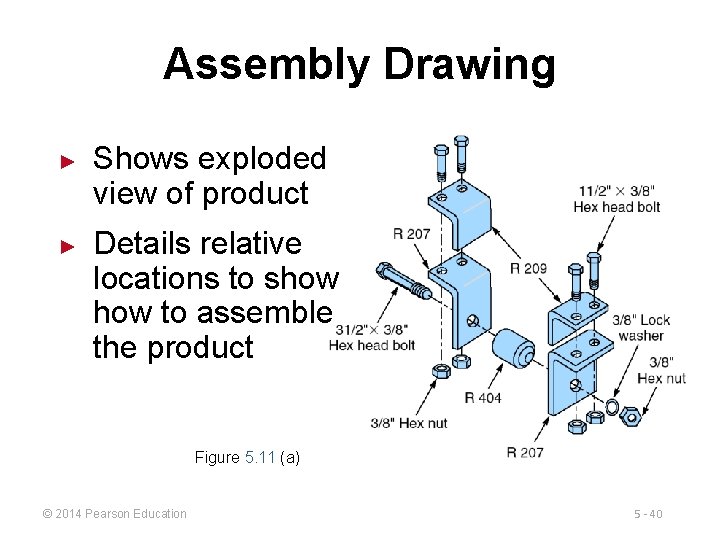
Assembly Drawing ► ► Shows exploded view of product Details relative locations to show to assemble the product Figure 5. 11 (a) © 2014 Pearson Education 5 - 40
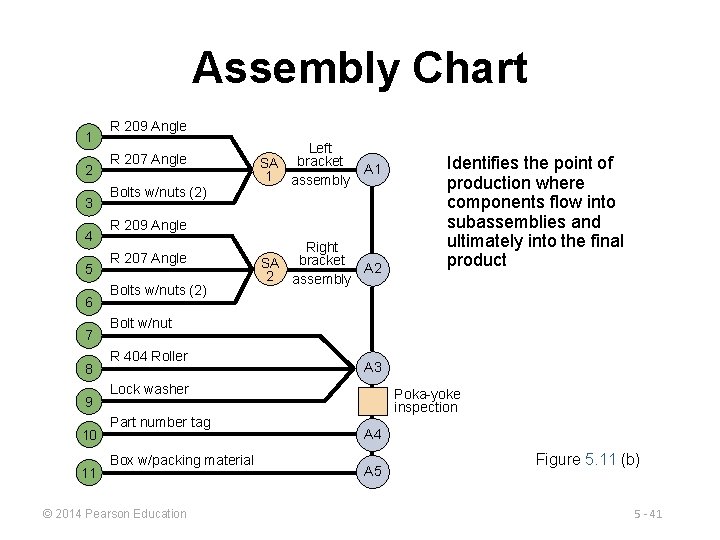
Assembly Chart 1 2 3 4 5 6 7 8 9 10 11 R 209 Angle R 207 Angle Bolts w/nuts (2) Left bracket SA 1 assembly A 1 R 209 Angle R 207 Angle Bolts w/nuts (2) Right SA bracket A 2 2 assembly Identifies the point of production where components flow into subassemblies and ultimately into the final product Bolt w/nut R 404 Roller A 3 Lock washer Part number tag Box w/packing material © 2014 Pearson Education Poka-yoke inspection A 4 A 5 Figure 5. 11 (b) 5 - 41
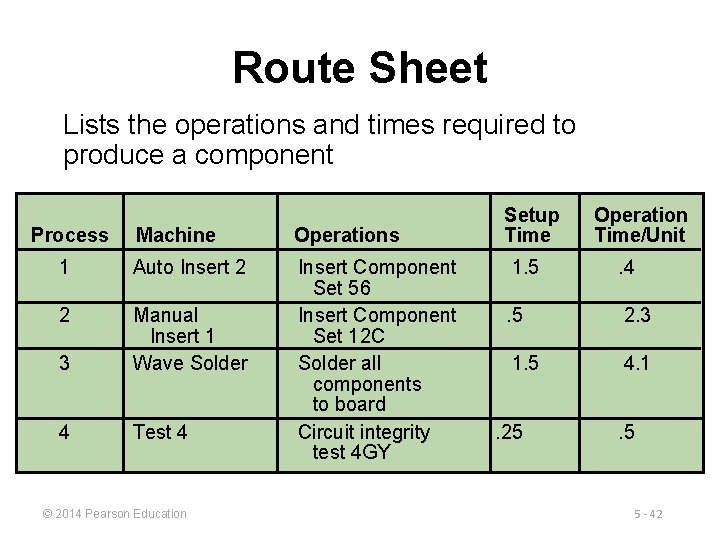
Route Sheet Lists the operations and times required to produce a component Process Machine Operations 1 Auto Insert 2 2 3 Manual Insert 1 Wave Solder 4 Test 4 Insert Component Set 56 Insert Component Set 12 C Solder all components to board Circuit integrity test 4 GY © 2014 Pearson Education Setup Time Operation Time/Unit 1. 5 . 4 . 5 2. 3 1. 5 4. 1 . 25 . 5 5 - 42
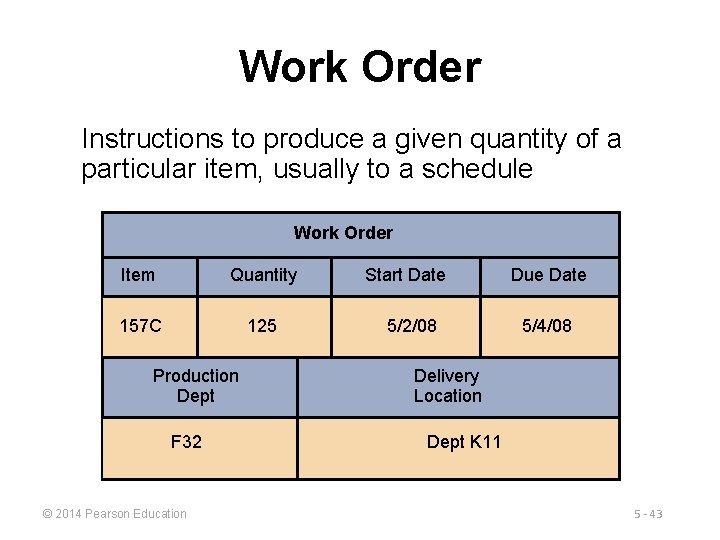
Work Order Instructions to produce a given quantity of a particular item, usually to a schedule Work Order Item Quantity 157 C 125 Production Dept F 32 © 2014 Pearson Education Start Date 5/2/08 Due Date 5/4/08 Delivery Location Dept K 11 5 - 43
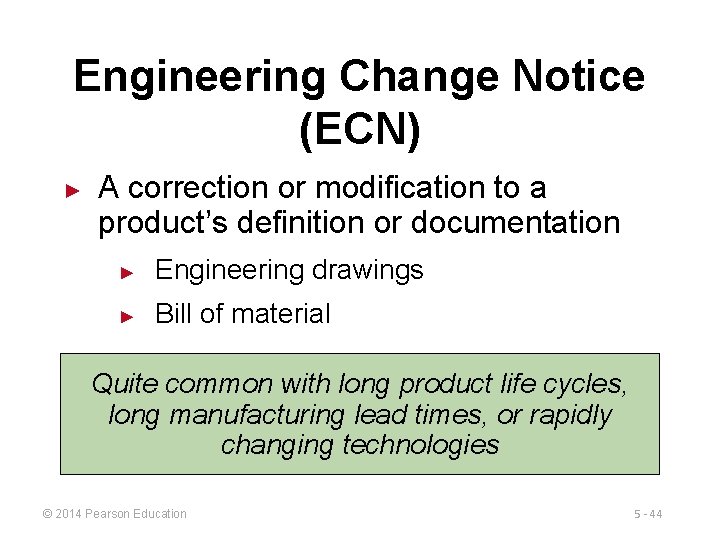
Engineering Change Notice (ECN) ► A correction or modification to a product’s definition or documentation ► Engineering drawings ► Bill of material Quite common with long product life cycles, long manufacturing lead times, or rapidly changing technologies © 2014 Pearson Education 5 - 44
Service Design u Service typically includes direct interaction with the customer u Increased opportunity for customization u Reduced productivity ▶ Service productivity is low partially because of customer involvement in the design or delivery of the service, or both © 2014 Pearson Education 5 - 45
Strategies to Improve Service Efficiency ▶ Limit the options ▶ Improves efficiency and ability to meet customer expectations (a menu in a restaurant or a series of photographs in the case of hairstyle) ▶ Delay customization ▶ (Which dressing would you prefer with your salad? ) ▶ Modularization ▶ Eases customization of a service (Burger King) 5 - 46 © 2014 Pearson Education
Strategies to Improve Service Efficiency ▶ Automation ▶ Reduces cost, increases customer service (ATM’s) ▶ Moment of truth ▶ Critical moments between the customer and the organization that determine customer satisfaction (call center) © 2014 Pearson Education 5 - 47
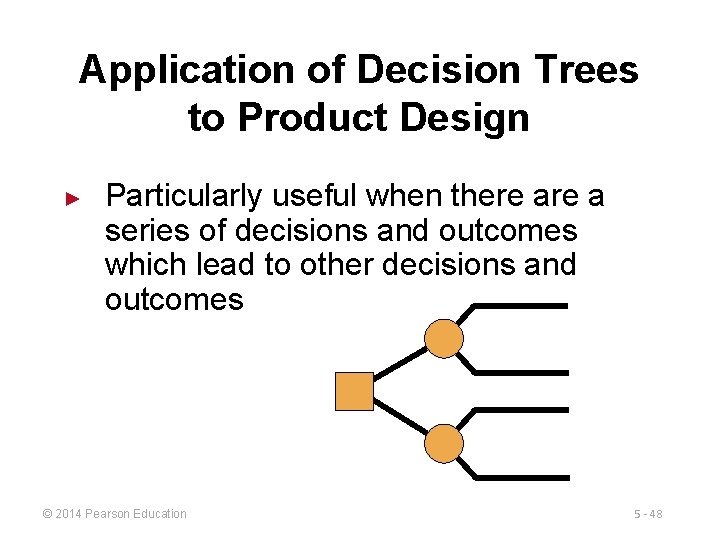
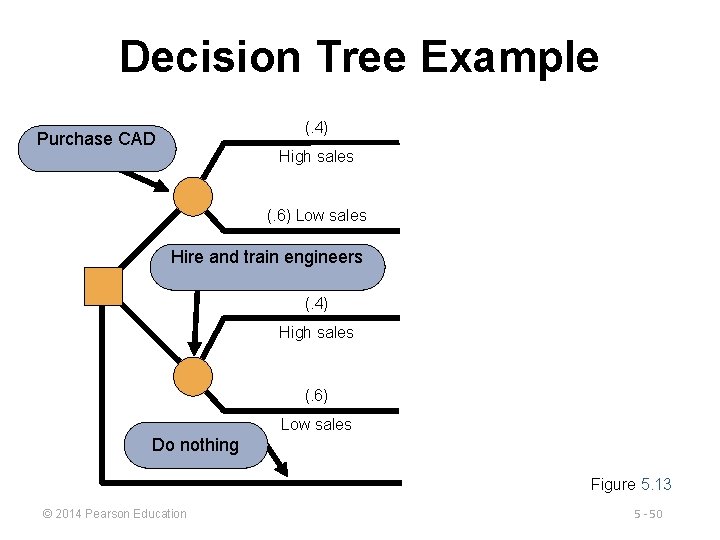
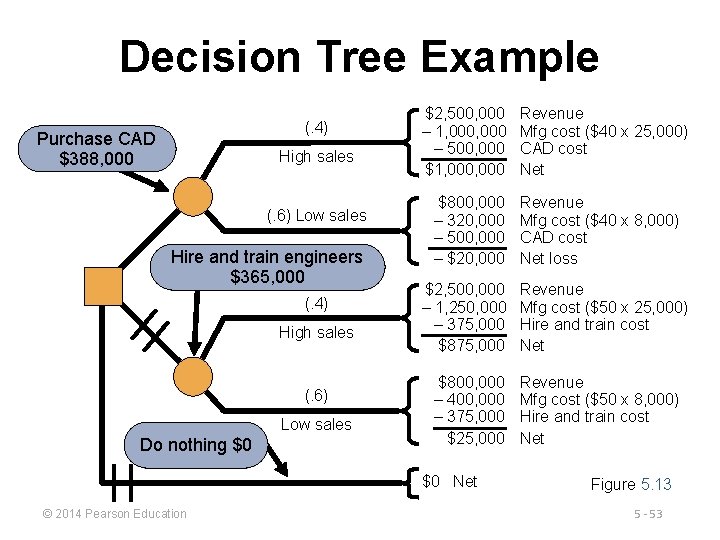
Application of Decision Trees to Product Design ► Particularly useful when there a series of decisions and outcomes which lead to other decisions and outcomes © 2014 Pearson Education 5 - 48
Application of Decision Trees to Product Design Procedure 1. Include all possible alternatives and states of nature - including “doing nothing” 2. Enter payoffs at end of branch 3. Determine the expected value of each branch and “prune” the tree to find the alternative with the best expected value © 2014 Pearson Education 5 - 49
Decision Tree Example (. 4) Purchase CAD High sales (. 6) Low sales Hire and train engineers (. 4) High sales (. 6) Low sales Do nothing Figure 5. 13 © 2014 Pearson Education 5 - 50
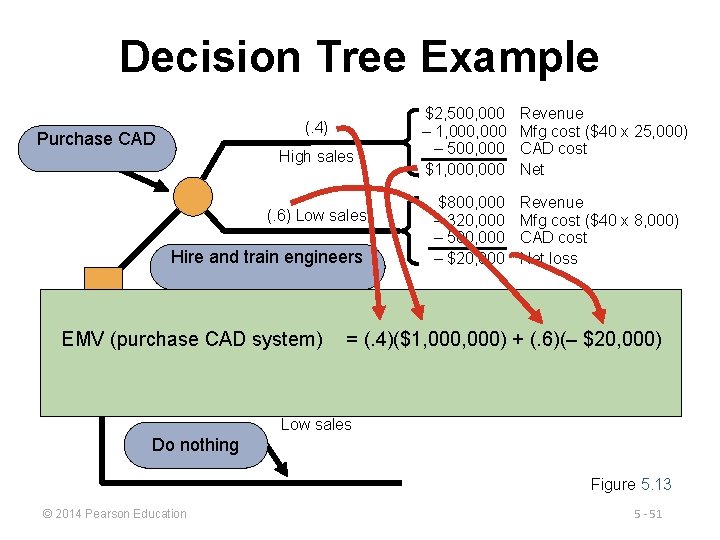
Decision Tree Example (. 4) Purchase CAD High sales (. 6) Low sales Hire and train engineers $2, 500, 000 – 1, 000 – 500, 000 $1, 000 $800, 000 – 320, 000 – 500, 000 – $20, 000 Revenue Mfg cost ($40 x 25, 000) CAD cost Net Revenue Mfg cost ($40 x 8, 000) CAD cost Net loss (. 4) High sales EMV (purchase CAD system) = (. 4)($1, 000) + (. 6)(– $20, 000) (. 6) Low sales Do nothing Figure 5. 13 © 2014 Pearson Education 5 - 51
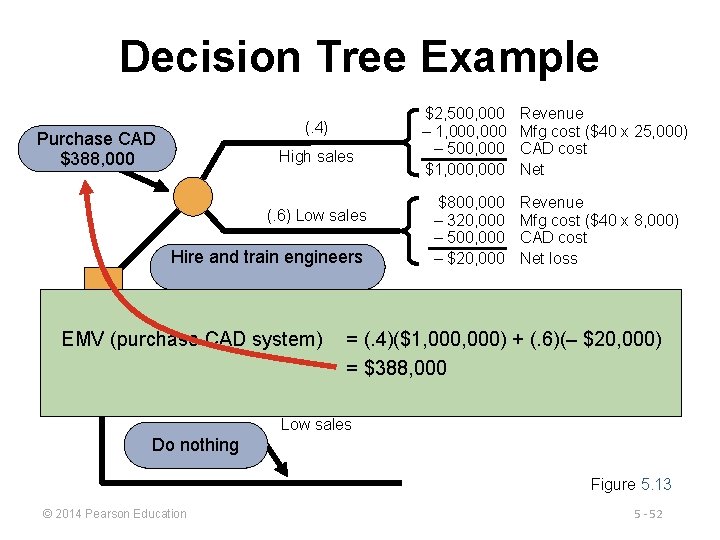
Decision Tree Example (. 4) Purchase CAD $388, 000 High sales (. 6) Low sales Hire and train engineers $2, 500, 000 – 1, 000 – 500, 000 $1, 000 $800, 000 – 320, 000 – 500, 000 – $20, 000 Revenue Mfg cost ($40 x 25, 000) CAD cost Net Revenue Mfg cost ($40 x 8, 000) CAD cost Net loss (. 4) High sales EMV (purchase CAD system) = (. 4)($1, 000) + (. 6)(– $20, 000) = $388, 000 (. 6) Low sales Do nothing Figure 5. 13 © 2014 Pearson Education 5 - 52
Decision Tree Example (. 4) Purchase CAD $388, 000 High sales (. 6) Low sales Hire and train engineers $365, 000 (. 4) High sales (. 6) Low sales Do nothing $0 $2, 500, 000 – 1, 000 – 500, 000 $1, 000 $800, 000 – 320, 000 – 500, 000 – $20, 000 $2, 500, 000 – 1, 250, 000 – 375, 000 $800, 000 – 400, 000 – 375, 000 $25, 000 $0 Net © 2014 Pearson Education Revenue Mfg cost ($40 x 25, 000) CAD cost Net Revenue Mfg cost ($40 x 8, 000) CAD cost Net loss Revenue Mfg cost ($50 x 25, 000) Hire and train cost Net Revenue Mfg cost ($50 x 8, 000) Hire and train cost Net Figure 5. 13 5 - 53