Nelson City Overview of Demographic Trends Dr Natalie


- Slides: 42

Nelson City – Overview of Demographic Trends Dr Natalie Jackson Director, Natalie Jackson Demographics Ltd. INVITED ADDRESS TO NELSON CITY COUNCIL, NELSON OCTOBER 27 T H 2017

Outline 1. 2. 3. 4. 5. Population ageing – what it is, what it means Migration and natural increase Joining the dots. . Implications for growth Implications for labour supply and housing Broader context/change in components of growth/implications for Nelson’s longer-term growth NATALIE JACKSON DEMOGRAPHICS LTD 2

Nelson City – one of NZ’s ‘older’ TAs Percentage aged 65+ years 35 Percentage aged 65+ years 30 Observed 23. 0 25 10 23. 1 19. 8 20 15 32. 7 Projected 17. 2 Nelson City (Medium) Nelson City (High) Nelson City (Observed) Total NZ (medium) 14. 1 11. 5 5 0 1996 2001 2006 2013 2018 2023 Year 2028 2033 2038 2043 Source: Author/Stats NZ 2016, 2017 (2013 -Base – 2043 Update) NATALIE JACKSON DEMOGRAPHICS LTD 3

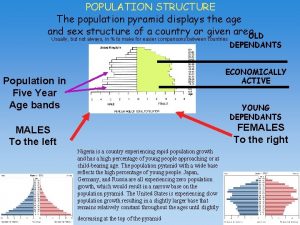
Nelson City 2016 (1996 Unshaded) Age Structure Population of Nelson City currently 22 nd oldest of 67 Territorial Authority Areas (TAs) There is considerable ‘ageing-in-place’ along with sizeable retirement migration 40% of Nelson’s growth 1996 -2016 came from growth in the 65+ years population 85+ 80 -84 75 -79 70 -74 65 -69 60 -64 55 -59 50 -54 45 -49 40 -44 35 -39 30 -34 25 -29 20 -24 15 -19 10 -14 5 -9 0 -4 Male 6. 0 Female 4. 0 2. 0 0. 0 2. 0 4. 0 6. 0 percentage at each age 65+ years: 18. 9% (1996 = 14. 1%) Statistics New. Zealand ERP NATALIE JACKSON DEMOGRAPHICS LTD 4

Nelson slightly younger than Tasman and Marlborough (and Buller, Hurunui) Tasman 2016 (1996 Unshaded) 85+ 80 -84 75 -79 70 -74 65 -69 60 -64 55 -59 50 -54 45 -49 40 -44 35 -39 30 -34 25 -29 20 -24 15 -19 10 -14 5 -9 0 -4 Male 6. 0 4. 0 Marlborough 2016 (1996 Unshaded) Female 2. 0 0. 0 2. 0 4. 0 6. 0 85+ 80 -84 75 -79 70 -74 65 -69 60 -64 55 -59 50 -54 45 -49 40 -44 35 -39 30 -34 25 -29 20 -24 15 -19 10 -14 5 -9 0 -4 Male 6. 0 percentage at each age 65+ years: 20. 3% (1996 = 12. 3%) Statistics New. Zealand ERP 4. 0 Female 2. 0 0. 0 2. 0 4. 0 6. 0 percentage at each age 65+ years: 22. 3% (1996 = 14. 2%) NATALIE JACKSON DEMOGRAPHICS LTD 5

Age structures and rates of structural ageing differ greatly across the country Auckland 2016 (1996 Unshaded) 85+ 80 -84 75 -79 70 -74 65 -69 60 -64 55 -59 50 -54 45 -49 40 -44 35 -39 30 -34 25 -29 20 -24 15 -19 10 -14 5 -9 0 -4 Male 6. 0 4. 0 Wellington 2016 (1996 Unshaded) Female 2. 0 0. 0 2. 0 4. 0 6. 0 85+ 80 -84 75 -79 70 -74 65 -69 60 -64 55 -59 50 -54 45 -49 40 -44 35 -39 30 -34 25 -29 20 -24 15 -19 10 -14 5 -9 0 -4 Male 6. 0 percentage at each age 65+ years: 11. 8% (1996 = 10. 1%) Statistics New. Zealand ERP 4. 0 Female 2. 0 0. 0 2. 0 4. 0 6. 0 percentage at each age 65+ years: 10. 1% (1996 = 8. 6%) NATALIE JACKSON DEMOGRAPHICS LTD 6

What does it mean to age ‘structurally’? Population ageing in four dimensions: q. Increased numbers at older ages due to increasing longevity = ‘numerical ageing’ q. Increased proportions at older ages due to declining birth rates + numerical ageing = ‘structural ageing’ q. Structural ageing reduces ‘natural increase’ q. More elderly than children >> more deaths than births >> natural decrease >> end of growth >> depopulation Structural ageing and the ending of growth may be accelerated by migration v. Migration-driven loss of young adults/gain of retirees accelerates structural ageing, hastens the end of natural increase – both are directly affecting Nelson City and surrounding districts NATALIE JACKSON DEMOGRAPHICS LTD 7

Nelson already has more elderly than children Number aged 0 -14 and 65+ years 20, 000 18, 000 Observed Projected Number 16, 000 14, 000 0 -14 12, 000 65+ 10, 000 8, 000 6, 000 4, 000 2, 000 0 1996 2001 2006 2013 2018 2023 2028 2033 2038 2043 Source: Statistics New Zealand, Estimated Resident Population; (1996 -2013) ; Subnational Population Projections: 2013(base)– 2043 (Update) NATALIE JACKSON DEMOGRAPHICS LTD 8

The 65+ population will account for all of Nelson’s future growth (+ surrounds) Contribution to growth by 65+ year population 300 250 280. 0 1996 -2016 Projected (2013 -2043) percentage 200 171. 0 150 114. 0 100 50 72. 9 39. 9 50. 0 47. 7 27. 9 0 Nelson Tasman Marlborough New Zealand NATALIE JACKSON DEMOGRAPHICS LTD 9

Summary – Nelson’s ageing in context 1996 -2016 Nelson had 18 th fastest growth rate v. Tasman 13 th, Marlborough 20 th Nelson currently 22 nd ‘oldest’ of 67 TAs v However Marlborough 6 th, Tasman 14 th Nelson City ageing faster than many, projected to be 14 th oldest by 2043 v However Tasman 2 nd, Marlborough 9 th Nelson thus ‘old’ but surrounded by even older areas (+Buller, Hurunui. . ); implications for growth, labour supply, housing NATALIE JACKSON DEMOGRAPHICS LTD 10

Nelson City – has been growing steadily + recent increase in growth rate Nelson City 60, 000 50, 000 30, 000 20, 000 10, 000 0 1986 1987 1988 1989 1990 1991 1992 1993 1994 1995 1996 1997 1998 1999 2000 2001 2002 2003 2004 2005 2006 2007 2008 2009 2010 2011 2012 2013 2014 2015 2016 Number 40, 000 NATALIE JACKSON DEMOGRAPHICS LTD 11

Net change in population size 1976 -2013 Nelson, Tasman and Marlborough have been among the ‘winners’ 1976 -2013 NATALIE JACKSON DEMOGRAPHICS LTD 12

Nelson’s growth is projected to level off around 2030 70000 60000 Observed Projected 40000 30000 Estimated Resident Population SNZ 2017 (medium) 20000 SNZ 2017 (high) 10000 NATALIE JACKSON DEMOGRAPHICS LTD 2043 2041 2039 2037 2035 2033 2031 2029 2027 2025 2023 2021 2019 2017 2015 2013 2011 2009 2007 0 2001 Number 50000 13

Most of Nelson’s growth has been from migration Canterbury Earthquakes Components of change – Nelson City +1, 200 +1, 000 Number +800 +600 +400 +200 Natural Increase Estimated Migration 2015 -16 2014 -15 2013 -14 2012 -13 2011 -12 2010 -11 2009 -10 2008 -09 2007 -08 2006 -07 2005 -06 2004 -05 2003 -04 2002 -03 2001 -02 2000 -01 1999 -2000 1998 -99 1997 -98 1996 -97 1995 -96 1994 -95 1993 -94 1992 -93 1991 -92 -200 1991 +00 Net Change Source: Stats NZ Births, Deaths, ERP (Note change of timing and method of enumeration between 1995 and 1996 means that only natural increase can be shown for that year) NATALIE JACKSON DEMOGRAPHICS LTD 14

Christchurch -400 Grey NATALIE JACKSON DEMOGRAPHICS LTD South Waikato Taupo 15 Wellington Tasman Dunedin Tauranga Far North Gore Buller Mackenzie Masterton Ruapehu Selwyn Waipa Waimate New Plymouth Western Bay of Plenty Southland 400 Gisborne Net Gain Hamilton 800 Thames-Coromandel 2008 -13 Porirua Clutha Manawatu Ashburton Central Hawke's Bay -200 South Taranaki Matamata-Piako Wairoa Rangitikei Upper Hutt Stratford Palmerston North Whakatane Waikato Timaru Waitomo Tararua Hauraki Waitaki Westland Carterton Lower Hutt Hastings Kaipara Waimakariri Central Otago Rotorua Kaikoura Horowhenua Kapiti Coast Wanganui Hurunui Invercargill 600 Napier Whangarei Queenstown-Lakes Auckland Marlborough Number Nelson made a ‘novel’ gain from the Canterbury earthquakes % Net Internal migration FROM Christchurch 2008 -2013: +63% 2001 -2006: -42% 1996 -2001: -16% 1991 -1996: -40% 200 0 Net Loss

Most of Nelson’s migrants are families with children, and increasingly retirees; Nelson loses its young Net migration (%) of each age group 1996 -2013 - Nelson 15. 0 10. 0 5. 0 -10. 0 -15. 0 -20. 0 -25. 0 -30. 0 1996 -2001 9/16/2020 2001 -2006 JACKSON AND PAWAR 2017 85+ 80 -84 75 -79 70 -74 65 -69 60 -64 55 -59 50 -54 45 -49 40 -44 35 -39 30 -34 25 -29 20 -24 15 -19 10 -14 5 -9 -35. 0 0 -4 percentage 0. 0 2008 -2013 16

Nelson is not alone in losing its young NATALIE JACKSON DEMOGRAPHICS LTD 17

NATALIE JACKSON DEMOGRAPHICS LTD 18

Net internal migration at 65+ years, 2006 -2013 RETIREE SUN -BELT MIGRATION IS INCREASING NATALIE JACKSON DEMOGRAPHICS LTD 19

Until recently, the vast majority of Nelson’s migrants were ‘internal’ Components of migration 1996 -2013 +3, 000 +2, 500 +2, 000 Estimated Net Migration (Rank 11, 30, 7) Number +1, 500 Estimated Overseas Migration (Rank 21, 34, 3) +1, 000 +500 Estimated Internal Migration (Rank 12, 24, 37) +00 -500 -1, 000 1996 - 2001 - 2006 2008 -2013 NATALIE JACKSON DEMOGRAPHICS LTD 20

Nelson consistently loses population to Tasman, gains it from Marlborough 400 161 200 155 129 204 Number 0 -200 -154 -400 -600 2008 -13 2001 -06 -605 -800 -1000 -663 -906 Net loss to Tasman NATALIE JACKSON DEMOGRAPHICS LTD 1996 -01 1991 -06 Net gain from Marlborough 21

• Data are available by age and sex, four census periods 9/16/2020 JACKSON ET AL. 22

. . s t o d e h t Joining Age Structure Natural Increase ON I T A GR I M NATALIE JACKSON DEMOGRAPHICS LTD 23

Ageing and labour supply NATALIE JACKSON DEMOGRAPHICS LTD 24

Percentage TA’s with more elderly than children Most TAs will soon have more elderly than children (65+ : 014 years); Marlborough, Nelson and Tasman already among them 100 90 80 70 60 50 40 30 20 10 0 OBSERVED PROJECTED (MEDIUM VARIANT) 97. 0 98. 5 89. 6 73. 1 58. 2 35. 8 14. 9 0. 0 1996 3. 0 4. 5 2001 2006 2013 2018 2023 2028 2033 2038 Source: Statistics New Zealand, Estimated Resident Population; (1996 -2013) ; Subnational Population Projections: 2013(base)– 2043 (Update) 2043 Author/Statistics NZ 2017 Subnational population projections (2013 -base 2043 Update) NATALIE JACKSON DEMOGRAPHICS LTD 25

Most TAs already have more people at labour market exit age (60 -69 years) than entry age (20 -29 years); Nelson, Marlborough and Tasman among them PROJECTED (MEDIUM VARIANT) 100 83. 6 88. 1 62. 7 TG Gen 85. 1 76. 1 38. 8 40 20 0 22. 4 6. 0 1996 2001 2006 70. 1 59. 7 Nelson 60 es rriv YH a 80 Tasman, Marlborough Percentage TA’s with more exits than entrants OBSERVED 2013 2018 2023 2028 2033 2038 2043 Source: Statistics New Zealand, Estimated Resident Population; (1996 -2013) ; Subnational Population Projections: 2013(base)– 2043 (Update) Author/Statistics NZ 2017 Subnational population projections (2013 -base 2043 Update) NATALIE JACKSON DEMOGRAPHICS LTD 26

Local labour market supply is unlikely to grow appreciably Projected Number Aged 20 -69 years (Medium Variant), Nelson, Tasman and Marlborough 35, 000 Number aged 20 -69 years 30, 000 25, 000 20, 000 15, 000 10, 000 5, 000 0 2013 2018 Nelson City (+1. 3%) 2023 2028 Tasman (-7. 5%) 2033 2038 2043 Marlborough (-12. 5%) Author/Statistics NZ 2017 Subnational population projections (2013 -base 2043 Update) NATALIE JACKSON DEMOGRAPHICS LTD 27

NZ’s ‘prime’ working age population (15 -64 years) is projected to shrink significantly in many areas. By 2023, 46% of NZ’s WAPs are projected to be smaller than in 2013 (but 13% larger at national level); by 2043, 67% WAPs smaller than in 2013 (but 23% larger at national level) NATALIE JACKSON DEMOGRAPHICS LTD. 28

Ageing and housing NATALIE JACKSON DEMOGRAPHICS LTD 29

Ageing and housing 1. As structural ageing progresses, average household(HH) size falls v More older people are widowed, live alone v Later family formation means fewer per HH v Fewer children means empty nest stage is reached earlier 2. Nelson’s 2013 average of 2. 4 persons per HH projected to fall to 2. 3 (2018) then 2. 2 (c. 2033) 3. Family Type and HH mix differs by township 4. Need to ensure appropriate housing mix NATALIE JACKSON DEMOGRAPHICS LTD 30

Household size Current and Projected Average Household Size 2. 7 Average Household Size 2. 6 2. 5 2. 4 2. 3 2. 2 2. 1 2 2013 2018 Total NZ 2023 Tasman 2028 Nelson 2033 2038 Marlborough Author/Statistics New Zealand Subnational Household Projections (Medium) NATALIE JACKSON DEMOGRAPHICS LTD 31

Housing tenure is changing Nelson City 120% 100% 18. 5 80% 20. 6 81. 5 27. 2 31. 7 68. 3 60% 31. 0 32. 4 11. 1 13. 6 54. 0 40% 67. 6 20% 0% 1986 1991 1996 Home Ownership 2001 Family Trust 2006 2013 Renting SOURCE: AUTHOR/STATISTICS NEW ZEALAND, CUSTOMISED CENSUS DATABASE, HOUSING TENURE 1986 -2013 32

Can migration resolve these issues? NATALIE JACKSON DEMOGRAPHICS LTD 33

Nelson has increasingly gained from migration Nelson with and without migration since 1976 50000 45000 40000 Number 35000 30000 25000 20000 15000 10000 5000 0 1976 1981 1986 1991 Population with zero migration 1996 2001 2006 2013*~ Actual Population (summed) Source: (Jackson and Brabyn 2017) Tai Timu Tangata: Taihoa e? NATALIE JACKSON DEMOGRAPHICS LTD 34

Even HUGE migration numbers cannot prevent structural ageing Projected % aged 65+ years 28. 2 30 24. 4 150 k, med fert and mort 125 k, med fert and mort Percentage aged 65+ years 25 23. 6 20 100 k, med fert and mort 75 k, med fert and mort 50 k, med fert and mort 15 25 k, med fert and mort 13. 9 10 12. 5 k, med fert and mort zero migration, med fert and mort SNZ MED 15 k, med fert, med mort 5 2068 2063 2058 2053 2048 2043 2038 2033 2028 2023 2018 2013 0 Source: Jackson and Cameron 2017 NATALIE JACKSON DEMOGRAPHICS LTD 35

Migration is more likely to make areas older rather than younger – this affects Nelson (although less than Tasman and Marlborough) Impact of migration on structural ageing, 1976 -2013 100. 0 90. 0 80. 0 Percentage 70. 0 60. 0 78. 8 66. 4 84. 7 50. 0 40. 0 30. 0 20. 0 10. 0 33. 6 21. 2 15. 3 Territorial Authority Areas (N -66) Towns (N=143) 0. 0 Rural Centres (N=132) Younger/same migration with Migration Older withageing. . Migration Jackson and Brabyn (forthcoming) Age-selective and population Source: (Jackson and Brabyn 2017) Tai Timu Tangata: Taihoa e? NATALIE JACKSON DEMOGRAPHICS LTD 36

0 NATALIE JACKSON DEMOGRAPHICS LTD Nelson Tasman Timaru % 65+ Years With Migration 65+ Years Without Jackson and Brabyn (forthcoming) Age-selective migration and%population ageing. . Migration (14 TAs younger) Source: (Jackson and Brabyn 2017) Tai Timu Tangata: Taihoa e? 37 Thames-Coromandel Kapiti Coast Horowhenua Waimate Waitaki Hauraki Central Otago Marlborough 30 Kaipara South Wairarapa Kaikoura Western Bay of Plenty Tauranga Wanganui Masterton Gore Carterton Napier Whangarei Far North Matamata-Piako 17. 4 Kawerau Hurunui Rangitikei 20 Central Hawke's Bay Opotiki Tararua Taupo New Plymouth Waimakariri Buller Ashburton Waipa Stratford Invercargill Grey Mackenzie Manawatu South Waikato Clutha Wairoa Westland Hastings Whakatane Christchurch Dunedin South Taranaki Upper Hutt Gisborne Rotorua Waitomo Southland Palmerston North Ruapehu Otorohanga Lower Hutt Waikato Auckland Hamilton Selwyn Queenstown-Lakes Porirua Wellington Percentage TAs younger/older with migration, than without Percentage aged 65+ years with and without migration 1976 -2013 N=66 25 20. 5 17. 9 15 10 5

There are complex interactions between net migration and natural increase A: Natural Increase and Net Migration are both positive Growth B: Natural Increase offsets Net Migration Loss C: Net Migration Gain offsets Natural Decrease D: Net Migration Gain fails to offset Natural Decrease Decline E: Natural Increase fails to offset Net Migration Loss F: Natural Decrease and Net Migration Loss Zero Growth 9/16/2020 G: Natural Increase = Net Migration Loss H: Natural Decrease = Net Migration Gain JACKSON AND BRABYN 38

Observed 1976 -2013 2038 -43 2033 -38 2028 -33 2023 -28 2018 -23 2013 -18 2006 -13 2001 -06 1996 -01 1991 -06 1986 -91 1981 -86 TA 1976 -81 Local causes of growth/decline differ, and are now changing due to ageing Projected 2013 -2043 (Medium) NELSON A A A A A C C C MARLBOROUGH B A A A C D D TASMAN A A A A A C C C G GROWTH: A (both positive); B (Natural increase offsets net migration loss); C (Migration gain offsets natural decrease) Jackson and Brabyn (forthcoming) Age-selective migration and population ageing. . DECLINE: D (Net migration gain fails to offset natural decrease); E (Natural increase fails to offset net migration loss); F (both negative) 39

All TAs by components of growth/decline 33 21 44 70% 60% 18 32 32 50% 26 61 30% 46 10% 32 41 49 39 67 22 26 40% 20% 50 42 30 24 24 29 29 29 6 23 24 11 20 18 20 14 8 2023 -28 2018 -23 2013 -18 2006 -13 2001 -06 1996 -01 1991 -96 1986 -91 1981 -86 21 11 21 8 17 6 20 9 17 5 0% 1976 -81 28 18 20 Zero Growth Decline from both negative components Natural Increase fails to offset Net Migration Loss Net Migration Gain fails to offset Natural Decrease Net Migration Gain offsets Natural Decrease Natural Increase offsets Net Migration Loss 27 2038 -43 80% 30 2033 -38 21 2028 -33 90% Projected Observed 100% from both components Source: Jackson et. Growth al. forthcoming; Statspositive NZ, Subnational Population Projections: 2013(base)– 2043 (Update) Source: (Jackson et al) Tai Timu Tangata: Taihoa e? JACKSON ET AL FORTHCOMING 40

Summary/Implications for Nelson 1. Nelson is assured of continued growth for the next few decades, but growth will be increasingly at 65+ years, and will slow 2. Being one of the older/faster ageing areas means that many other areas are younger, with potential migrant and labour supply 3. However contiguous location with [older] Marlborough and Tasman (and Buller, Hurunui) will make increasing local supply difficult 4. Older and younger areas alike will compete with Nelson for migrants/labour supply 5. Ageing will affect EVERYTHING and needs to be built into all aspects of planning

Thank you Enquiries welcome Email: demographics@nataliejackson. net Website: www. nataliejackson. net Planning for a changing world NATALIE JACKSON DEMOGRAPHICS LTD 42
 Global trends in hrm
 Is mexico city a primate city
 Griffen-ford model
 Cbd inner city outer city
 Demographic transition theory
 Starbucks wheel
 China demographic dividend
 Rimland theroy
 On formalizing fairness in prediction with machine learning
 Demographic profile in statement of the problem
 Bts fan age demographic 2020
 Demographic transition model ap human geography
 Old woman
 Population pyramid stage 1
 Demographic segmentation of tesla
 Haiti demographic transition model
 Demographic momentum ap human geography
 Galapagos
 Sources of demography ppt
 Ernst ravenstein ap human geography
 Broacoes
 Demographic data definition
 Italy population pyramid
 Demographic transition model example
 Demographic dimensions of consumer market
 Demographic transition model worksheet
 Theory of demographic transition
 Two big breaks in the demographic transition
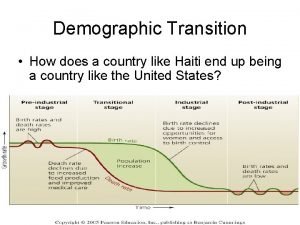
 Demographic transition
 Biohacking market demographic
 Age and life cycle segmentation
 Demographic transition model uk
 Luxury consumer demographics
 Uk demographic transition model
 Demographic transistion model
 Demographic imperative intercultural communication
 Afghanistan population 2050
 Demographic transition model song
 Recent demographic changes in the uk
 Demographic momentum ap human geography definition
 Primary segmentation
 Ravenstein's laws of migration ap human geography
 Demographic transition model
