CRQ Demographic Transition Model Demographic Transition Model DTM

 The demographic transition model attempts to describe and predict how")
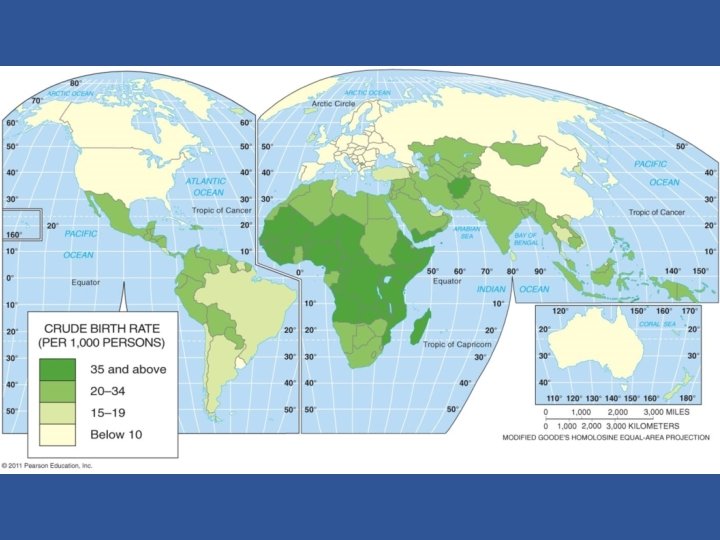
 • Crude Death Rate")


 have already moved into stages 3 and 4. As LDC’s")
 during")


 is low because although")

 is high because there")

 remains high due to")

 is again low as")
- Slides: 34
CRQ: Demographic Transition Model
Demographic Transition Model (DTM) The demographic transition model attempts to describe and predict how a population will change over time as it changes from an agrarian society to an industrial, and post-industrial society.
Key terms in the DTM: • Crude Birth Rate (CBR) • Crude Death Rate (CDR) • Natural Increase Rate (NIR) • Total Fertility Rate (TFR) • Infant Mortality Rate (IMR) • Life Expectancy
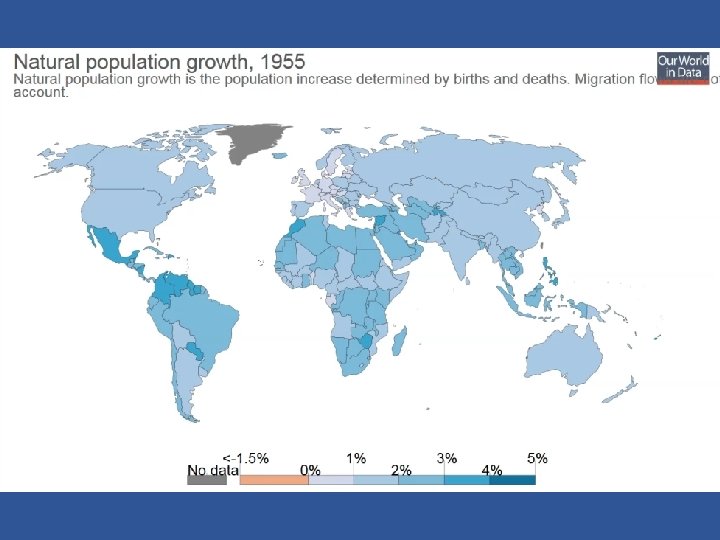
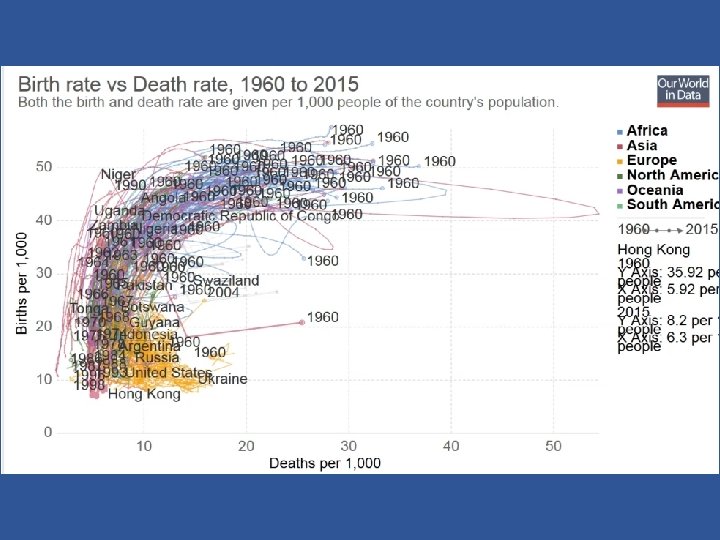
CBR: total number of live births in a year for every 1, 000 people alive in the society CDR: the total number of deaths in a year for every 1, 000 people alive in the society NIR: the percentage growth of a population in a year, computed as the crude birth rate minus the crude death rate TFR: the average number of children a woman will have throughout her childbearing years IMR: the total number of deaths in a year among infants under 1 year old for every 1, 000 live births in a society Life Expectancy: the average number of years an individual can be expected to live, given current social, economic & medical conditions. Life expectancy at birth is the average number of years a newborn infant can expect to live.
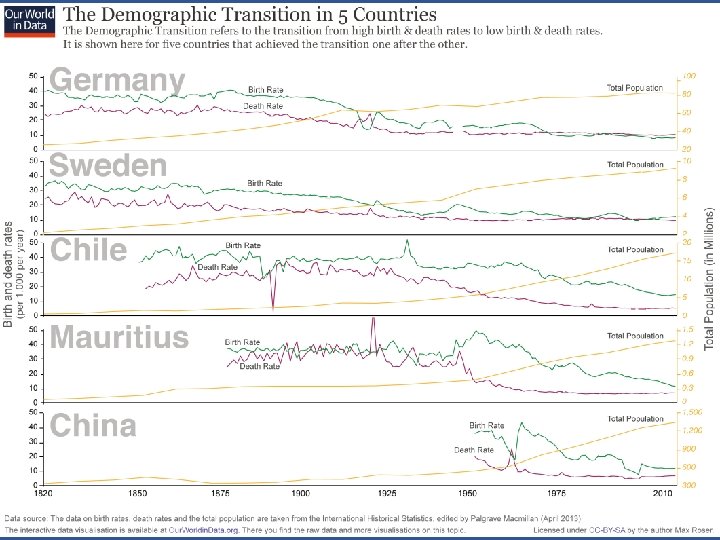
The Demographic Transition n ul p Po io at
n ul p Po Stage 1: high, fluctuating CBR and CDR / near zero (. 05% NIR), population low io at
Human society has been in stage 1 for most of human history.
n ul p Po Stage 1: high, fluctuating CBR and CDR / near zero (. 05% NIR), population low io at Stage 2: CDR falls, CBR remains high, increasing NIR and rapid population growth
It’s easy to see when the world entered stage 2: around 1800 with the Industrial Revolution.
n ul p Po Stage 1: high, fluctuating CBR and CDR / near zero (. 05% NIR), population low io at Stage 2: CDR falls, CBR remains high, increasing NIR and rapid population growth Stage 3: CDR decline slows, CBR falls, NIR falls, population growth slows
n ul p Po Stage 1: high, fluctuating CBR and CDR / near zero (. 05% NIR), population low io at Stage 2: CDR falls, CBR remains high, increasing NIR and rapid population growth Stage 3: CDR decline slows, CBR falls, NIR falls, population growth slows Stage 4: Low CDR and CBR, low NIR, stable (but now large) population
MDC’s (More Developed Countries) have already moved into stages 3 and 4. As LDC’s (Less Developed Countries) move into stages 3 and 4, total world population will level off at around 12 billion people sometime around the year 2100.
How has each of the following states challenged the DTM (Demographic Transition Model) during the time periods listed? a. South Korea (1945 -present) b. Niger (present) c. Zimbabwe (late 1990’s-early 2000’s) d. Japan (1945 -present)
AIDs in southern Africa: DTM in reverse?
Niger: Stuck in the “Demographic Trap”?
South Korea Raced through Stage II:
Japan: Time for a Stage 5 in the DTM!
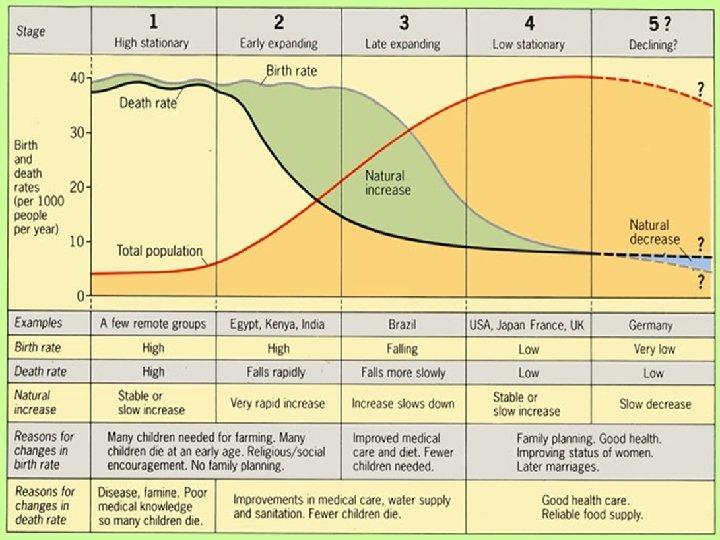
Population Demographic transition model The demographic transition model shows how a population will change over time as it changes from an agrarian society to an industrial, and postindustrial one. Stage 1. Birth and death rates are both high, leading to a low but stable population. High fluctuating UK pre 1760/Industrial Revolution. Remote tribal groups presently.
Population Demographic transition model The demographic transition model shows how a population will change over time as it changes from an agrarian society to an industrial, and postindustrial one. Stage 2. Birth remain high but now death rates start to fall dramatically, leading to a rising population. Early expanding UK pre 1760 -1880. Peru/Sri Lanka/Kenya presently.
Population Demographic transition model The demographic transition model shows how a population will change over time as it changes from an agrarian society to an industrial, and postindustrial one. Stage 3. Birth start to fall now and death rates continue to fall, causing the population to continue to rise but less quickly now as the gap between births and deaths is closing. Late expanding UK 1880 -1940 China/Cuba/Australia presently.
Population Demographic transition model The demographic transition model shows how a population will change over time as it changes from an agrarian society to an industrial, and postindustrial one. Stage 4. Birth and death rates are now both low, causing the population to be more stable but high. Low fluctuating UK post 1940 Canada/USA/Japan.
Stage 1 – High Fluctuating High CBR • Reasons: High IMR Lack of family planning Need for workers Children are economic assets(support parents) • Religious beliefs • • • Roman Catholics • Muslims • Hindus High CDR • Reasons: • • • Disease Famine War Poor hygiene & sanitation Lack of healthcare Lack of education
Population Demographic transition model Stage 1. Natural increase (population growth) is low because although there a lot of births the similarly high number of deaths effectively cancels them out, leaving a low but stable population.
Stage 2 – Early Expanding • Same reasons as Stage 1 High CBR Declining CDR • Reasons: • • • Improved healthcare Improved sanitation Improved food production Decreasing IMR Outside stimulus
Population Demographic transition model Stage 2. Natural increase (population growth) is high because there is now a large gap between births and deaths, increasing the population rapidly.
Stage 3 – Late Expanding • Same reasons as Stage 2 Declining CBR Reasons: ◦ Changing status of women ◦ ◦ Cairo Conference Availability of family planning Lower IMR Increased standard of living Better technology = lower demand for workers ◦ Welfare/Retirement Declining CDR
Population Demographic transition model Stage 3. Natural increase (population growth) remains high due to the gap between births and deaths but at this stage the increase slows as births and deaths match up again.
Stage 4…and 5? Stage 4 – Low Fluctuating • CBR & CDR are low • Population is stable Stage 5 • CBR drops below CDR • Population starts to decrease • Officially only 4 stages • Not part of the original DTM, but some geographers have added it • So if there is 5, why not 6?
Population Demographic transition model Stage 4. Natural increase (population growth) is again low as births and deaths virtually cancel each other out, but now the population is high. .