The Demographic Transition A Contemporary Look at a


- Slides: 19

The Demographic Transition — A Contemporary Look at a Classic Model A lesson plan from “Making Population Real” by the Population Reference Bureau Supported by the World Population Fund of the Minneapolis Foundation

Today’s Agenda 1. Introduce objectives and teaching standards 2. Describe and explore the “classic” model of demographic transition 3. Explore alternative patterns from today’s developing countries 4. Discuss the use of models 5. Introduce Making Population Real and PRB

Making Population Real – Lesson Plan 2: The Demographic Transition Issues n Population growth n Development Population Concepts n Classic Tools n Line model of demographic transition n Patterns of changing birth and death rates graphs n Research and analysis

Objectives n n To understand the classic demographic transition (DT) model To explain assumptions and limitations of the classic DT model To construct graphs of contemporary demographic change To explain contemporary demographic patterns in the context of the classic DT model

Teaching Standards AP Geography Standard Addressed Unit II– Population Unit B. Population growth and decline over time and space 4. Regional variations of demographic transitions AP and the Advanced Placement Program are registered trademarks of the College Entrance Examination Board which was not involved in the production of these lesson plans.

What is the Demographic Transition? n n n The shift from high to low mortality and fertility Based on the experience of Western Europe Began by Warren Thompson in 1929 Further developed in 1945 by Frank Notestein A sign of socio-economic progress?

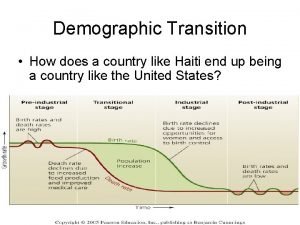
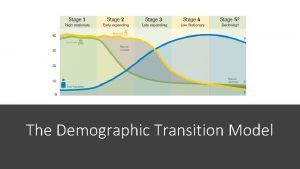
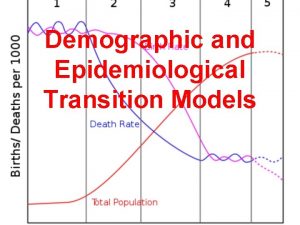
The Classic Demographic Transition Stage 1 Stage 2 Stage 3 Stage 4 Birth rate Natural increase Death rate Time Note: Natural increase is produced from the excess of births over deaths.

Examine the Model A Model is … ¨a representation of some phenomenon of the real world made in order to facilitate an understanding of its workings ¨a simplified and generalized version of real events, from which the incidental detail has been removed

Making Population Real – Lesson Plan 2: The Demographic Transition What population patterns are revealed in the traditional Demographic Transition model? Assignment: n Construct a graph of birth and death rates in England from 1750 -2000.

Making Population Real – Lesson Plan 2: The Demographic Transition

Demographic Transition in Sweden and Mexico Births/Deaths per 1, 000 1750 Sources: B. R. Mitchell, European Historical Statistics 1750 -1970 (1976): table B 6; Council of Europe, Recent Demographic Developments in Europe 2001 (2001): tables T 3. 1 and T 4. 1; CELADE, Boletin demografico 69 (2002): tables 4 and 7; Francisco Alba-Hernandez, La poblacion de Mexico (1976): 14; and UN Population Division, World Population Prospects: The 2002 Revision (2003): 326.

Making Population Real – Lesson Plan 2: The Demographic Transition How useful is the classic model of demographic transition in today’s world? Assignment: n Construct a graph showing the birth and death rates for one of four assigned countries.

Data for Demographic Transition

Is the Demographic Transition Model Still Useful? n n How well does the classic model work? Is it a useful framework for developing countries? Do developing countries need to share the experiences of Europe and the United States? Is the socioeconomic change experienced by industrialized countries a prerequisite or a consequence of demographic transition?

Making Population Real – Lesson Plan 2: The Demographic Transition Activities: 1. Explaining Population Change: Graph changing birth & death rates in classic model (England) ¨ Graph & compare rates for Sweden & Mexico ¨ 2. 3. Global Population Patterns and Demographic Transitions: ¨ Calculate natural increase by continent & country ¨ Compare demographic with economic indicators Can an Old Model Explain New Trends? ¨ Compare national population patterns to model

Making Population Real Lesson Plans n Population Fundamentals – Building a Foundation n Populations in the Path of Natural Hazards n The Demographic Transition – A Contemporary Look at a Classic Model n HIV/AIDS and Contemporary Population Dynamics n Population Policy – Progress Since Cairo n People on the Move n Global Migration Patterns

About Making Population Real n Free, on-line curricula utilize up-to-date realworld data and articles from a variety of webbased resources: n n n United Nations (UNICEF, UNHCR, WHO, etc. ) U. S. Census Bureau National Oceanic and Atmospheric Administration PRB research and publications Lead author Martha B. Sharma, a teacher Recipient of the 2006 Geographic Excellence in Media Award from National Council for Geographic Education www. prb. org/educators

Population Reference Bureau n Informs people around the world about population, health, and the environment, and empowers them to use that information to advance the well-being of current and future generations. n Analyzes demographic data and research to provide objective, accurate, and up-to-date population information in a format that is easily understood by educators, journalists, and decision makers alike.

 Look up look down look around
 Demographic transition def
 Ap human geography models and theories
 Boserup
 Herbicides definition ap human geography
 Warren thompson's demographic transition model
 Demographic transition model example
 Demographic transition model ap human geography
 Demographic transition model population pyramids
 Demographic transition theory
 Demographic transition
 Haiti dtm stage
 Uk demographic transition model
 Demographic transition model
 Demographic transition model worksheet
 Demographic transition model ap human geography
 Afghanistan demographic transition model
 Demographic transition model stages
 Dtm model
 Demographic transition model song
