Demographic Transition Model What is the Demographic Transition

? • The demographic transition model explains the")

 Stage A / 1 Both high birth")

 Stage B / 2 Birth rates remain")


 Stage C / 3 Birth rates now")


 Stage D / 4 Both birth rates")


 Stage E / 5? A stage 5")
 The PPM - 'Population Pyramid Model' shows")


- Slides: 21
Demographic Transition Model
What is the Demographic Transition Model (DTM)? • The demographic transition model explains the transformation of countries from having high birth and death rates to low birth and death rates. • In developed countries this transition began in the 18 th century and continues today. • Less developed countries began the transition later and many are still in earlier stages of the model.
Stage One Birth Rate and Death rate are both high. Population growth is slow and fluctuating. Birth Rate is high because of: • Lack of family planning • High Infant Mortality Rate: putting babies in the 'bank' • Need for workers in agriculture • Religious beliefs • Children as economic assets Typical of Britain in the 18 th century and the Least Economically Developed Countries (LEDC's) today. Death Rate is high because of: • • • High levels of disease Famine Lack of clean water and sanitation Lack of health care War Competition for food from predators such as rats • Lack of education
Model 1: The DTM (Demographic Transition Model) Stage A / 1 Both high birth rates and death rates fluctuate in the first stage of the population model giving a small population growth (shown by the small total population graph).
Stage Two Birth Rate remains high. Death Rate is falling. Population begins to rise steadily. Death Rate is falling as a result of: • • • Improved health care (e. g. Smallpox Vaccine) Improved Hygiene (Water for drinking boiled) Improved sanitation Improved food production and storage Improved transport for food Decreased Infant Mortality Rates Typical of Britain in 19 th century; Bangladesh; Nigeria
Model 1: The DTM (Demographic Transition Model) Stage B / 2 Birth rates remain high, but death rates fall rapidly causing a high population growth (as shown by the total population graph).
Stage 2 Kenya
Stage Three Birth Rate starts to fall. Death Rate continues to fall. Population rising. Reasons behind birth and death rate falling: • • • Family planning available Lower Infant Mortality Rate Increased mechanization reduces need for workers Increased standard of living Changing status of women Typical of Britain in late 19 th and early 20 th century; China; Brazil
Stage 3 Brazil
Model 1: The DTM (Demographic Transition Model) Stage C / 3 Birth rates now fall rapidly while death rates continue to fall. The total population begins to peak and the population increase slows to a constant.
Stage Four • Birth Rate is low. • Death Rate is low. • Population steady. Typical of USA; Sweden; Japan; Britain
Stage 4 UK
Model 1: The DTM (Demographic Transition Model) Stage D / 4 Both birth rates and death rates remain low, fluctuating with 'baby booms' and epidemics of illnesses and disease. This results in a steady population.
Stage Five Reasons for changes in birth rate: • Family planning • Better health • Later marriages • Improved status of women Reasons for changes in death rate: • Good health care • Reliable food supply • People are generally living longer Typical of Germany • Birth Rate slight fall. • Death Rate stable. • Natural increase: gentle decrease
Stage 5 Germany
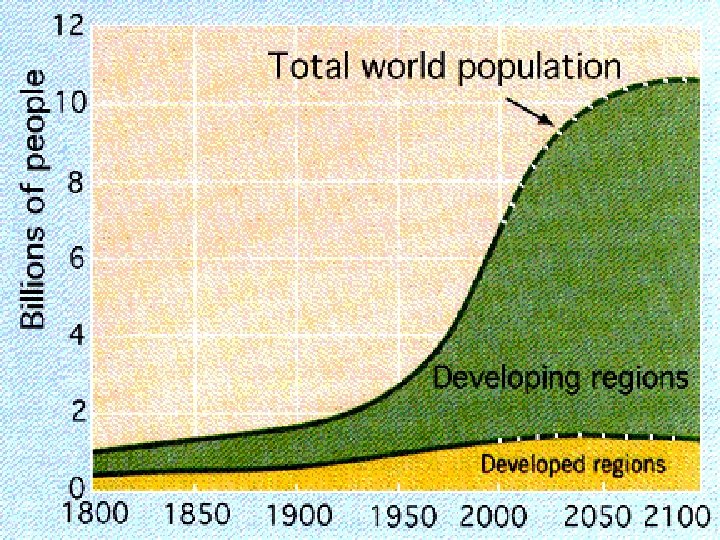
Model 1: The DTM (Demographic Transition Model) Stage E / 5? A stage 5 was not originally thought of as part of the DTM, but some western countries are now reaching the stage where total population is declining where birth rates have dropped below death rates.
Model 2: The PPM (Population Pyramid Model) The PPM - 'Population Pyramid Model' shows how dynamic (subject to change) population is. The model is structured to show 'snapshots' of a population at four points during its development, which are shown as Stages 1 - 4 (A - D). A country will progress through the stages.
What are the limitations? What limitations do you think there could be with the model? • It does not include the influences of migration • It assumes that all countries will go through the same pattern • There is no time scale • Reasons for birth rates and death rates are very different in different countries
Homework • Complete the worksheet. • Most questions can be completed on the worksheet – others need to be written on lined paper.