Mineral Spectroscopy Theory Carsten Laukamp CSIRO Mineral Resources


- Slides: 55

Mineral Spectroscopy Theory Carsten Laukamp, CSIRO Mineral Resources

Geochemistry Mineral Spectroscopy “peel” (weathered surface) crushing, grinding, sieving, filtering, … 2 | Mineral Spectroscopy Theory fresh surface

Scattering effects • Volume and / or surface scattering • Single or multiple volume scattering • Diffuse and / or specular reflection • Refractive index (real) Theory 3 | Mineral Spectroscopy n io ct fle re n io ct fra re •

Wavelength regions Ramanaidou et al. (2015) 4 | Mineral Spectroscopy Theory

Absorption in VNIR &SWIR mainly due to: Electronic and / or Vibrational processes 5 | Mineral Spectroscopy Theory

Spectral-Mineral Wavelength Regions iron oxides REEs vegetation VNIR OH-bearing hydroxyls Non-OH-bearing silicates (kaolin, chlorite, mica, amphibole) (quartz, feldspars, pyroxene, garnet) sulphates carbonates SWIR TIR From Peter Hausknecht 6 | Mineral Spectroscopy Theory

Affects on Spectral Behaviour • 1. Mineralogy • 2. Cation Composition • 3. Crystallinity (disorder) • 4. Water (free, adsorbed, absorbed, structural) • 5. Particle size • 6. Orientation • 7. Mixtures • 8. Organic matter 7 | Mineral Spectroscopy Theory

Electronic Processes Involve the transfer of electrons from lower to higher energy states within electron orbits (crystal field) or from the ligand to the cation (charge transfer) Cudahy & Ramanaidou (1997) 8 | Mineral Spectroscopy Theory

VNIR Spectra VNIR spectra of iron-oxide bearing minerals vs. other major rock forming minerals Electronic processes: Involve the transfer of electrons from lower to higher energy states within electron orbits (crystal field) or from the ligand to the cation (charge transfer) SWIR calcite muscovite Charge transfer absorption kaolinite Crystal field 0. 84 Fe 3+ OH hematite jarosite goethite Fe 3+ 0. 90 - 0. 92 0. 904 - 0. 92 0. 86 - 0. 92 limonite ferrihydrite actinolite Crystal field Fe 2+ 9 | Mineral Spectroscopy Theory

Vitreous and ochreous goethite Ochreous goethite Vitreous goethite Courtesy of Maarten Haest 10 | Mineral Spectroscopy Theory

REE-bearing VNIR Spectra • Electronic absorption processes in trivalent REE lead to sharp absorption features in the visible to near infrared wavelength region (ca. 400 to 1100 nm) (Fassel, 1961). Water-related features • Three of the fourteen REE oxides don’t show these because of their electronic configuration: La 2 O 3, Lu 2 O 3 and Ce. O 3 (White, 1967). • In high albedo samples, detection limit for Nd: 300 ppm (Rowan et al. , 1986). • Electronic absorption bands of ferric iron in iron oxides may partially mask REE-related absorption features (Rowan et al. , 1986). Locations of REE absorption features: • Nd: 420, 475, 525, 580, 740, 800, 870 • Sm: ca. 920, 1090, 1250 • Pr: ca. 595, ca. 1000 • Eu: ca. 470, ca. 540 11 | Mineral Spectroscopy Theory Rowan et al. (1986)

12 | Mineral Spectroscopy Theory

13 | Mineral Spectroscopy Theory

Spectral signatures of rock-forming minerals Ramanaidou et al. (accepted) 14 | Mineral Spectroscopy Theory

Spectral-Mineral Wavelength Regions iron oxides REEs vegetation VNIR OH-bearing hydroxyls Non-OH-bearing silicates (kaolin, chlorite, mica, amphibole) (quartz, feldspars, pyroxene, garnet) sulphates carbonates SWIR TIR From Peter Hausknecht 15 | Mineral Spectroscopy Theory

SWIR spectra - Hydroxyl Mineral Groups • Al(OH) 2170 - 2210 nm • “Fe(OH)” 2250 - 2300 nm • Topaz, Pyrophyllite, Kaolinite, Montmorillonite, Muscovite, Illite • Jarosite, Nontronite, Saponite, Hectorite • “Mg(OH)” 2300 - 2400 nm • Chlorite, Talc, Epidote, Amphibole, Antigorite, Biotite, Phlogopite • Si(OH) • Opaline silica 16 | Mineral Spectroscopy Theory 2240 nm (broad) SWIR & TIR • Vibrational processes related to OH (consider location of OH group and occupation of cation sites! e. g. dioctahedral and tri-octahedral) • Fundamental stretching (2700 - 3000 nm region) • Fundamental bending (9000 - 11000 nm region) • Overtone and combination tones (SWIR active) • 1400 nm feature (1 st overtone of OH fundamental stretching vibration) • 2000 -2500 nm features (combination of stretching and bending vibrations)

Al(OH) Mineral Spectra (n+d) Al 2 OH 17 | Mineral Spectroscopy Theory

Al-OH (Kaolin) Spectra • Different 1400 nm doublet spacings 2 n Al 2 OH Mineral Spectroscopy Theory Different absorption geometry between 2160 and 2210 nm (n+d) Al 2 OH

Crystallinity • Ordered versus disordered kaolin group minerals • More ordered samples produce stronger, sharper absorptions: doublets are more sharply defined • The Hinckley Index • Other Kaolin family variations – (Halloysite, Kaolinite, Dickite) • Ordered versus disordered illite / muscovites • 1 M, 2 M & 2 T illites 19 | Mineral Spectroscopy Theory

Kaolinite Hinckley Index Series Cudahy (1997) 20 | Mineral Spectroscopy Theory

Kaolin Group 2 n. Al-O-H n+d. Al-O-H cry Kaolinite bound vs. unbound H 2 O Al 2 Si 2 O 5(OH)4 nity lli sta Kaolinite (well crystalline) m hism p r o y pol n+d(OH)o 2159, 2169, 2180 nm n+d(OH)i 2206 nm Laukamp et al. (2013) 21 | Mineral Spectroscopy Theory

Application 1: transported vs in situ Rocklea Dome CID V Well-ordered kaolinite Height exaggeration: 12* Poorly-ordered kaolinite 22 | Mineral Spectroscopy Theory Well-ordered kaolinite From Maarten Haest (2012)

Application 2: SWIR for mapping hydrothermal alteration epidote illite montmorillonite halloysite /dickite + kaolinite alunite proximal - - - distal chlorite USGS Spectral Library Quartz-Alunite Epithermal systems, modified after Tosdal et al. (2009 ) 23 | Mineral Spectroscopy Theory

Mineral chemistry OH vibrations in phyllosilicates (modified after Bishop et al. , 2008) SWIR: combination of n(OH) + d(OH) 2 n. Al-O-H 2 n. M-O-H epidote n+d. M-O-H chlorite unbound H 2 O illite n+d. Al-O-H montmorillonite halloysite kaolinite OH bending motion (d) OH stretching motion (n) • vibrational frequency depends on cation occuping octahedral sites (M) • coordination of the crystal influences OH vibration (i. e. dioctahedral = 2 M-sites filled vs. trioctahedral = all M-sites filled) 24 | Mineral Spectroscopy Theory alunite USGS Spectral Library

Mineral Chemistry - SWIR • SWIR Absorptions related to vibration of octahedrally coordinated atoms (Al 3+, Fe 2+, Fe 3+, Ca 2+, Mg 2+, Cr 3+, Ti 4+, vacancies) • Tschermak substitution (e. g. white micas) • Tetrahedral Si 4+ for Al 3+ • Octahedral Mg 2+ or Fe 2+ for Al 3+ • Cation substitution (Al, Fe and Mg) in chlorite, biotite, phlogopite, amphibole, . . . • Mg number (Fe: Mg ratio) • K vs Na vs Ca • interlayer cations in phyllosilicates < SWIR • sulphates < SWIR 25 | Mineral Spectroscopy Theory

Chlorite SWIR Spectra 26 | Mineral Spectroscopy Theory

Chlorite Cation Composition Spear, F. S. (1993) 2360 2350 2340 2330 2320 Kleppe et et al al. (2003) Kleppe 27 | Mineral Spectroscopy Theory

“””Mg(OH)””” Mineral Spectra “Mg(OH)” Mineral Spectra 28 | Mineral Spectroscopy Theory

White Mica Chemistry interlayer K, Na, Ca tetrahedral Si, Al Al, Fe, Mg, Cr, V octahedral mineralminers. com/html/musmins. stm (Mg, Fe)oct Sitet = Aloct Al tet Muscovite Phengite Scott and Yang (1997) 29 | Mineral Spectroscopy Theory

• White mica chemistry Challenge - What can be done and what can’t! interlayer K, Na, Ca tetrahedral Al. IV ↔ Si octahedral Al. VI ↔ Fe, Mg, Cr, V White mica chemistry – Al-rich (e. g. ms/par) vs. Al-poor micas (e. g. phengite) Sodic (e. g. par) vs. potassic micas (e. g. ms)? - Sorry, but no! (e. g. Martinez-Alonso et al. , 2002) 30 | Mineral Spectroscopy Theory

Sulphates ~1480 nm n+d(O-H) Bishop & Murad (2005) 31 | Mineral Spectroscopy Theory Na/(Na+K) ca. 4500 to 5000 nm ~6000 nm 2 n 3(SO 4)2 -, 2 d(OH) { 2 n(O-H), n+2 d(H 2 O) 1760 nm d(H 2 O) Bishop & Murad (2005)

Sulphate Mineral Spectra OH Al. OH OH Fe. OH H 2 O 32 | Mineral Spectroscopy Theory H 2 O

Si(OH) Mineral Spectra 2240 nm 33 | Mineral Spectroscopy Theory

Carbonate SWIR Spectra - I 2300 -2400 nm Iron absorption Variable CO 3 absorption 34 | Mineral Spectroscopy Theory

Carbonate SWIR Spectra - II Mg 35 | Mineral Spectroscopy Theory Ca

Carbonates SWIR 2300 -2400 nm TIR Iron absorption Variable CO 3 absorption 36 | Mineral Spectroscopy Theory Ramanaidou et al. (accepted)

Feldspar TIR Reflectance Spectra alkali plagioclase 37 | Mineral Spectroscopy Theory

Silicate TIR Reflectance Spectra Quartz Microcline Hornblende Muscovite Hedenbergite Chlorite Almandine Fayalite 38 | Mineral Spectroscopy Theory

TIR-indices vs. Geochem of igneous rocks CF : SCFM (Si. O 2/(Si. O 2+Mg. O+Fe. Otot+Ca. O)) Dacite SCFM Intermediate Basic Basaltic Andesine (whole rock geochem) Rhyolite Acidic Ultrabasic PD 03 (Ti. O 2 3. 82 ) MM 03 A (Ti. O 2 0. 63) Pyroxene 39 | Mineral Spectroscopy Theory Feldspar Quartz Christiansen Feature (coloured dots: FTIR) Salisbury & Walter (1989); Iglesias et al. (2013)

Water Effects • Water is SWIR active (not VNIR) • Water is a blackbody in TIR • Major water absorptions at 1450, 1920, 2700 and 7000 nm • Major ramp down from 1000 - 2700 nm • Samples should therefore be “dry” • Different types of water can be spectrally measured • Hydrous species (eg. Smectites) 40 | Mineral Spectroscopy Theory

SWIR Water Spectrum unbound water 41 | Mineral Spectroscopy Theory

Dry and Wet Cracow Kaolinite 42 | Mineral Spectroscopy Theory

Particle Size Effects Rock versus powder measurements • Generally smaller particle size (powders) yields brighter spectra • Powders produce relatively weaker absorptions due to greater surface scattering and less volume scattering Not all minerals react to grain size effects in the same way or to the same degree volume (multiple/single) scattering absorption coefficient (opaque/transparent) 43 | Mineral Spectroscopy Theory

Mineral Mixture Effects • Linear mixtures • magnitude of spectral features correlated with abundance • single scattering (e. g. many clays) • Non-linear mixtures • Magnitude of spectral features correlated non-linearly with abundance (e. g. carbonates) • multiple scattering • contrasting absorption coefficients (opaques and transparent materials like sulphides mixed with carbonates/quartz/mica/chlorite). 44 | Mineral Spectroscopy Theory

Non linear mixing 45 | Mineral Spectroscopy Theory King et al. (2004)

SWIR functional groups of major rock forming minerals (Laukamp, 2010) 46 | Mineral Spectroscopy Theory

Spectral Libraries • USGS http: //speclab. cr. usgs. gov/spectral. lib 06/ds 231/datatable. html • JPL http: //speclib. asu. edu/libmaker. php • ASU http: //speclib. jpl. nasa. gov/search-1/mineral • RRUFF http: //rruff. info/ • CSIRO currently only accessible in The Spectral Geologist software • . . . 47 | Mineral Spectroscopy Theory

TIR SL FTIR XRD ASD 48 | Mineral Spectroscopy Theory EPMA

Thank you CSIRO Mineral Resources Flagship Carsten Laukamp Geoscientist t +61 8 6436 8754 e carsten. laukamp@csiro. au w http: //c 3 dmm. csiro. au/

References • Cudahy, T. & Ramanaidou, E. R. , 1997. Measurement of the hematite: goethite ratio using field visible and near-infrared reflectance spectrometry in channel iron deposits, Western Australia: Australian Journal of Earth Sciences, v. 44, p. 411− 420. • Cudahy, T. J. , Caccetta, M. , Cornelius, A. , Hewson, R. , Wells, M. , Skwarnecki, M. , Halley, S. , Hausknecht, P. , Mason, P. , Quigley, M. , 2005. Regolith, geology and alteration mineral maps from new generation airborne and satellite remote sensing technologies. - MERIWA Project M 370, Report 252, 126 pages. • Cudahy, T. , Jones, M. , Thomas, M. , Laukamp, C. , Caccetta, M. , Hewson, R. , Rodger, A. , Verrall, M. , 2008. Next generation mineral mapping: Queensland airborne Hy. Map and satellite ASTER surveys 2006– 2008. CSIRO, p. 161. • Iglesias, M. L. , Laukamp, C. , Alves Rolim, S. B. , Barros Binotto, R. (accepted): Thermal Infrared Spectroscopy and Geochemical Analyses of Volcanic Rocks from the Paraná Basin (Brazil). - 13 th International Congress of the Brazilian Geophysical Society & EXPOGEf, 26. -29. August 2013, Rio de Janeiro, Brazil, 4 pp. • Jakubec, J. , 2004. Role of geology in diamond project development. - Lithos, 76, 337 -345. • King, P. L. , Ramsey, M. S. , Swayze, G. A. , 2004. Infrared Spectroscopy in Geochemistry, Exploration Geochemistry, and Remote Sensing. Mineralogical Association of Canada. • Kleppe, A. K. , Jephcoat, A. P. , Welch, M. D. , 2003. The effect of pressure upon hydrogen bonding in chlorite: A Raman spectroscopic study of clinochlore to 26. 5 Gpa. American Mineralogist, 88, 567 -573. • Laukamp, C. , Termin, K. A. , Pejcic, B. , Haest, M. , Cudahy, T. , 2012. Vibrational spectroscopy of calcic amphiboles - applications for exploration and mining. European Journal of Mineralogy 24, 863 -878. • Scott, K. , Yang, K. , 1997. Spectral Reflectance Studies of white micas. CSIRO Exploration and Mining Report, 439 R, 41 pages. • Spear, F. S. , 1993, Metamorphic Phase Equilibria and Pressure-Temperature-Time Paths, Mineralogical Society of America. • Hecker, C. , van der Meijde, M. , van der Meer, F. , 2010. Thermal infrared spectroscopy on feldspars – Successes, limitations and their implications for remote sensing. 50 | Mineral Spectroscopy Theory

Additional Slides 51 | Mineral Spectroscopy Theory

Vibrational Spectroscopy of Tremolite (Amphibole) nm d = fundamental bending vibration n = fundamental stretching vibration 2, 3, 4 n = 1 st, 2 nd, 3 rd overtone of fundamental stretching vibration Wavenumber [cm-1] 10000 25000 7100 5000 ν(OH)+δ(OH) 2000 OH stretching ν(OH) 1000 Si-O stretching ν(Si-O) 500 OHbending δ(OH) 400 Si-O bending M-O stretching Reflectance Absorbance Tremolite 2 * ν(OH) Ca 2 Mg 5 Si 2 O 22(OH)2 3700 [cm-1] 7348 4315, 4358 4199 3674 [ m] 1. 36 2. 295, 2. 317 2. 320 2. 380 2. 72 Hy. Logging VNIR/SWIR / ASD 0. 35 – 2. 5 m 52 | Mineral Spectroscopy Theory 684, 641 14. 62, 15. 60 Hy. Logging TIR 5. 0 – 14. 7 m FTIR Bruker – Hyperion Microscope 525 19. 05 Wavelength [ m]

White Mica Chemistry – mapping exchange vectors 2200 -feature: combination of n. OH(e. g. 3640 cm-1) + d. Al 2 OH (e. g. 900 cm -1) = 4540 cm-1 = 2202 nm n+d. Al 2 OH: ~2185 Ca-endmember: Margarite Na. Al. VI 2 Al. IVSi 3 O 10(OH)2 (Ca. Al. VI 2(Al. IV 2 Si 2)O 10(OH)2) Paragonite K <= Muscovite s lvu => So n+d. Al 2 OH: ~2190 Na l. IV VI A Al 2350 -feature: combination of n. OH- + d. Mg 3 OH Mg KAl. VI 2 Al. IVSi 3 O 10(OH)2 22 Si 00 W Al VI Al IV Si Na. Fe. Al. VI 2 Si 4 O 10(OH)2 Na. Mg. Al. VI 2 Si 4 O 10(OH)2 Phengites Fe n+d. Al 2 OH: ~2215 K K(Al. VI, Fe, Mg)1. 5 Al. IV 0. 5 Si 3. 5 O 10(OH)2 Ferroceladonite KFe. Al. VI 2 Si 4 O 10(OH)2 n+d. Fe 3+3 OH: ~2355? Fe Mg 2350 W Na Celadonite KMg. Al. VI 2 Si 4 O 10(OH)2 n+d. Mg 3 OH: ~2348 1) Bishop et al. (2008) 53 | Mineral Spectroscopy Theory

Overlapping absorption features Are hydrated phyllosilicates all the same? !? • di-octahedral 1: 1 phyllosilicate ("7Å phase"): e. g. kaolinite • tri-octahedral 2: 1 phyllosilicate ("9Å phase"): e. g talc • di-octahedral 2: 1 phyllosilicate ("10Å phase"): e. g. muscovite, phengite, celadonite • tri-octahedral 2: 1 phyllosilicate ("10Å phase"): e. g. biotite • tri-octahedral 2: 1: 1 phyllosilicate ("14Å phase"): e. g. chlorite all sites occupied? ! tetrahedral octahedral tetrahedral interlayer Meunier (2005) 54 | Mineral Spectroscopy Theory

GEOSCIENCE PRODUCT APPLICABLE FOR THE LISTED MINERALS BASE ALGORITHM (EXAMPLES) Phengite, paragonite/muscovite, 2200 D (Relative absorption depth of the 2200 nm absorption for which the continuum is removed between 2120 and illite/brammalite 2245, determined using a 3 band polynomial fit around the band with the lowest reflectance) White mica abundance index Masked with: 2160 D (R 2138+R 2190)/(R 2156 +R 2179) < 1. 005 and 2350 D ((R 2326+R 2376)/(R 2343+R 2359)) > 1. 005 Composition of white micas, ranging from Al- 2200 W (Minimum wavelength of the 2200 nm absorption for which the continuum is removed between 2120 and rich(paragonite/muscovite) to Al-poor 2245, determined using a 3 band polynomial fit around the band with the lowest reflectance) (phengite) Masked with: 2160 D (R 2138+R 2190)/(R 2156 +R 2179) < 1. 005 and 2350 D ((R 2326+R 2376)/(R 2343+R 2359)) > 1. 005 White mica composition index Chlorite-epidote(-biotite) index abundance Chlorite, epidote, (biotite) Chlorite(-biotite) composition index Applied stretch based on Duke (1994) 2250 D (Relative absorption depth of the 2250 nm absorption for which the continuum is removed between 2230 and 2270, determined using a 3 band polynomial fit around the band with the lowest reflectance) Masked with: 2250 D>0. 01, 2230 nm<2250 wvl<2270 nm Mg# of chlorite (influenced by epidote and 2250 W (Relative absorption depth of the 2250 nm absorption for which the continuum is removed between 2230 and biotite) 2270, determined using a 3 band polynomial fit around the band with the lowest reflectance) Masked with: 2250 D 3 pfit>0. 01, 2230 nm<2250 wvl<2270 nm; 1550 D<0. 01 Applied stretch based on Bishop et al. (2008) 2250 D (Relative absorption depth of the 2250 nm absorption for which the continuum is removed between 2230 and 2270, determined using a 3 band polynomial fit around the band with the lowest reflectance) Epidote abundance index Epidote series minerals Epidote composition index Masked with: 2250 D>0. 01, 2230 nm<2250 wvl<2270 nm; 1550 D>0. 01 Compositional change of the epidote series 1550 W (Relative absorption depth of the 1550 nm absorption for which the continuum is removed between 1500 and minerals, from epidote s. s. to clinozoisite 1610, determined using a 3 band polynomial fit around the band with the lowest reflectance) Amphibole talc abundance index 3) amphibole group (e. g. actinolite hornblende-series), talc group Amphibole composition index 3) Mg# of amphibole and talc group Quartz abundance index Quartz Garnet abundance index (11100 P_3 pfit) Garnet composition index (11100 W_3 pfit) Garnet Pyroxene abundance index (9000 P_3 pfit) Pyroxene composition index (9000 W_3 pfit) Vesuvianite abundance index (9900 P_3 pfit) Vesuvianite composition index (9900 W_3 pfit) Carbonate abundance index (6500 P_3 pfit) Pyroxene Vesuvianite Pyroxene Carbonate composition Spectroscopy index Theory. Pyroxene 55 | Mineral (14000 DW_3 pfit) Applied stretch based on Roache et al. (2011) series, 2380 D ((R 2365+R 2415)/(R 2381+R 2390)) Masked with: (R 2265+R 2349)/(R 2316+R 2333) > 1. 01 +(R 2136+R 2188)/(R 2153+2171) < 1. 005) 2390 W (Wavelength of absorption minimum calculated using a fitted 4 th order polynomial between 2365 and 2430 nm, focused between 2380 and 2410 nm) Masked with: 2080 D<0. 01 8635 D Relative depth of the 8635 nm Reststrahlen feature for which the continuum is removed between 8565 and 8705 nm, determined using a 3 band polynomial fit around the band with the lowest reflectance 11100 P Relative height of the reflectance peak between 10850 and 11300 nm, determined using a 3 band polynomial fit around the band with the highest reflectance 11100 W Wavelength position of the reflectance peak between 10850 and 11300 nm, determined using a 3 band polynomial fit around the band with the highest reflectance 9000 P Relative height of the reflectance peak between 8650 and 9350 nm, determined using a 3 band polynomial fit around the band with the highest reflectance 9000 W Wavelength position of the reflectance peak between 8650 and 9350 nm, determined using a 3 band polynomial fit around the band with the highest reflectance 9900 P Relative height of the reflectance peak between 9500 and 10200 nm, determined using a 3 band polynomial fit around the band with the highest reflectance 9900 W Wavelength position of the reflectance peak between 9500 and 10200 nm, determined using a 3 band polynomial fit around the band with the highest reflectance 6500 P Relative height of the reflectance peak between 10850 and 11300 nm, determined using a 3 band polynomial fit around the band with the highest reflectance 14000 DW Wavelength position of the reflectance minimum between 13000 and 14000 nm, determined using a 3 band polynomial fit around the band with the lowest reflectance
 Carsten laukamp
 Csiro.au
 Minerals of karnataka
 Mineral resources and petroleum authority of mongolia
 Chapter 13 mineral resources and mining worksheet answers
 Uzbekistan
 Mississippi mineral resources institute
 Portfolio committee on mineral resources and energy
 Mineral resources
 Jacquinot advantage ftir
 Theory of atomic absorption spectroscopy
 Infrared spectroscopy theory
 Transformed and transforming resources
 Fixed resources and variable resources
 Renewable resources vs nonrenewable resources
 Carsten olsson
 Carsten griwodz
 Carsten mathes
 Carsten griwodz
 Carsten honerkamp
 Carsten rahbek
 Carsten gerke
 Carsten dünckel
 Carsten and yuri
 Carsten nystrup
 Carsten dahl mørch
 Carsten zornig
 Carsten vagn hansen kolesterol
 Dr. carsten winkler
 Carsten breul
 Carsten griwodz
 Carsten dominik
 Prof. carsten grüllich
 Carsten griwodz
 Carsten ingerslev
 Carsten kronborg bak
 Transport layer
 Carsten corneliussen
 Carsten winkler fond of
 Carsten hornstrup
 Carsten jakobi uni mainz
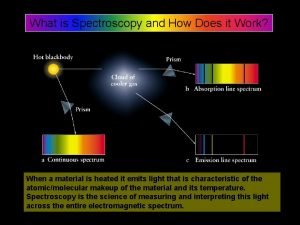
 What is spectroscopy
 Spectroscopy principle
 Terahertz spectroscopy principles and applications
 How is beer-lambert law used in spectroscopy
 Ir spectroscopy sample preparation
 Komponen aas
 Difference between ir and raman spectroscopy
 Difference between ir and raman spectroscopy
 Advantages and disadvantages of spectroscopy
 Objectives of spectroscopy
 Pes spectroscopy
 Near infrared spectroscopy instrumentation
 Stretching and bending vibrations in ir spectroscopy
 Mass spectroscopy principle
 Advantages and disadvantages of spectroscopy
