METAANALYTIC INTEGRATION OF DIAGNOSTIC ACCURACY STUDIES IN STATA








- Slides: 58
METAANALYTIC INTEGRATION OF DIAGNOSTIC ACCURACY STUDIES IN STATA Ben A. Dwamena, MD Department of Radiology (Nuclear Medicine) Thursday October 25, 2007 FIRST WEST COAST STATA USERS' GROUP MEETING
OUTLINE Evaluation of Diagnostic Tests p Rationale For Meta-analysis p Existing Methodology and Limitations p Emerging alternative p Implementation in Stata using midas p Thursday October 25, 2007 FIRST WEST COAST STATA USERS' GROUP MEETING
CLINICAL EVALUATION OF A DIAGNOSTIC TEST p Consider a population to be made up of two groups: those with a disease and those without it. A test aims to identify people as belonging to one of these two groups. p It is usually assumed that a gold standard is available which can perfectly distinguish groups but cannot be used in routine practice due to problems such as invasiveness and/or cost. p However alternative, more practical, tests are available which are imperfect. Thursday October 25, 2007 FIRST WEST COAST STATA USERS' GROUP MEETING
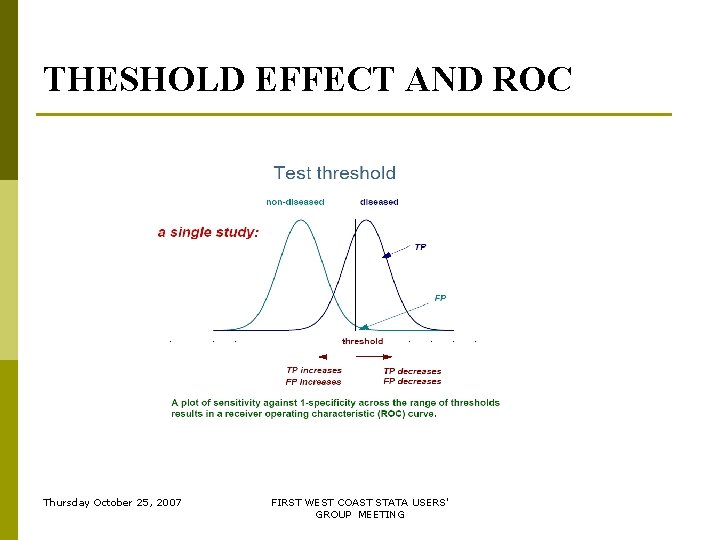
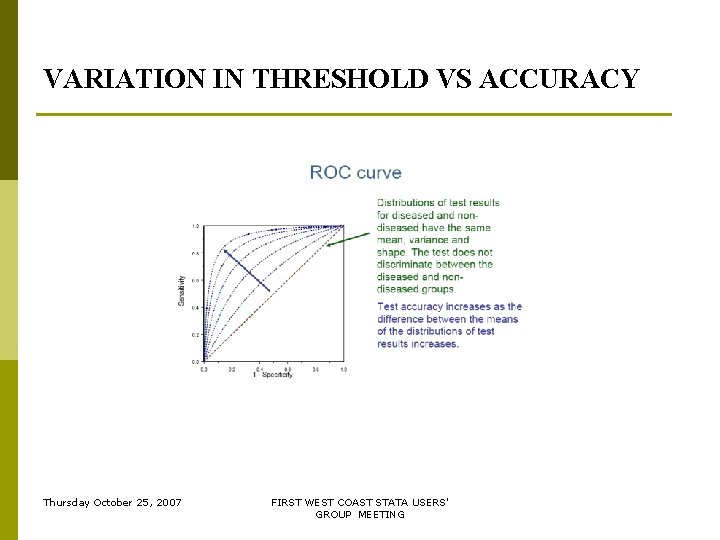
CLINICAL EVALUATION OF A DIAGNOSTIC TEST p Many test outcomes are measured on an explicit continuous scale (e. g. level of a chemical in the blood). p Changing the threshold test level which defines a positive and a negative test will also change the performance characteristics of a test. Thursday October 25, 2007 FIRST WEST COAST STATA USERS' GROUP MEETING
THESHOLD EFFECT AND ROC Thursday October 25, 2007 FIRST WEST COAST STATA USERS' GROUP MEETING
VARIATION IN THRESHOLD VS ACCURACY Thursday October 25, 2007 FIRST WEST COAST STATA USERS' GROUP MEETING
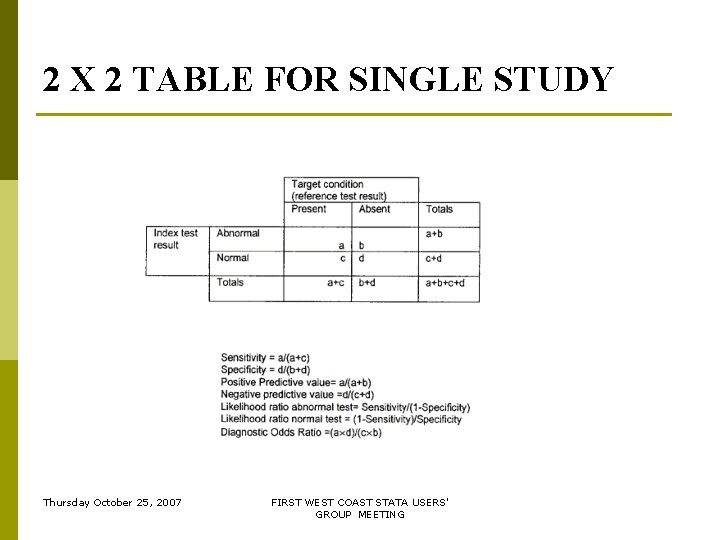
2 X 2 TABLE FOR SINGLE STUDY Thursday October 25, 2007 FIRST WEST COAST STATA USERS' GROUP MEETING
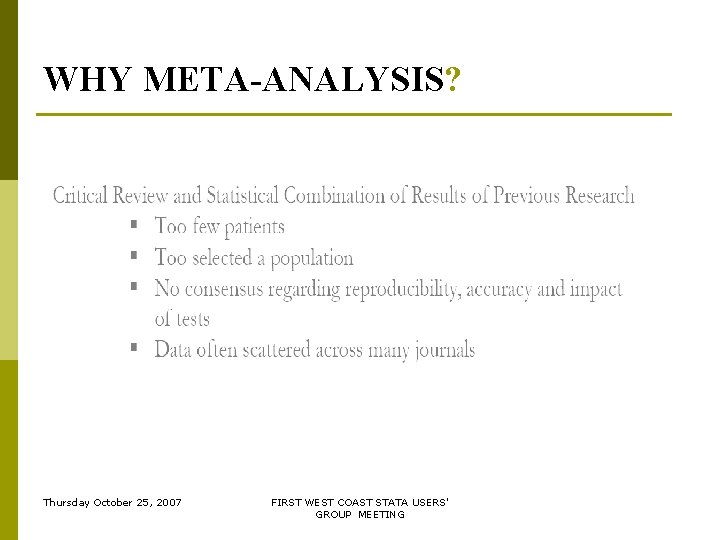
WHY META-ANALYSIS? Thursday October 25, 2007 FIRST WEST COAST STATA USERS' GROUP MEETING
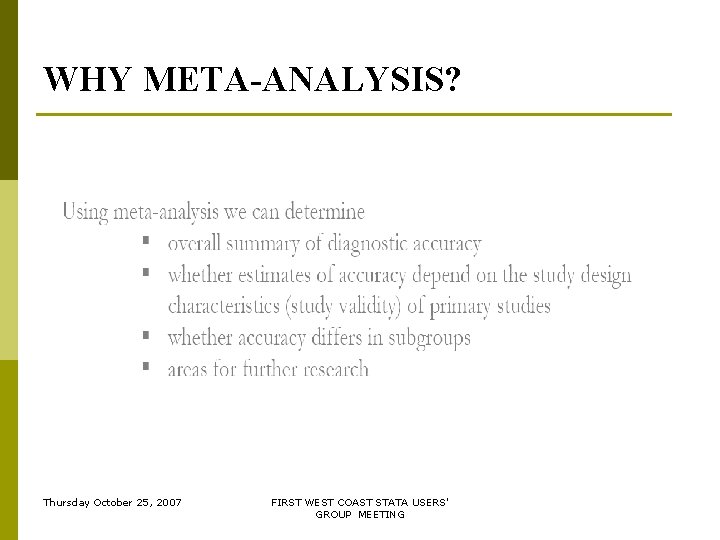
WHY META-ANALYSIS? Thursday October 25, 2007 FIRST WEST COAST STATA USERS' GROUP MEETING
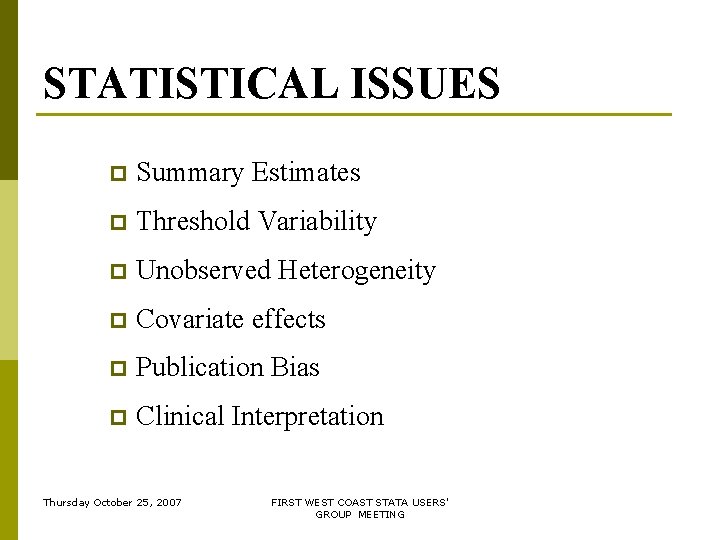
STATISTICAL ISSUES p Summary Estimates p Threshold Variability p Unobserved Heterogeneity p Covariate effects p Publication Bias p Clinical Interpretation Thursday October 25, 2007 FIRST WEST COAST STATA USERS' GROUP MEETING
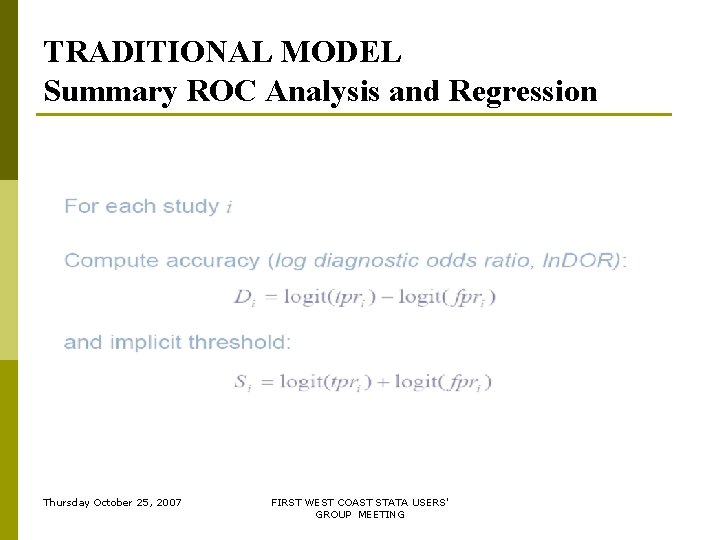
TRADITIONAL MODEL Summary ROC Analysis and Regression Thursday October 25, 2007 FIRST WEST COAST STATA USERS' GROUP MEETING
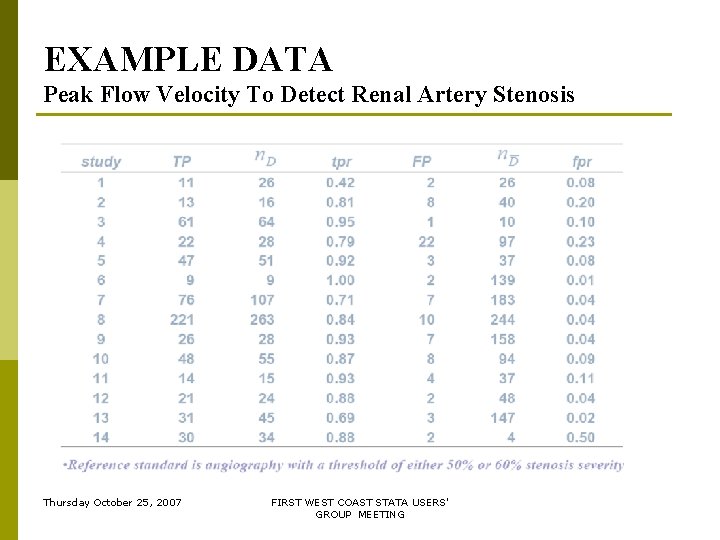
EXAMPLE DATA Peak Flow Velocity To Detect Renal Artery Stenosis Thursday October 25, 2007 FIRST WEST COAST STATA USERS' GROUP MEETING
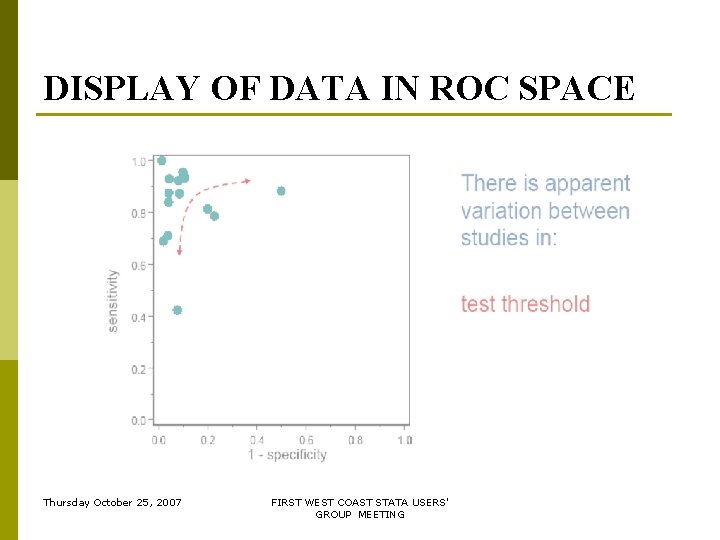
DISPLAY OF DATA IN ROC SPACE Thursday October 25, 2007 FIRST WEST COAST STATA USERS' GROUP MEETING
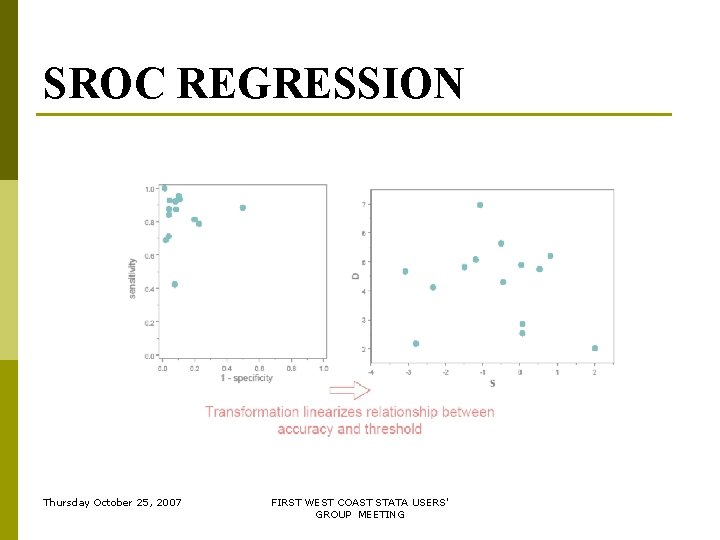
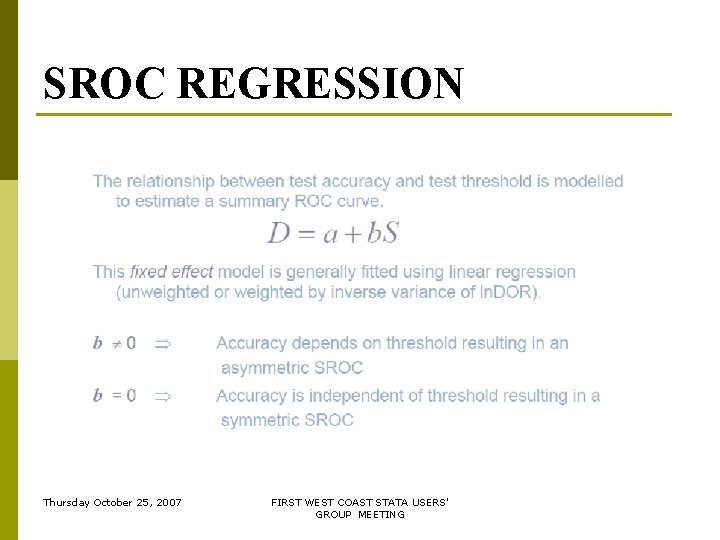
SROC REGRESSION Thursday October 25, 2007 FIRST WEST COAST STATA USERS' GROUP MEETING
SROC REGRESSION Thursday October 25, 2007 FIRST WEST COAST STATA USERS' GROUP MEETING
LIMITATIONS OF SROC MODEL Thursday October 25, 2007 FIRST WEST COAST STATA USERS' GROUP MEETING
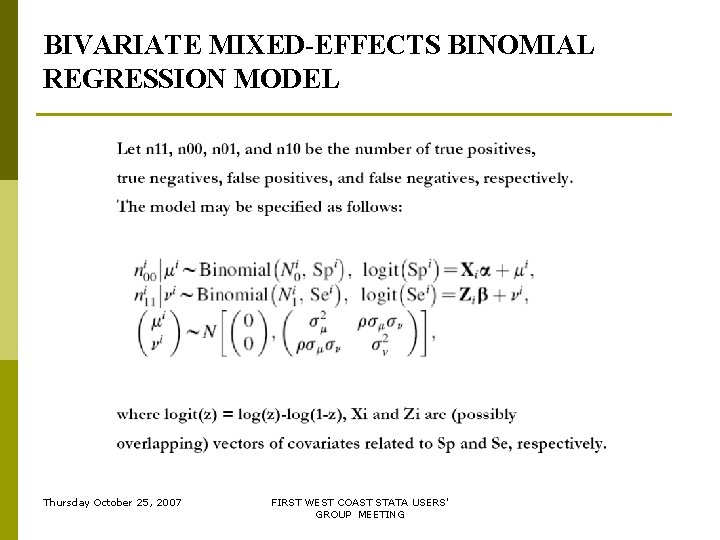
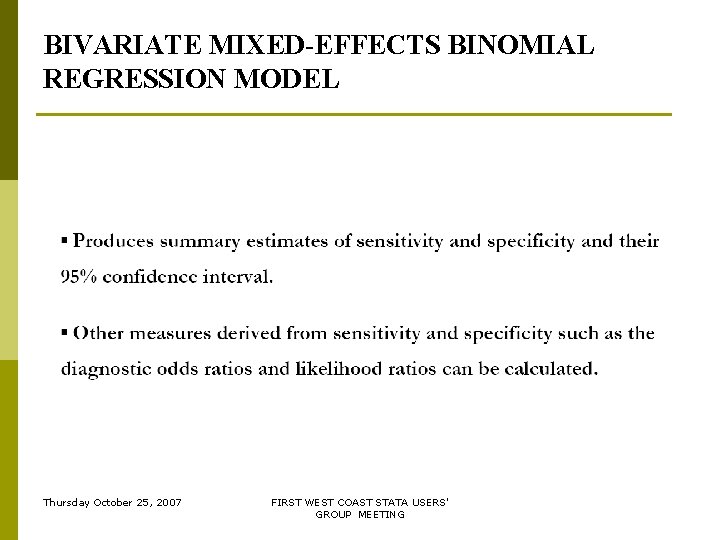
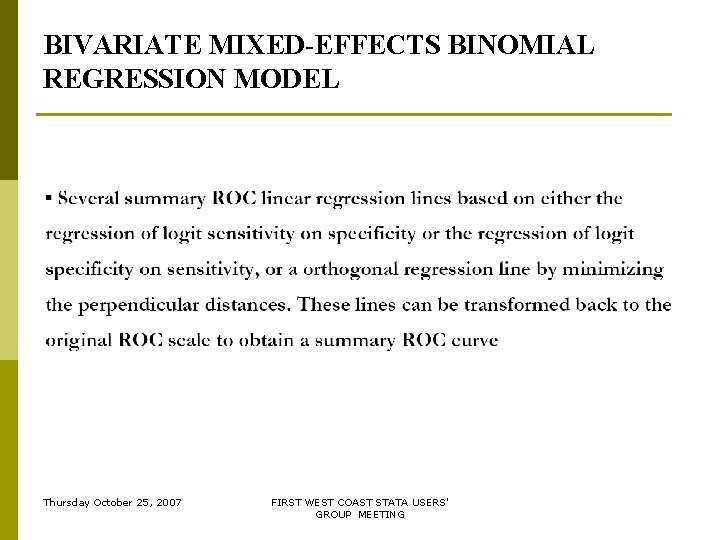
BIVARIATE MIXED-EFFECTS BINOMIAL REGRESSION MODEL Thursday October 25, 2007 FIRST WEST COAST STATA USERS' GROUP MEETING
BIVARIATE MIXED-EFFECTS BINOMIAL REGRESSION MODEL Thursday October 25, 2007 FIRST WEST COAST STATA USERS' GROUP MEETING
BIVARIATE MIXED-EFFECTS BINOMIAL REGRESSION MODEL Thursday October 25, 2007 FIRST WEST COAST STATA USERS' GROUP MEETING
BIVARIATE MIXED-EFFECTS BINOMIAL REGRESSION MODEL Thursday October 25, 2007 FIRST WEST COAST STATA USERS' GROUP MEETING
BIVARIATE MIXED-EFFECTS BINOMIAL REGRESSION MODEL Thursday October 25, 2007 FIRST WEST COAST STATA USERS' GROUP MEETING
BIVARIATE MIXED-EFFECTS BINOMIAL REGRESSION MODEL Thursday October 25, 2007 FIRST WEST COAST STATA USERS' GROUP MEETING
BINOMIAL REGRESSION MODEL XTMELOGIT CODE Thursday October 25, 2007 FIRST WEST COAST STATA USERS' GROUP MEETING
BINOMIAL REGRESSION MODEL GLAMM CODE Thursday October 25, 2007 FIRST WEST COAST STATA USERS' GROUP MEETING
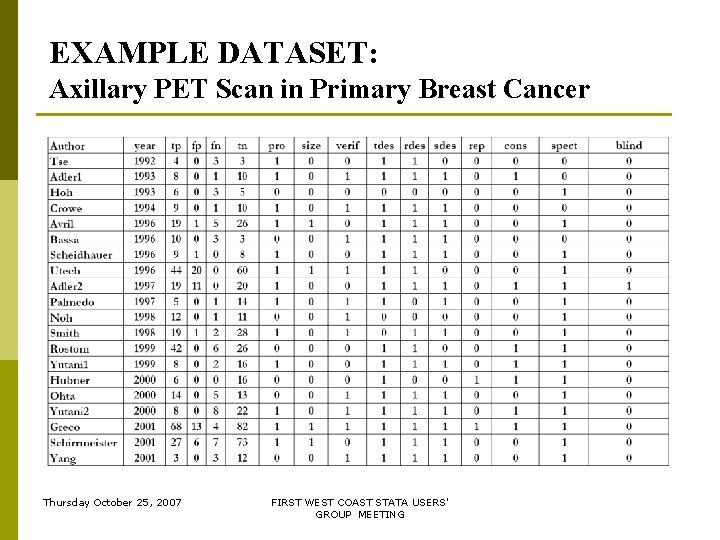
EXAMPLE DATASET: Axillary PET Scan in Primary Breast Cancer Thursday October 25, 2007 FIRST WEST COAST STATA USERS' GROUP MEETING
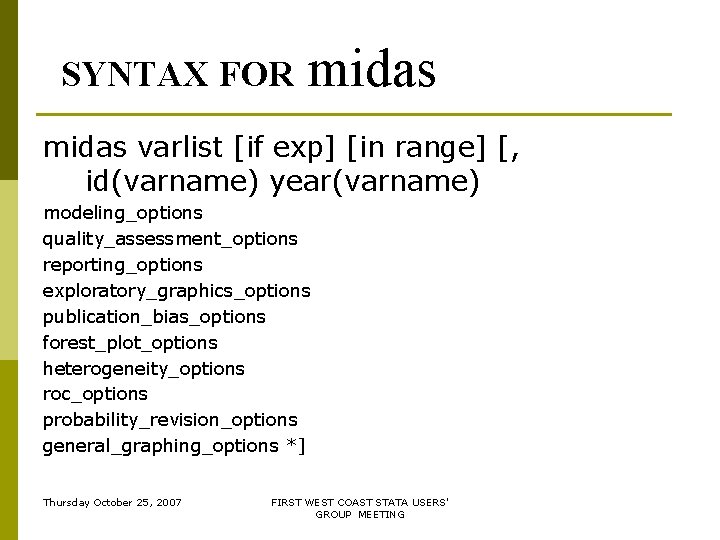
SYNTAX FOR midas varlist [if exp] [in range] [, id(varname) year(varname) modeling_options quality_assessment_options reporting_options exploratory_graphics_options publication_bias_options forest_plot_options heterogeneity_options roc_options probability_revision_options general_graphing_options *] Thursday October 25, 2007 FIRST WEST COAST STATA USERS' GROUP MEETING
MODELING Options estimator(g|x) n provides a choice between estimation with xtmelogit in release 10 versus gllamm in version 9 or earlier. nip() n specifies the number of integration points used for maximum likelihood estimation based on adaptive gaussian quadrature. n Default is set at 15 for midas (default in xtmelogit is 7). n Higher values improve accuracy at the expense of execution times. n model will be estimated by Laplacian approximation using nip(1) Thursday October 25, 2007 FIRST WEST COAST STATA USERS' GROUP MEETING
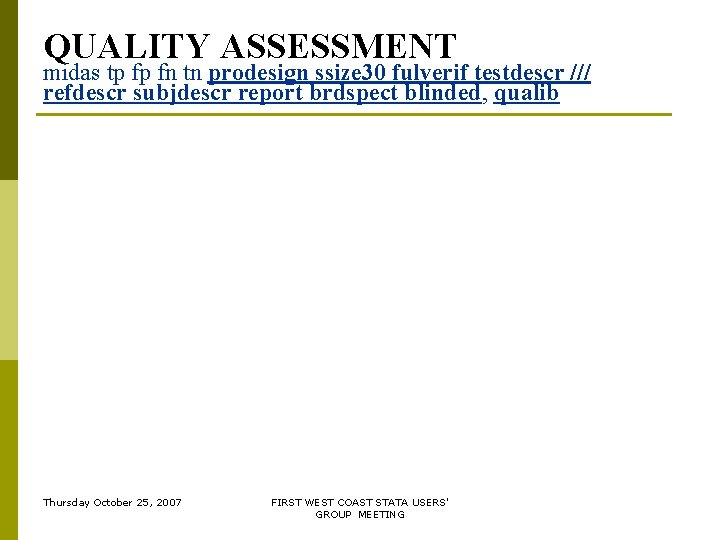
QUALITY ASSESSMENT Options qualitab p creates, using optional varlist of study quality items (presence=1, other=0) a table showing frequency of methodologic quality items. qualibar p creates, combined with optional varlist of study quality items (presence=1, other=0) calculates study-specific quality scores and plots a bargraph of methodologic quality. Qlab p may be combined with qualitab or qualibar to use variable labels for table and bargraph of methodologic items. Thursday October 25, 2007 FIRST WEST COAST STATA USERS' GROUP MEETING
QUALITY ASSESSMENT midas tp fp fn tn prodesign ssize 30 fulverif testdescr /// refdescr subjdescr report brdspect blinded, qualib Thursday October 25, 2007 FIRST WEST COAST STATA USERS' GROUP MEETING
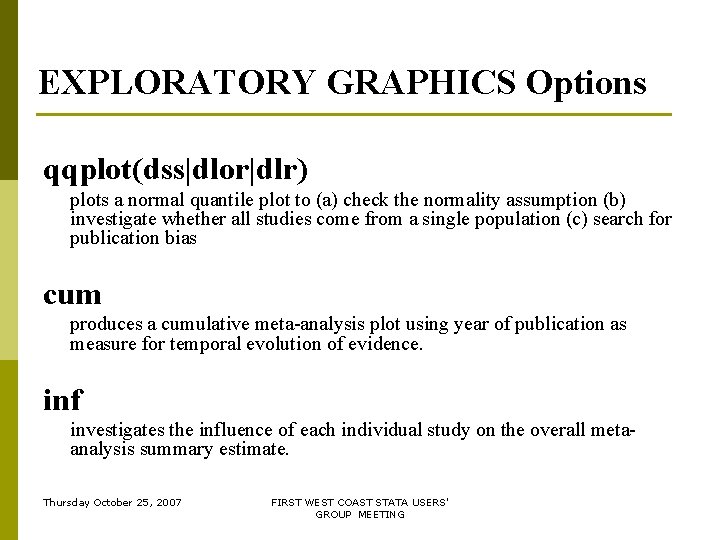
EXPLORATORY GRAPHICS Options qqplot(dss|dlor|dlr) plots a normal quantile plot to (a) check the normality assumption (b) investigate whether all studies come from a single population (c) search for publication bias cum produces a cumulative meta-analysis plot using year of publication as measure for temporal evolution of evidence. inf investigates the influence of each individual study on the overall metaanalysis summary estimate. Thursday October 25, 2007 FIRST WEST COAST STATA USERS' GROUP MEETING
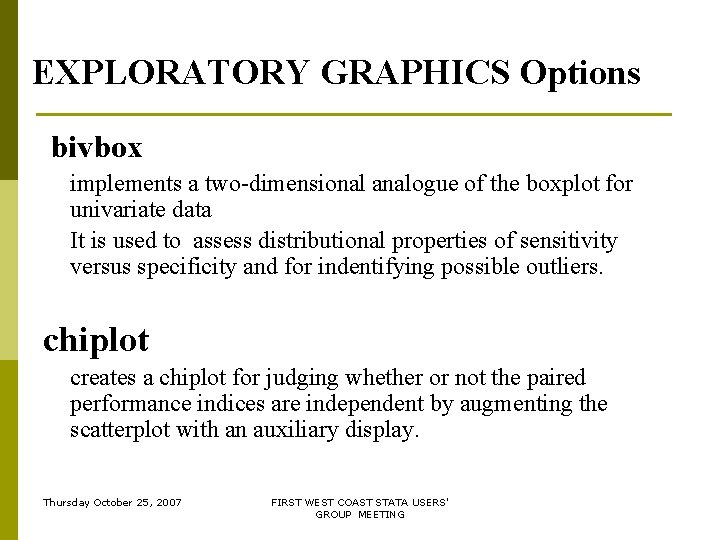
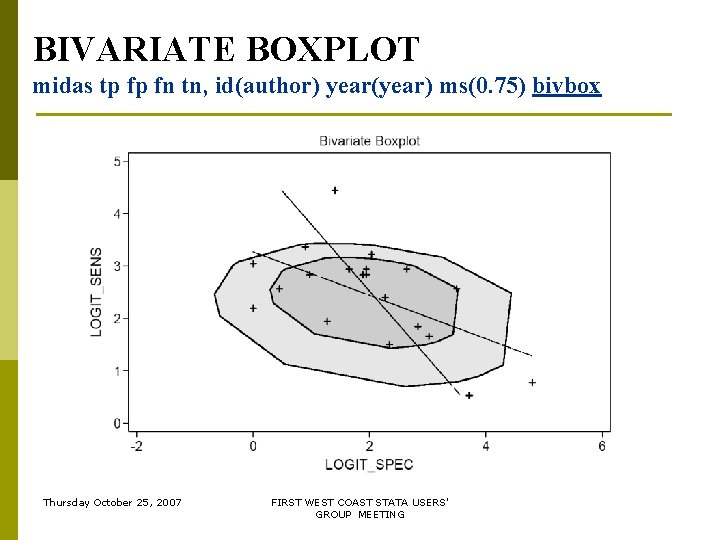
EXPLORATORY GRAPHICS Options bivbox implements a two-dimensional analogue of the boxplot for univariate data It is used to assess distributional properties of sensitivity versus specificity and for indentifying possible outliers. chiplot creates a chiplot for judging whether or not the paired performance indices are independent by augmenting the scatterplot with an auxiliary display. Thursday October 25, 2007 FIRST WEST COAST STATA USERS' GROUP MEETING
CHI-PLOT midas tp fp fn tn, id(author) year(year) ms(0. 75) chip Thursday October 25, 2007 FIRST WEST COAST STATA USERS' GROUP MEETING
BIVARIATE BOXPLOT midas tp fp fn tn, id(author) year(year) ms(0. 75) bivbox Thursday October 25, 2007 FIRST WEST COAST STATA USERS' GROUP MEETING
REPORTING Options table(dss|dlr|dlor) Creates a table of study specific performance estimates Reports measure-specific summary estimates Provides results of homogeneity (chi_squared) and inconsistency(I_squared) tests. dss, dlr or dlor represent the paired performance measures: sensitivity/specificity, positive/negative likelihood ratios and diagnostic score/odds ratios. Thursday October 25, 2007 FIRST WEST COAST STATA USERS' GROUP MEETING
SUMMARY RESULTS midas tp fp fn tn, id(author) year(year) es(x) ms(0. 75) res(all) Thursday October 25, 2007 FIRST WEST COAST STATA USERS' GROUP MEETING
REPORTING Options results(all) provides summary statistics, group-specific between-study variances, likelihood ratio test statistics and other global homogeneity tests. results(het) provides group-specific between-study variances, likelihood ratio test statistics and other global homogeneity tests. results(sum) provides summary statistics for all performance indices Thursday October 25, 2007 FIRST WEST COAST STATA USERS' GROUP MEETING
SUMMARY RESULTS midas tp fp fn tn, id(author) year(year) ms(0. 75) es(x) res(sum) Thursday October 25, 2007 FIRST WEST COAST STATA USERS' GROUP MEETING
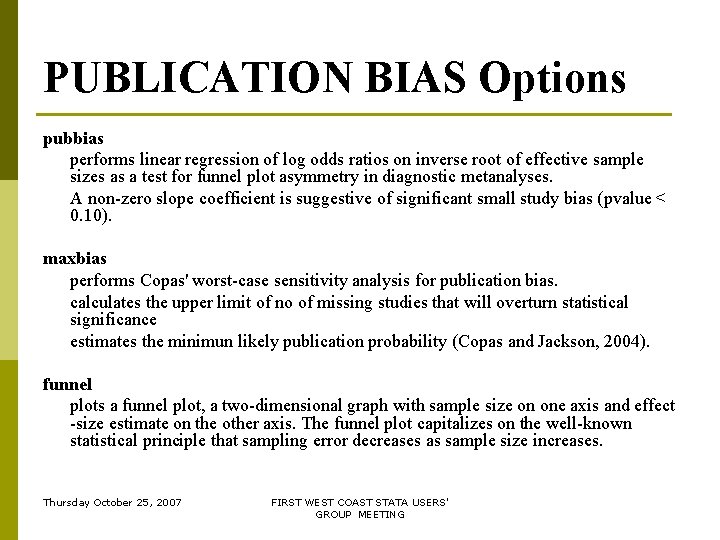
PUBLICATION BIAS Options pubbias performs linear regression of log odds ratios on inverse root of effective sample sizes as a test for funnel plot asymmetry in diagnostic metanalyses. A non-zero slope coefficient is suggestive of significant small study bias (pvalue < 0. 10). maxbias performs Copas' worst-case sensitivity analysis for publication bias. calculates the upper limit of no of missing studies that will overturn statistical significance estimates the minimun likely publication probability (Copas and Jackson, 2004). funnel plots a funnel plot, a two-dimensional graph with sample size on one axis and effect -size estimate on the other axis. The funnel plot capitalizes on the well-known statistical principle that sampling error decreases as sample size increases. Thursday October 25, 2007 FIRST WEST COAST STATA USERS' GROUP MEETING
FUNNEL PLOT midas tp fp fn tn, ms(0. 75) fun Thursday October 25, 2007 FIRST WEST COAST STATA USERS' GROUP MEETING
FUNNEL PLOT ASYMMETRY TEST midas tp fp fn tn, pubb Thursday October 25, 2007 FIRST WEST COAST STATA USERS' GROUP MEETING
FOREST PLOT Options forest(dss|dlr|dlor) Creates summary graphs with study-specific(box) and overall(diamond) point estimates and confidence intervals for each performance index pair Confidence intervals lines are allowed to extend between 0 and 1000 beyond which they are truncated and marked by a leading arrow. fordata adds study-specific performance estimates and 95% CIs to right y-axis. Thursday October 25, 2007 FIRST WEST COAST STATA USERS' GROUP MEETING
FOREST PLOT midas tp fp fn tn, id(author) year(year) es(x) ms(0. 75) ford for(dlr) Thursday October 25, 2007 FIRST WEST COAST STATA USERS' GROUP MEETING
FOREST PLOT midas tp fp fn tn, id(author) year(year) es(x) ms(0. 45) for(dlr) Thursday October 25, 2007 FIRST WEST COAST STATA USERS' GROUP MEETING
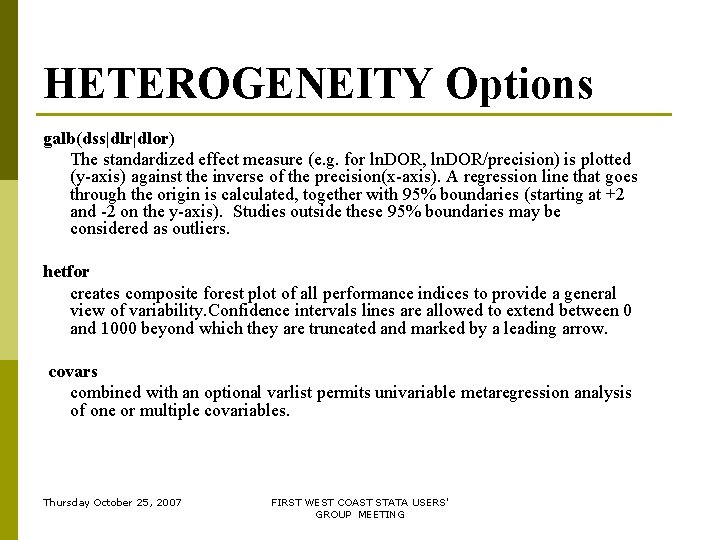
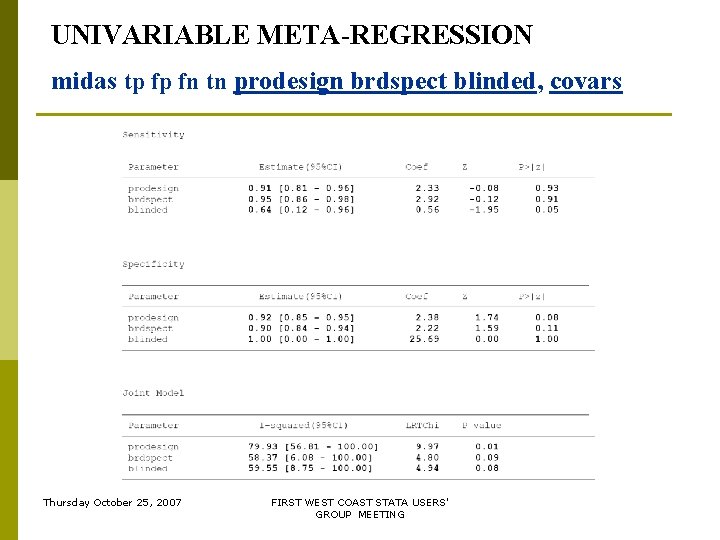
HETEROGENEITY Options galb(dss|dlr|dlor) The standardized effect measure (e. g. for ln. DOR, ln. DOR/precision) is plotted (y-axis) against the inverse of the precision(x-axis). A regression line that goes through the origin is calculated, together with 95% boundaries (starting at +2 and -2 on the y-axis). Studies outside these 95% boundaries may be considered as outliers. hetfor creates composite forest plot of all performance indices to provide a general view of variability. Confidence intervals lines are allowed to extend between 0 and 1000 beyond which they are truncated and marked by a leading arrow. covars combined with an optional varlist permits univariable metaregression analysis of one or multiple covariables. Thursday October 25, 2007 FIRST WEST COAST STATA USERS' GROUP MEETING
UNIVARIABLE META-REGRESSION midas tp fp fn tn prodesign brdspect blinded, covars Thursday October 25, 2007 FIRST WEST COAST STATA USERS' GROUP MEETING
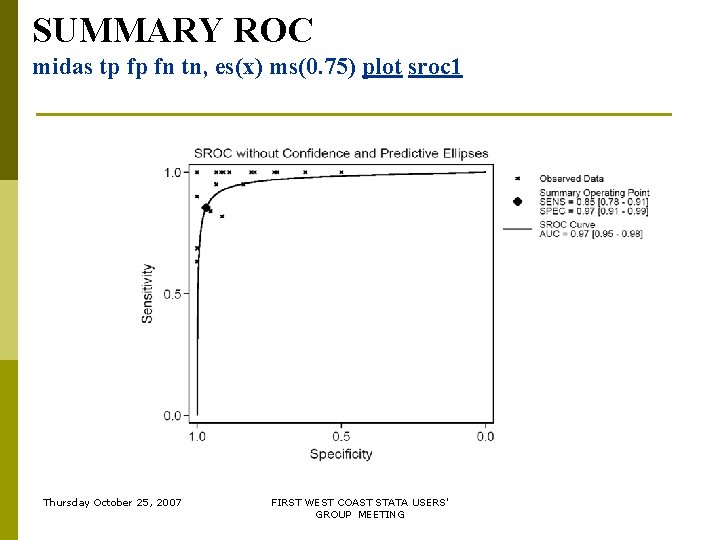
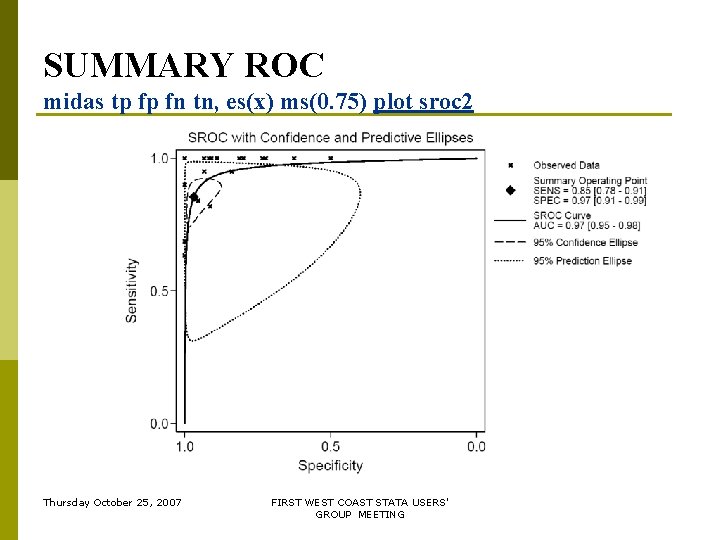
ROC Options sroc 1 plots observed datapoints, summary operating sensitivity and specificity in SROC space. sroc 2 adds confidence and prediction contours. rocplane plots observed data in receiver operating characteristic space (ROC Plane) for visual assessment of threshold effect. Thursday October 25, 2007 FIRST WEST COAST STATA USERS' GROUP MEETING
SUMMARY ROC midas tp fp fn tn, es(x) ms(0. 75) plot sroc 1 Thursday October 25, 2007 FIRST WEST COAST STATA USERS' GROUP MEETING
SUMMARY ROC midas tp fp fn tn, es(x) ms(0. 75) plot sroc 2 Thursday October 25, 2007 FIRST WEST COAST STATA USERS' GROUP MEETING
ROC PLANE midas tp fp fn tn, id(author) year(year) es(x) rocp Thursday October 25, 2007 FIRST WEST COAST STATA USERS' GROUP MEETING
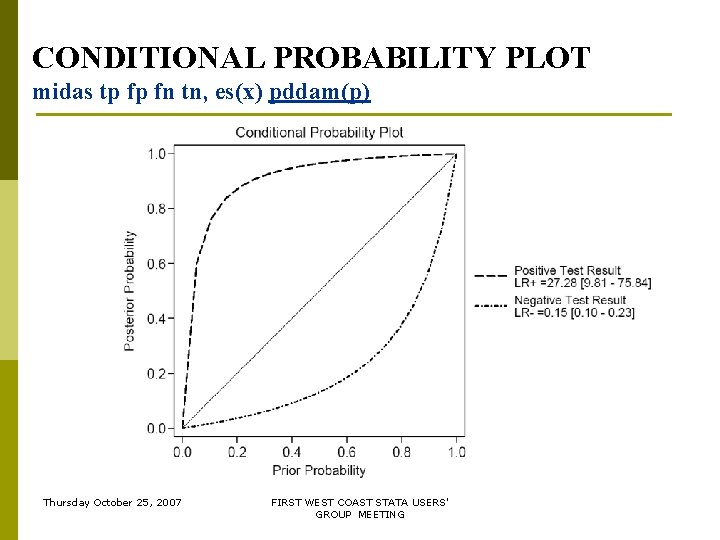
PROBABILITY REVISION Options pddam(p|r) produces a line graph of post-test probalities versus prior probabilities between 0 and 1 using summary likelihood ratios lrmatrix creates a scatter plot of positive and negative likelihood ratios with combined summary point. Plot is divided into quadrants based on strength-of-evidence thresholds to determine informativeness of measured test. Thursday October 25, 2007 FIRST WEST COAST STATA USERS' GROUP MEETING
CONDITIONAL PROBABILITY PLOT midas tp fp fn tn, es(x) pddam(p) Thursday October 25, 2007 FIRST WEST COAST STATA USERS' GROUP MEETING
UNCONDITIONAL PREDICTIVE VALUES midas tp fp fn tn, ms(0. 75) es(x) pddam(r) Thursday October 25, 2007 FIRST WEST COAST STATA USERS' GROUP MEETING
LIKELIHOOD RATIO SCATTERGRAM midas tp fp fn tn, es(x) lrmat scheme(lean 1) Thursday October 25, 2007 FIRST WEST COAST STATA USERS' GROUP MEETING
PROBABILITY REVISION Options fagan creates a plot showing the relationship between the prior probability, the likelihood ratio(combination of sensitivity and specificity), and posterior test probability. prior() combined with fagan allows user to specify a pretest probability overriding the default of using disease prevalence calculated from data when fagan is invoked alone. p Thursday October 25, 2007 FIRST WEST COAST STATA USERS' GROUP MEETING
FAGAN’S NOMOGRAM I midas tp fp fn tn, es(x) fagan scheme(lean 1) Thursday October 25, 2007 FIRST WEST COAST STATA USERS' GROUP MEETING
FAGAN’S NOMOGRAM II midas tp fp fn tn, es(x) fagan prior(. 20) scheme(lean 1) Thursday October 25, 2007 FIRST WEST COAST STATA USERS' GROUP MEETING
STANDING ON SHOULDERS OF GIANTS Thursday October 25, 2007 FIRST WEST COAST STATA USERS' GROUP MEETING
THANK YOU FOR YOUR ATTENTION p QUESTIONS? p SUGGESTIONS p COMMENTS Thursday October 25, 2007 FIRST WEST COAST STATA USERS' GROUP MEETING